Unlock instant, AI-driven research and patent intelligence for your innovation.

Chart-based data processing method and device, electronic equipment and medium

A data processing and charting technology, applied in the computer field, can solve the problems of data dispersion, poor user experience, and users cannot clearly know the data, etc., and achieve the effect of efficient management

Pending Publication Date: 2020-08-18
BEIJING BYTEDANCE NETWORK TECH CO LTD
View PDF4 Cites 0 Cited by
  • Summary
  • Abstract
  • Description
  • Claims
  • Application Information

AI Technical Summary

Problems solved by technology

[0003] However, the data required by the user is not limited to a single area, and the data in different areas may be scattered. At this time, it is very important to manage multiple constituencies selected by the user.
[0004] In the prior art, for a chart generated by multiple areas, the user cannot clearly know which area of ​​the original online table corresponds to the data in the chart; at the same time, if the image in the chart needs to be changed, the current chart needs to be deleted and re-selected The area data in the online form regenerates the chart; if the current chart is not deleted, the chart will be regenerated according to the area data re-selected by the user, so there are technical problems that the chart generation is tedious and complicated, and the user experience is poor

Method used


Image

  • Chart-based data processing method and device, electronic equipment and medium
  • Chart-based data processing method and device, electronic equipment and medium
  • Chart-based data processing method and device, electronic equipment and medium

Examples


Embodiment 1

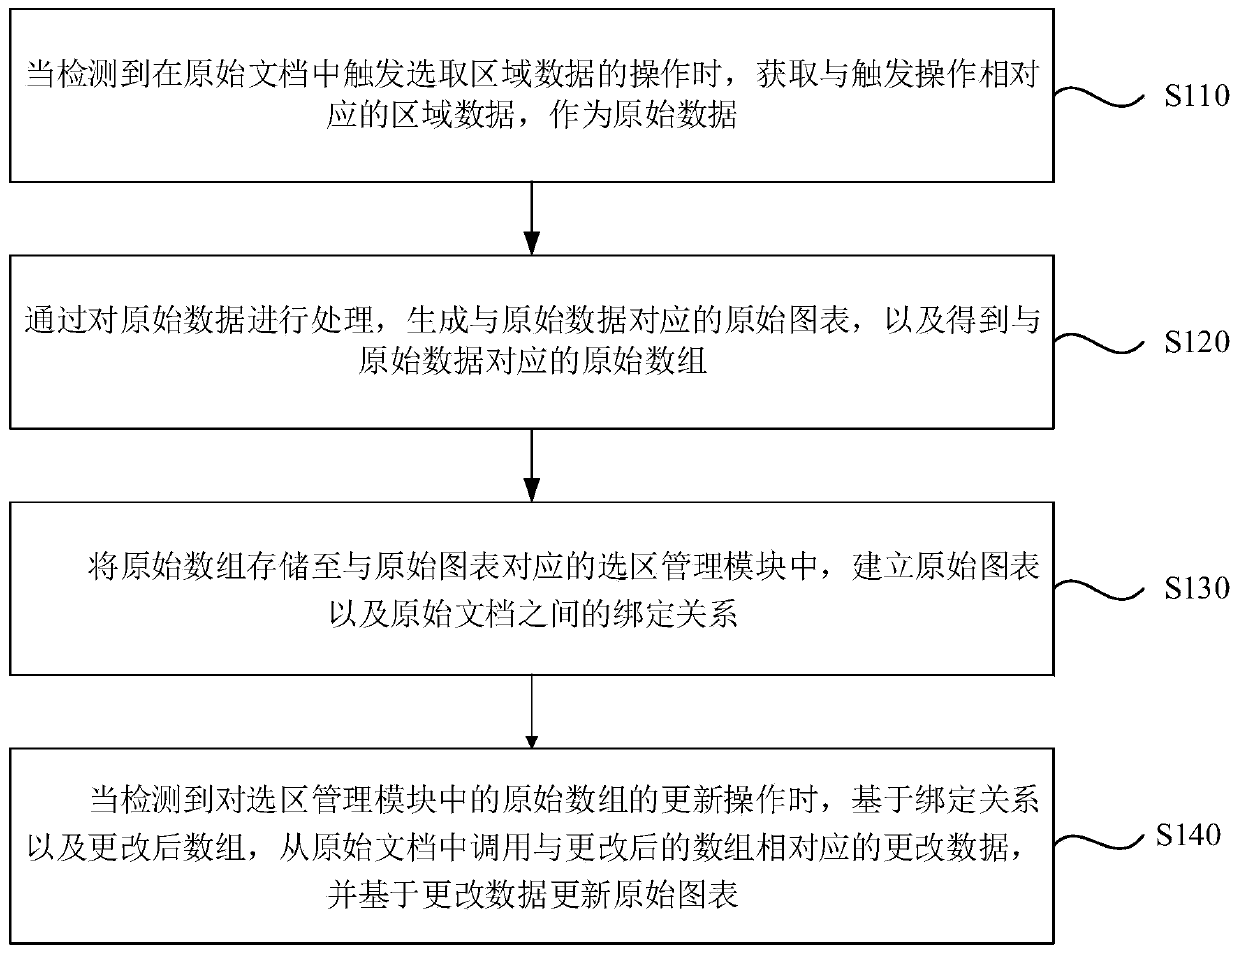
[0034] figure 1 It is a schematic flowchart of a chart-based data processing method provided by Embodiment 1 of the present disclosure. This embodiment of the present disclosure is applicable to the situation of managing data corresponding to each chart, and the method can be implemented by a chart-based data processing device To execute, the apparatus may be implemented in the form of software and / or hardware, optionally, implemented by electronic equipment, and the electronic equipment may be a mobile terminal, a PC terminal, and the like.

[0035] Such as figure 1 , the method of this embodiment includes:

[0036] S110. When an operation triggering the selection of area data in the original document is detected, acquire area data corresponding to the triggered operation as original data.

[0037] Among them, when the user triggers a certain area and generates a chart according to the selected data, the document to which the data belongs is regarded as the original documen...

Embodiment 2

[0070] As a preferred embodiment of the above embodiment, image 3 Another schematic flowchart of a chart-based data processing method provided in Embodiment 2 of the present disclosure, as shown in image 3 As shown, the method includes:

[0071] S301. Create a graph.

[0072] It can be understood that a chart corresponding to the data is generated according to the data selected by the user in the original document.

[0073] Specifically, when it is detected that the user triggers the operation of selecting area data in the original document and clicks on the control for generating a chart, a chart corresponding to the area data may be generated, and this chart may be used as the original chart.

[0074] Exemplarily, the original document can be understood as an excel table, and the chart can be a histogram. When the user triggers to select the regional data of multiple regions in the excel and triggers the chart generation control, a chart corresponding to the regional da...

Embodiment 3

[0107] Figure 4 A schematic structural diagram of a chart-based data processing device provided in Embodiment 3 of the present disclosure, as shown in Figure 4 As shown, the device includes: an original data acquisition module 410, an original array determination module 420, a binding relationship establishment module 430, and an original chart update module 440; wherein,

[0108] The original data acquisition module 410 is used to acquire the area data corresponding to the trigger operation as the original data when an operation triggering the selection of area data in the original document is detected; the original array determination module 420 is used to pass the original document Data processing, generating an original chart corresponding to the original data, and obtaining an original array corresponding to the original data; wherein, the original array represents the position information of the original data in the original document; binding The relationship establis...


PUM


Abstract

The embodiment of the invention discloses a chart-based data processing method and device, equipment and a medium, and the method comprises the steps: obtaining original data corresponding to a triggering operation when the operation of triggering the selection of region data in an original document is detected; processing original data to generate an original chart corresponding to the original data, and obtaining an original array; storing the original array into a selected area management module corresponding to the original chart, and establishing a binding relationship between the original chart and the original document; and when an update operation on the original array in the selected area management module is detected, calling change data corresponding to the changed array based on the binding relationship and the changed array, and updating the original chart. According to the technical scheme of the embodiment of the invention, the method achieves the management of the dataof the generated chart based on the selected area manager corresponding to the chart, improves the chart management efficiency, improves the chart generation convenience, and improves the user experience.

Description

technical field [0001] Embodiments of the present disclosure relate to the field of computer technology, and in particular, to a graph-based data processing method, device, electronic equipment, and media. Background technique [0002] Charts are an effective tool for visualizing data, and charts exist in many data management software, such as online spreadsheets. Users can trigger the data of each area in the online form to generate a visual chart corresponding to the selected area. Through the visual chart, users can clearly and intuitively observe the overall trend of the data or the differences between the data. [0003] However, the data required by the user is not limited to a single area, and the data in different areas may be scattered. In this case, managing multiple constituencies selected by the user becomes crucial. [0004] In the prior art, for a chart generated by multiple areas, the user cannot clearly know which area of ​​the original online table correspon...

Claims


Application Information

Patent Timeline
IPC IPC(8): G06F16/242G06F16/248
CPCG06F16/2428G06F16/248Y02D10/00
Inventor 梁瑞元
Owner BEIJING BYTEDANCE NETWORK TECH CO LTD