Saliency map fusion method and system
A fusion method and remarkable technology, applied in the field of computer vision, can solve the problems of multi-computation, inconvenient use, large workload, etc., to achieve the effect of high robustness, improved universality, and simple concept
- Summary
- Abstract
- Description
- Claims
- Application Information
AI Technical Summary
Problems solved by technology
Method used
Image

Examples
Embodiment 1
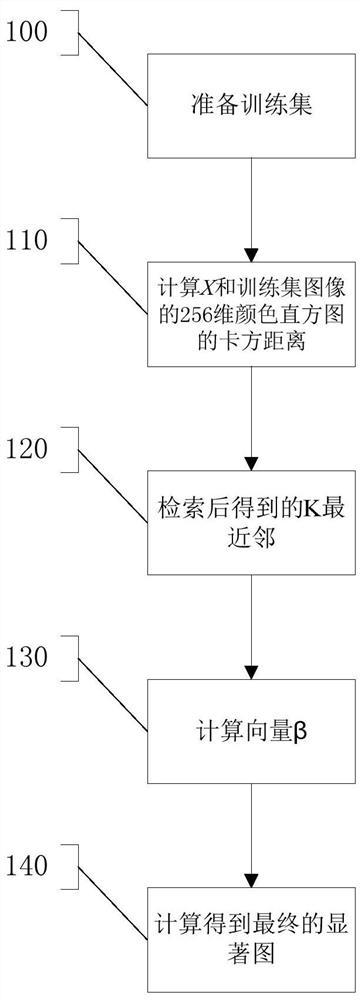
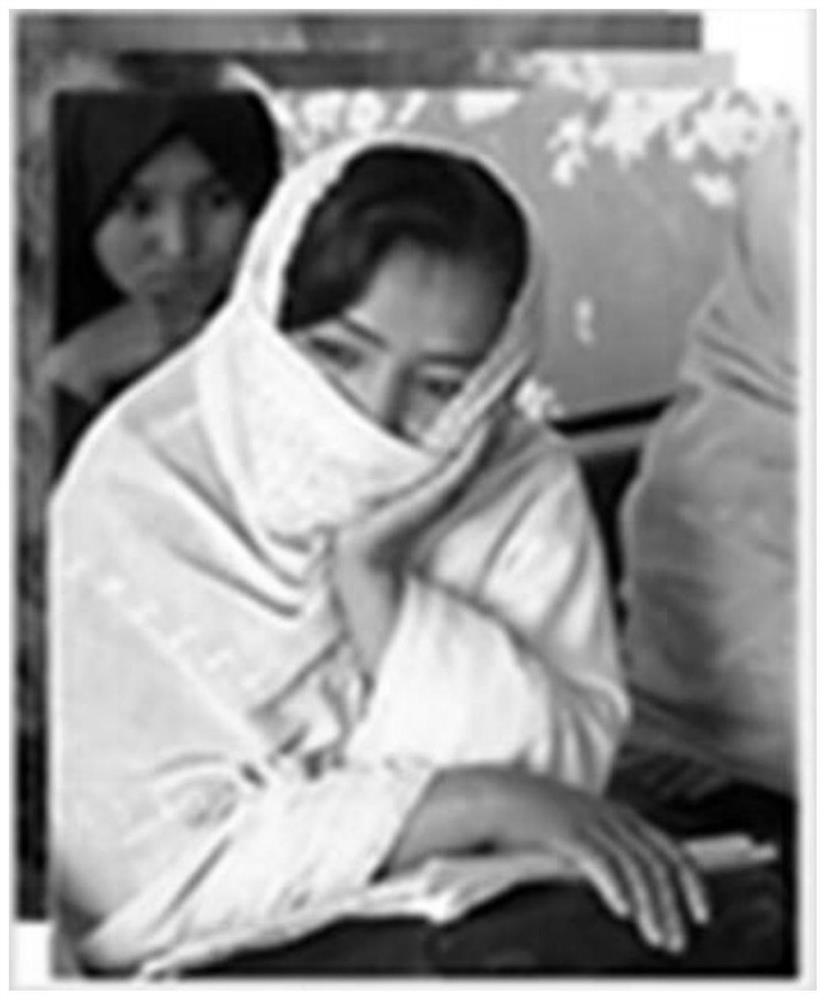
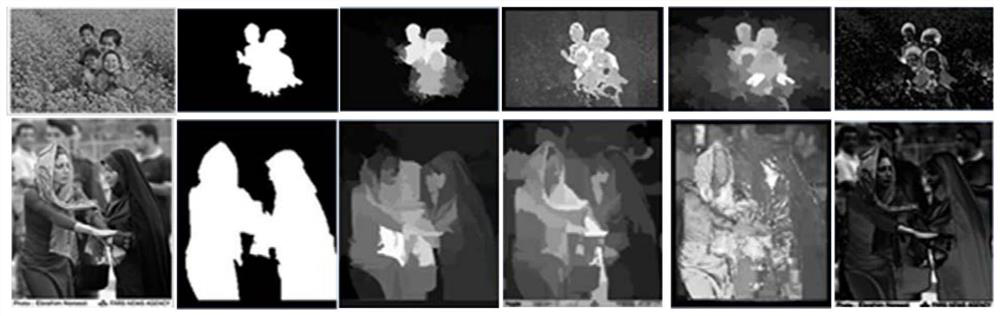
[0065] Execute step 100 to perform a training process and prepare a training set, which includes a training image set D, a corresponding benchmark binary label set G, M extraction methods, and saliency map extraction results A of the M extraction methods. Execute step 110, given a Figure 1A As shown in the test image X, calculate the chi-square distance between the test image X and the 256-dimensional color histogram of the training set image. Execute step 120, the K nearest neighbors obtained after retrieval Each neighbor image X k The corresponding standard binary value is marked as α k , Represents the detection results of M methods of neighboring images, 1≤k≤K, such as Figure 1B shown. Execute step 130, according to the above assumptions, the fusion problem is formalized as a ridge regression problem, and the objective function is as follows:
[0066]
[0067] The first item is the reconstruction error of the fusion result and the benchmark binary label, the s...
Embodiment 2
[0074] The application belongs to the technical field of computer vision and the field of image processing, and discloses a saliency map fusion method. The present invention observes that different extraction methods have different extraction performances, and even the same extraction method has different extraction effects on different images. The saliency map fusion method proposed by the invention takes into account the differences in the extraction effects of different extraction methods on different images, and the performance of fusion is greatly improved compared with the performance of a single method before fusion.
[0075] Due to individual image differences, each method cannot guarantee better extraction performance on each image than all other methods. To overcome this problem, this application proposes an image-dependent saliency map fusion model to make these methods complement each other and further improve the performance of the extraction results.
[0076] Si...
Embodiment 3
[0081] In the quantitative performance evaluation, the current popular performance evaluation indicators are used:
[0082] (1) Precision rate and recall rate curve (PR curve);
[0083] (2) Receiver operating characteristic curve (ROC Curve);
[0084] The method of the present invention is referred to as FBS for short, and the PR curve figure is as figure 2 As shown, by comparing with other 14 popular methods (HS, MR, DRFI, PCA, HM, GC, MC, DSR, SBF, BD, SMD, MCDL, LEGS, and RFCN), it can be seen that the PR curve of FBS is high for all other methods.
[0085] ROC curve such as Figure 2A As shown, by comparing with other 14 popular methods (HS, MR, DRFI, PCA, HM, GC, MC, DSR, SBF, BD, SMD, MCDL, LEGS and RFCN), we can see that the ROC curve of FBS is higher than all other methods.
PUM
 Abstract
Description
Claims
Application Information
 - R&D Engineer
- R&D Manager
- IP Professional
- Industry Leading Data Capabilities
- Powerful AI technology
- Patent DNA Extraction
Browse by: Latest US Patents, China's latest patents, Technical Efficacy Thesaurus, Application Domain, Technology Topic.
© 2024 PatSnap. All rights reserved.Legal|Privacy policy|Modern Slavery Act Transparency Statement|Sitemap