Open Source Software Reliability Modeling for Fault Detection and Introducing Nonlinear Changes
A non-linear change, open source software technology, applied in error detection/correction, software testing/debugging, instrumentation, etc., can solve problems such as fault detection non-linear changes, and achieve good fitting and predictive performance effects
- Summary
- Abstract
- Description
- Claims
- Application Information
AI Technical Summary
Problems solved by technology
Method used
Image
Examples
Embodiment 1
[0070] An open source software reliability modeling method for fault detection and introduction of nonlinear changes, including the following steps:
[0071] Step 1, come up with model assumptions:
[0072] (1) The fault detection of open source software is an inhomogeneous Poisson process;
[0073] (2) In the process of open source software development and testing, the number of detected faults is related to the number of remaining faults in the software, and the following formula can be obtained:
[0074]
[0075] Among them, μ(t) is the mean value function, indicating the expected cumulative number of detected faults until time t, ω(t) and a(t) respectively represent the fault detection rate function and fault content function;
[0076] (3) The fault detection process of open source software is nonlinear, and the nonlinear change is represented by a nonlinear function:
[0077] θ>0 and ω≥0 (2)
[0078] Among them, ω and θ represent the fault detection rate and propo...
Embodiment 2
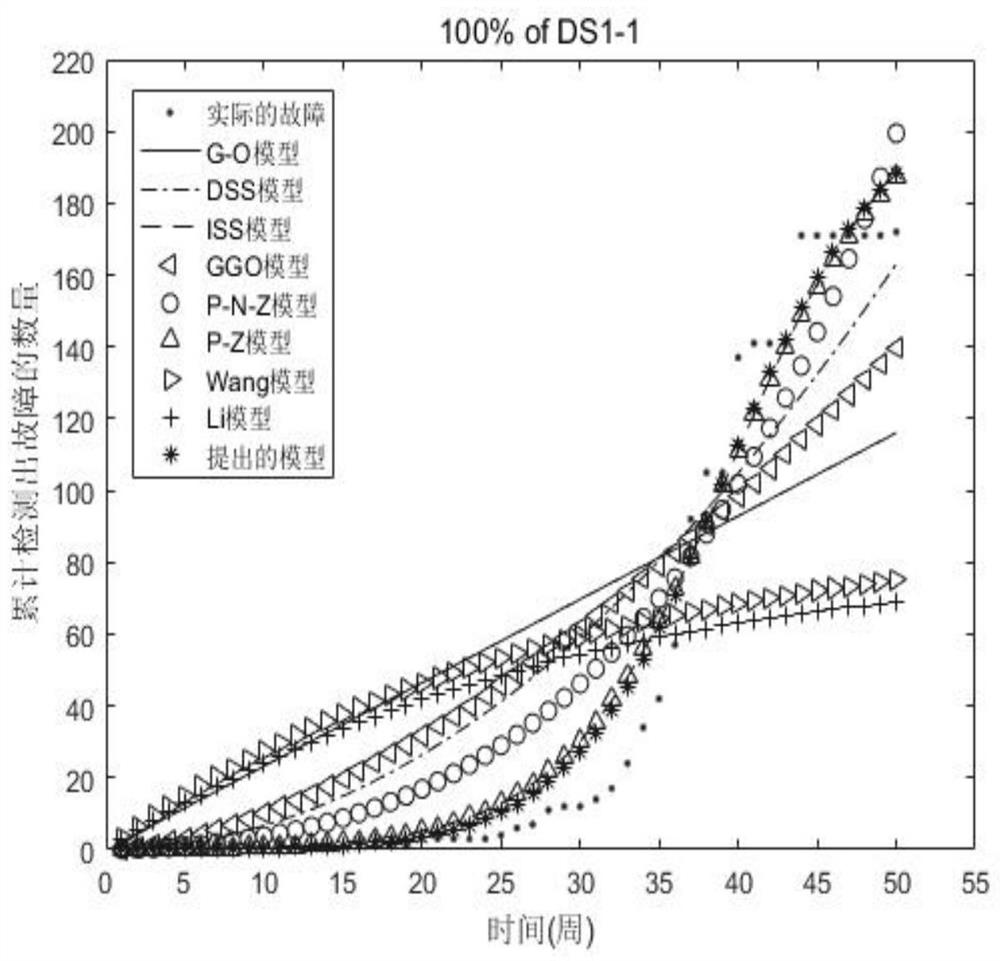
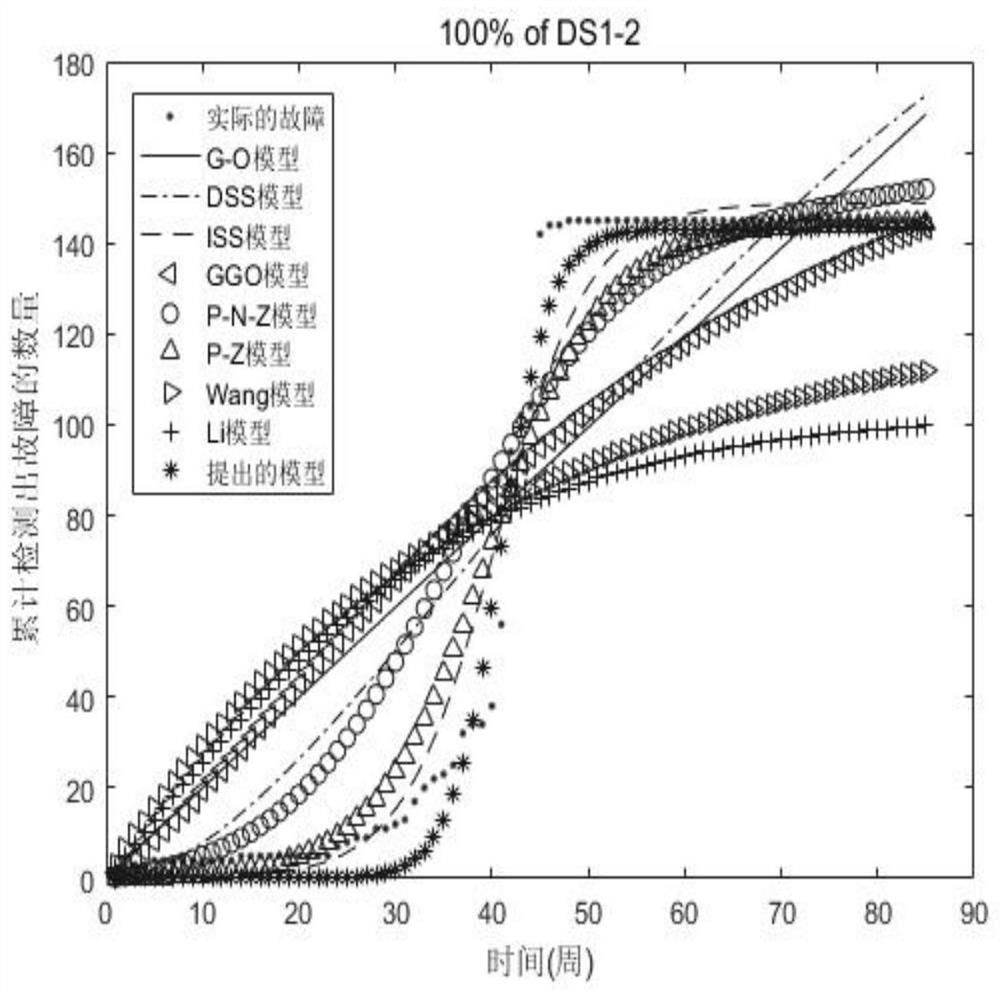
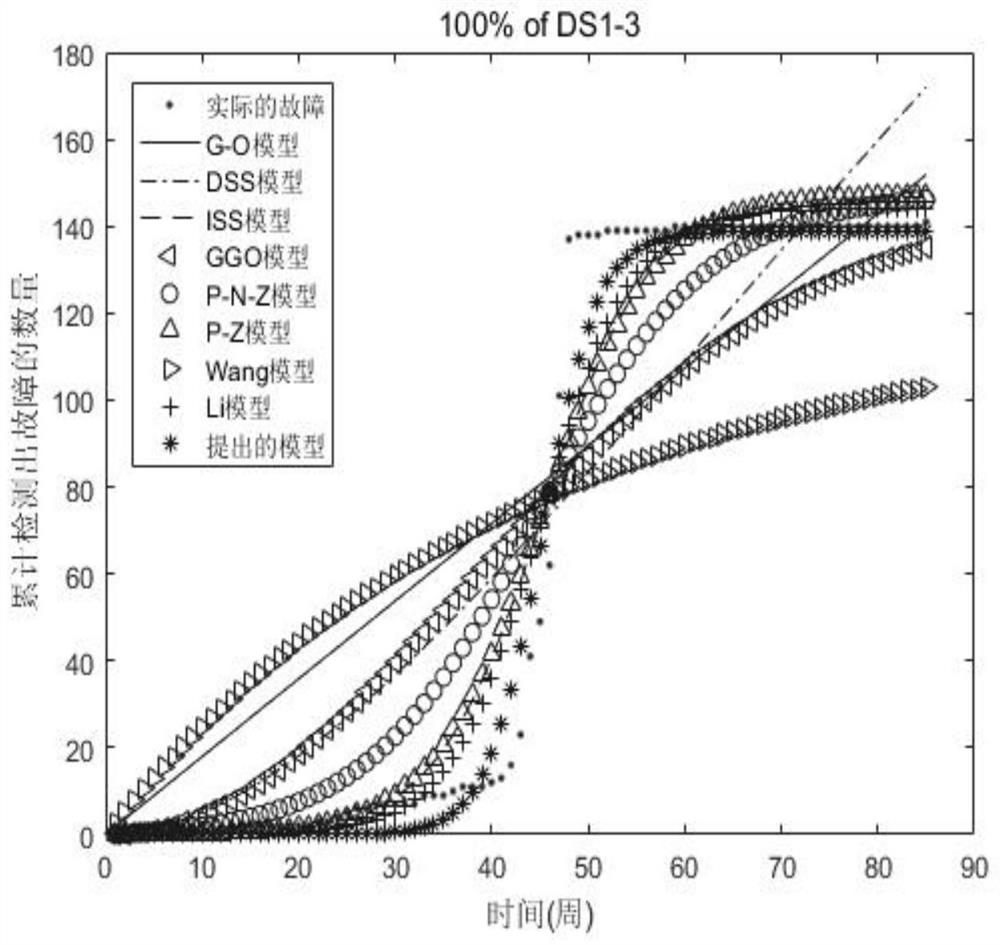
[0093] Model performance comparison
[0094] A dataset of failures that we collected from three Apache projects in the failure tracking system. Its website is https: / / issues.apache.org / . The fault data of open source software in the fault tracking system are called Issues. We removed failures with failure states of "unrepairable", "invalid", "duplicate" and "no problem", and the rest as failure datasets. Table 1 lists the detailed fault data collection information of the open source software.
[0095] To compare the performance of the models, we used five model comparison criteria. They are MSE, R 2 , RMSE, TS and Bias. See Table 2 for details. In Table 2, μ(t j ) and O(t j ) represent the mean function and the number of actually observed failures, respectively. n and m represent the sample size. In addition, in Table 2, the smaller the model comparison standard values of 1 to 4, the better the model performance. In addition, R 2 The larger the value, the better ...
PUM
 Abstract
Description
Claims
Application Information
 - R&D
- Intellectual Property
- Life Sciences
- Materials
- Tech Scout
- Unparalleled Data Quality
- Higher Quality Content
- 60% Fewer Hallucinations
Browse by: Latest US Patents, China's latest patents, Technical Efficacy Thesaurus, Application Domain, Technology Topic, Popular Technical Reports.
© 2025 PatSnap. All rights reserved.Legal|Privacy policy|Modern Slavery Act Transparency Statement|Sitemap|About US| Contact US: help@patsnap.com


