Visual chart operation method and device, electronic equipment and storage medium

A technology of electronic equipment and operation methods, applied in the field of data visualization, can solve problems such as poor effects, and achieve the effect of improving user experience

Pending Publication Date: 2020-11-10
WINGTECH COMM
View PDF0 Cites 3 Cited by
  • Summary
  • Abstract
  • Description
  • Claims
  • Application Information

AI Technical Summary

Problems solved by technology

However, when using this visualization platform to view data charts with hierarchical relationships, you cannot enter the lower-level chart display interface after clicking the upper-level picture, which makes the effect of viewing data charts between the upper and lower levels poor.

Method used


Image

  • Visual chart operation method and device, electronic equipment and storage medium
  • Visual chart operation method and device, electronic equipment and storage medium
  • Visual chart operation method and device, electronic equipment and storage medium

Examples


Embodiment Construction

[0055]In order to make the purpose, technical solutions and advantages of the embodiments of the present application clearer, the technical solutions in the embodiments of the present application will be clearly and completely described below in conjunction with the drawings in the embodiments of the present application. It should be understood that the appended The figures are only for the purpose of illustration and description, and are not used to limit the protection scope of the present application. Additionally, it should be understood that the schematic drawings are not drawn to scale. The flowcharts used in this application illustrate operations implemented in accordance with some embodiments of the application. It should be understood that the operations of the flowcharts may be performed out of order, and steps that have no logical context may be performed in reverse order or concurrently. In addition, those skilled in the art may add one or more other operations to...


PUM


Abstract

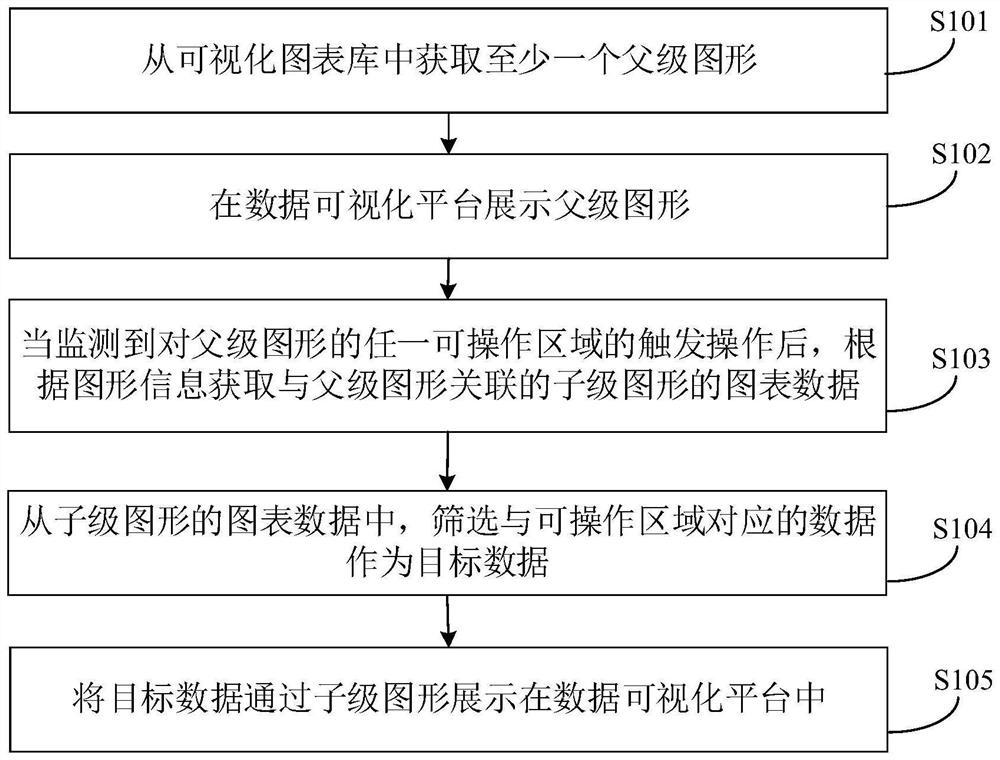
According to the visual chart operation method and device, the electronic equipment and the storage medium provided by the embodiment of the invention, firstly, at least one parent graph is obtained from a visual chart library, the parent graph is displayed on a data visualization platform, and when a trigger operation on any operable area of the parent graph is monitored, according to the graph information, graph data of a child-level graph associated with the parent-level graph is obtained, target data corresponding to an operable region is screened out from the graph data, and the target data is displayed in the child-level graph, so as to achieve a graph operation function of the data visualization platform, and when the graph data with the parent-child level relationship is checked, the display interface of the child-level graph can be accessed by operating the parent-level graph, so that the use experience of the data visualization platform is improved.

Description

technical field [0001] The present application relates to the technical field of data visualization, in particular, to a method, device, electronic device and storage medium for operating a visualized chart. Background technique [0002] Visualization is a technology that uses computer graphics and image processing technology to convert data into graphics or images and display them on the screen, and then perform interactive processing. The data visualization platform can analyze and process the collected data, and integrate them into graphics and reports to present to users. It is an important tool for people to recognize massive data and assist decision-making in the information age. [0003] Superset is currently a widely used data visualization platform, which can analyze data and create visual charts through rich visualization methods. However, when using this visualization platform to view data charts with hierarchical relationships, clicking the upper-level picture c...

Claims


Application Information

Patent Timeline
Patent Type & Authority Applications(China)
IPC IPC(8): G06F16/26G06F3/0484G06F3/0481
CPCG06F3/0481G06F3/04845G06F16/26
Inventor 王俊伟
Owner WINGTECH COMM
Why Eureka
Try Eureka