Supercharge Your Innovation With Domain-Expert AI Agents!

Economic management multi-data display device

A display device and economic management technology, which is applied in the field of economic management display auxiliary equipment, can solve the problems of large mutual interference, limited application places, time-consuming and labor-intensive problems, and achieve the effect of accurate representation of data, small occupation of space, and accurate display

Inactive Publication Date: 2021-02-02
HENAN POLYTECHNIC
View PDF0 Cites 0 Cited by
  • Summary
  • Abstract
  • Description
  • Claims
  • Application Information

AI Technical Summary

Problems solved by technology

Regular and frequent drawing of economic data display maps is time-consuming and laborious, which reduces the economic benefits of the enterprise and increases the operating costs and burdens of the enterprise; although software drawing has been used to a certain extent, its application places have obvious restrictions, and the technical requirements are relatively high. High, the production of technical personnel is time-consuming and laborious, and most enterprise participants cannot complete software drawing
[0004] In the prior art, there are many devices for statistical display of economic management data, and most of them use the combination of histogram and line graph to display, which is intuitive and easy to operate; but in practice, the display is the change of multiple sets of data , the existing devices generally carry out the change of a single set of data and its line graph display, which cannot better meet the actual needs; the change of the line trend graph of multiple sets of data is complex, and sometimes requires frequent crossover, which interferes greatly with each other, making multiple sets of economic Difficult to display data

Method used


Image

  • Economic management multi-data display device
  • Economic management multi-data display device
  • Economic management multi-data display device

Examples


Embodiment Construction

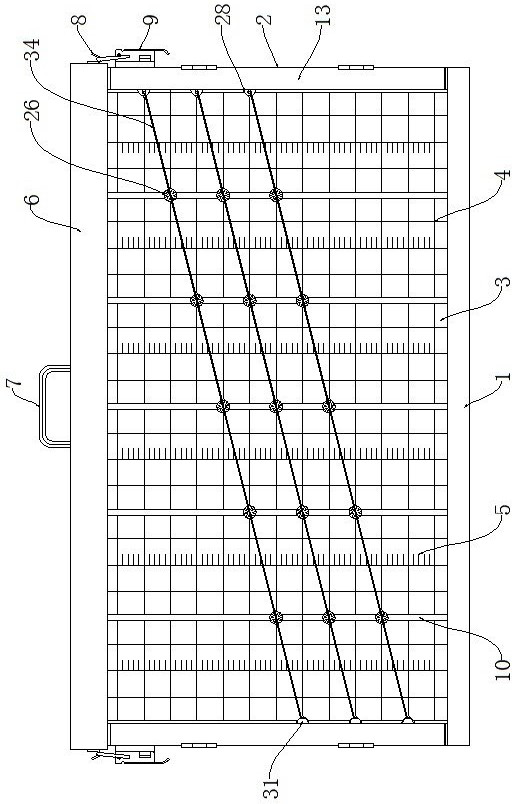
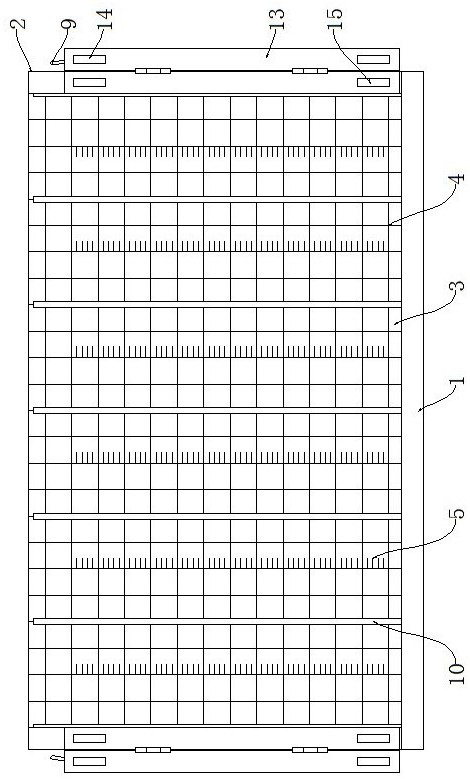
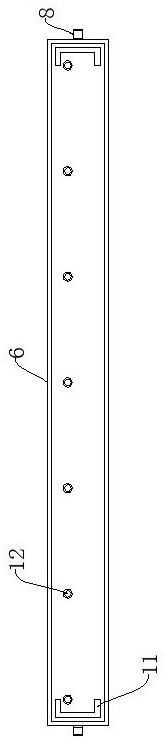
[0026] The following will clearly and completely describe the technical solutions in the embodiments of the present invention with reference to the accompanying drawings in the embodiments of the present invention. Obviously, the described embodiments are only some, not all, embodiments of the present invention. Based on the embodiments of the present invention, all other embodiments obtained by persons of ordinary skill in the art without making creative efforts belong to the protection scope of the present invention.

[0027] In describing the present invention, it should be understood that the terms "middle", "length", "width", "thickness", "upper", "lower", "front", "rear", "left", " The orientation or positional relationship indicated by "right", "vertical", "horizontal", "top", "bottom", "inner", "outer", etc. is based on the orientation or positional relationship shown in the drawings, and is only for the convenience of description The present invention and simplified d...


PUM


Abstract

The invention discloses an economic management multi-data display device, which comprises a bottom groove and an elastic rope, and a plurality of vertical rods are arranged on the upper side of the bottom groove; a plurality of movable assemblies are arranged on the outer sides of the vertical rods. Each movable assembly comprises a sliding block, a T-shaped column groove and a sliding column. Except the two vertical rods at the left end and the right end of the bottom groove, rope penetrating discs are arranged on the outer sides of the movable assemblies on the outer sides of the other vertical rods; the movable assembly on the outer side of the vertical rod at the right end of the bottom groove is connected with a hanging disc; the movable assembly on the outer side of the vertical rodat the left end of the bottom groove is connected with a first rope pressing disc, and a second rope pressing disc is arranged on the front side of the first rope pressing disc; the elastic rope is connected with a hanging ring, the hanging ring of the elastic rope is hung on the hanging disc and sequentially penetrates through one rope penetrating disc on the outer side of each vertical rod, andthe other end of the elastic rope penetrates through the position between the first rope pressing disc and the second rope pressing disc. The device is used for multi-group economic data change statistical display, the multi-broken-line statistical graph is simulated through the multiple elastic ropes, the broken-line intersection requirement is met, display is accurate, vivid and visual, operation is easy, and high expansibility is achieved.

Description

technical field [0001] The invention belongs to the technical field of economic management display auxiliary equipment, and in particular relates to an economic management multi-data display device. Background technique [0002] In the process of economic management, some data statistics and comparisons need to be carried out. For the sake of convenience, the column chart is not drawn to explain, and only the oral form is used to tell the students, which makes it difficult for students to understand. However, manual drawing of data statistical charts is used to display and explain the statistics and comparison of data in detail. The traditional drawing method is that the teacher repeatedly draws manually on the blackboard. After the explanation is over, it will be erased and cannot be retained. Redrawing is required, adding burden and delaying time. [0003] Similarly, in market economic activities, managers need regular summary meetings to show historical economic data to ...

Claims


Application Information

Patent Timeline
Patent Type & Authority Applications(China)
IPC IPC(8): G09B19/18
CPCG09B19/18
Inventor 刘雨佳田嘉夏连峰
Owner HENAN POLYTECHNIC
Features
  • R&D
  • Intellectual Property
  • Life Sciences
  • Materials
  • Tech Scout
  • Unparalleled Data Quality
  • Higher Quality Content
  • 60% Fewer Hallucinations
Learn More