Remote sudden cardiac death early warning method based on non-contact
A non-contact, cardiac technology, applied in the measurement of pulse rate/heart rate, medical science, diagnostic signal processing, etc., can solve problems such as difficult determination of model order, not very smooth spectral lines, complex modeling process, etc.
Pending Publication Date: 2021-03-16
南京云思创智信息科技有限公司
0 Cites 1 Cited by
AI-Extracted Technical Summary
Problems solved by technology
The main disadvantage is: the spectral line is not very smooth
Its main disadvantages are: the modeling process is...
Method used
[0112] The classifier utilizes the two thresholds of the minimum intra-cluster distance min and the maximum intra-cluster distance max to classify each cluster in the final clustering result respectively: normal cluster and abnormal cluster. The judgment criterion is: when the distance within a cluster is less than min or greater than max, the cluster is an abnormal cluster, otherwise it is a normal cluster. The threshold setting in the present invention is determined by testing 100,000 pieces of experimental data, m...
Abstract
The invention discloses a remote sudden cardiac death early warning method based on non-contact. The method comprises the following steps: S1, acquiring an image of a tester; S2, extracting RGB channel data based on the image information collected in the S1; S3, based on the RGB channel data obtained in the S2, performing independent component analysis and one-dimensional filtering processing in sequence, and then performing fast discrete Fourier transform to obtain heart rate information; S4, on the basis of the heart rate information obtained in the S3, performing conversion to obtain 5-minute HRV information, and performing calculation to obtain 5-minute SDNN information; S5, constructing a clustering analysis system of SDNN data based on the 5-minute SDNN information obtained in the S4; and S6, based on the minimum value and the maximum value of a classifier in an SDNN clustering analysis system in the S5, obtaining HRV sudden cardiac death probability and an early warning mark.
Application Domain
Diagnostic signal processingSensors +1
Technology Topic
Channel dataBiology +7
Image
Examples
- Experimental program(1)
Example Embodiment
[0062] The invention will be described in detail below with reference to the accompanying drawings.
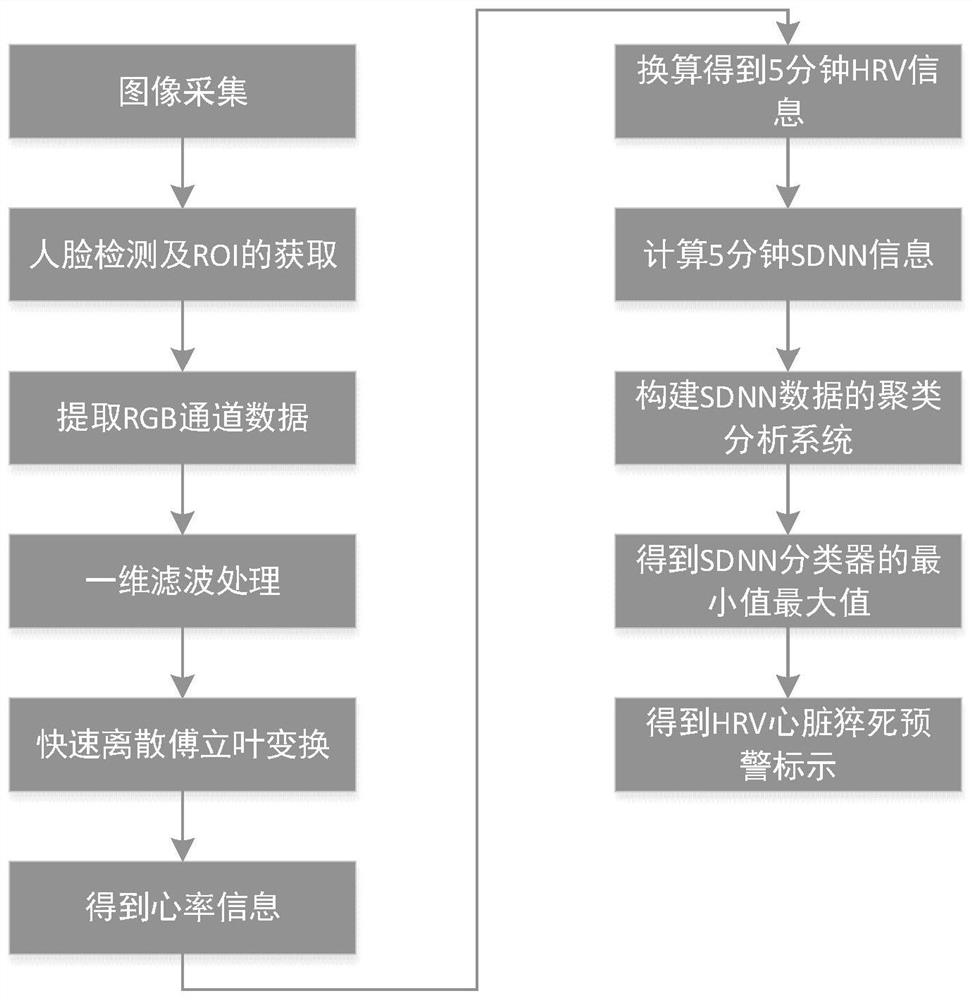
[0063] The present invention provides a method based on non-contact remote cardiac early warning method, including the following flow:
[0064] 1) Image acquisition
[0065] The photograph of the video used is performed in the room, which is illuminated by the sun that is irradiated through the window. Participants are sitting in a laptop with a built-in camera 40 to 50 cm, quiet and breathing naturally, facing the camera to shoot video. At the same time, while shooting video, the physical measurement instrument is used to measure the pulse of the participant, and the accuracy is used to accurately compare the results with the final test results. The photographed video is collected in a 24-bit RGB true color, 15 frames / sec frame speed, 1920 × 1080 pixel resolution.
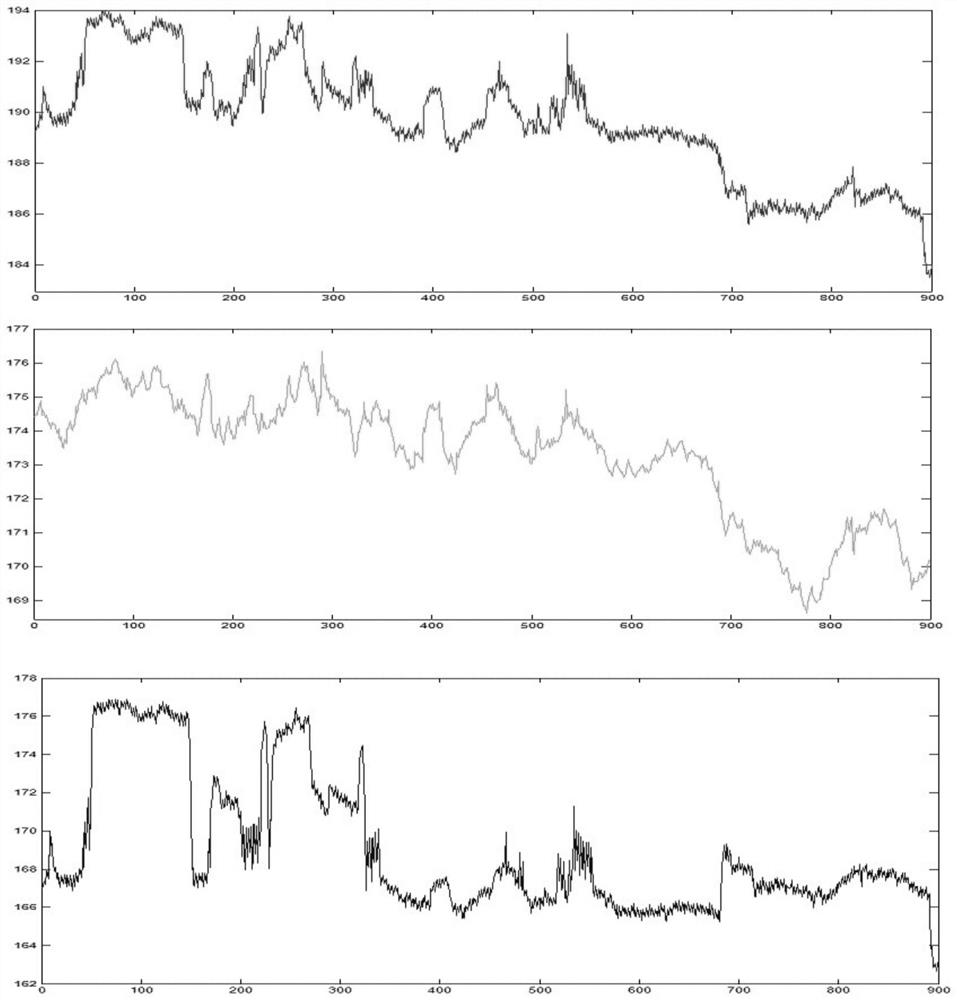
[0066] 2) Face detection and ROI acquisition
[0067] The face area is detected by depth neural network as ROI (region of interest). If no face is detected, the previous ROI parameter is used; if the number of faces detected is more than one, select the result of the most close to the previous ROI parameter as a result of face recognition. The image within each of the frames of the color video is read, and then the color signal is subjected to three-base color separation to obtain the color components of the three channels of R, G, B, and store it into a three-dimensional digital matrix, matrix The dimension is 640 × 480 × 3, where the third dimension represents R, G, B three color channels, and each position in the remaining two-dimensional matrix is R, g of each corresponding position in the region of interest. , The pixel value of the B channel, which are all values between 0 and 256. The sequence trend of the RGB three sets of color channels.
[0068] 3) Extract RGB channel data
[0069] In order to obtain the original PPG signal, the respective two-dimensional matrix of three color channels per frame R, G, and B is average, that is, the arithmetic average of all pixel values in a matrix, as the frame video image The PPG signal sample value, where we can extract the three groups that include a discrete time signal sequence on a time domain, respectively, which is the original PPG signal used in this article, respectively, respectively, respectively, respectively, respectively, respectively, respectively, respectively, respectively, respectively. X20 (t) and x30 (t), where T indicates frame, if a video length is 60 seconds, there is a 15 frame image per second, and each channel obtains a set of length 900 discrete time signal data.
[0070] 4) Analysis of independent components
[0071] The initial signal sequence is decomposed into 3 independent source signals using the FAST ICA algorithm. The order of the potential independent source signal after ICA is often random, and we need to screen which signal is a PPG signal we need to have the strongest heart rate information. In general, the green channel contains the strongest PPG signal, which can most reflect the information of the heart beat, because the absorption capacity of blood oxygen to green light is stronger than the red light, and the green light penetrates the skin surface direct body blood vessel The ability is stronger than blue. Thus, three separate ICA potential independent source signals are simply correlated with the original signal of the green channel to find a potential independent source signal that is the highest in which the original signal of the green channel is high. Simple correlation herein is achieved by the most common use of application statistics and the most common PEARSON correlation coefficient and pearson cross-correlation function. Simple linear correlation coefficient, that is, the pearson sample correlation coefficient, to measure the closeness of the linear relationship between the two sets of quantitative data, and the sample transition function, the metric is the two sets of discrete time sequence misal, different period regenerated one A simple linear correlation coefficient between the series two groups of data.
[0072] 5) One-dimensional digital filtering
[0073] The one-dimensional digital filter is used for the IIR filter of the Direct Form IITRANSPOSED, which is commonly used. Since the human heart rate value ranges from 45 to 240, the corresponding passband frequency range is [0.75, 4], and the signal of the non-this band is all thus the pass filter to perform attenuating elimination to the heart rate signal band Interference. The PPG signal contained in the second signal in the three ICA independent source signals extracted by an independent component analysis is the strongest, and the potential independent source signal obtained by the ICA will be filtered after filtering.
[0074] 6) Fast discrete Fourier transform results at heart rate information
[0075] When the signal sampling meets the fragrant agriculture, the signal in the time domain will be reflected in the frequency domain, and the coordinate center point is repeated, and the PPG signal is performed on the waveform map of the PPG signal after Fourier transformation. We only take half of its symmetric waveform to analyze the spectrum map available.
[0076] The heart rate signal is a periodic fluctuation signal, after the filtering process of the filter heart rate band signal is performed, the time domain signal retained is mainly a heart rate signal, and the signal is the strongest in the frequency spectrum after frequency domain transformation. The largest value of the magnificent, the chaotic signal will appear in the spectrum map and the wide peak, find the horizontal frequency value of 1.267 Hz corresponding to the peak in the figure, that is, the number of times of jump is peripheed in each second, but we The unit of the engineering core rate signal uses the frequency value of 1.267 corresponding to the highest sharp peak of the spectrogram obtained by the FFT, and is multiplied by 60 seconds, which is 76.02 ≈ 76 (times). /minute).
[0077] 7) Convert 5 minutes HRV information, calculate 5 minutes SDNN information
[0078] Long Time Analysis Indicators is based on 24-hour dynamic electrocardiographic analysis of sinus heart beat analysis. The specific indicators are: i) Di-the-oriented difference, the reaction average heart rate index, which is the difference between the night average RR interval and the daytime RR spacer, II) SDRR, CLV, SDRR, is the SDNN calculated by normal continuous data, normal RR The standard deviation, it reflects the sum of HRVs within 24 hours, III) SDNN index (SDNN index), is a standard deviation, IV) SDANN index during 24 hours of full record, is 24 hours a 5 min The standard deviation of the average of the heartbeat. The calculation formula of SDNN and SDNN Index is the same, all of which are the standard deviation of the heartbeat interval, and the reaction is the dispersion of the heartbeat interval. 24 hours is a relatively complete activity cycle, and the range of heart rate changes is relatively large. The corresponding heartbeat interval is relatively high. The 5-minute is a relatively short period of time. In this short period of time, the heart rate is much smaller than 24 hours, and the SDNN index value will of course be much lower than SDNN. Therefore, the present invention takes the standard deviation SDNN index during heartbeat for every 5 minutes of the warning indicator of the sudden death of the heart.
[0079] The following is calculated for SDNN INDEX every 5 minutes.
[0080] R: is 1) ~ 6) The calculated heartbeat / minute, R is a value of non-0 (the number of heart rate values provided by the algorithm)
[0081] RR: For each time interval, unit is MS
[0082] The SDNN INDEX calculation steps are as follows:
[0083] a) Calculate rr: rr = 60000 / r
[0084] b) calculate the RR average of 300 seconds.
[0085] c) Calculate 300 seconds of HRV standard difference
[0086] 8) Construct the cluster analysis system for SDNN data
[0087]The SDNN data clustering analysis model used in the present invention is composed of a M-coiller, an evaluation device, and a classifier (Classifier). The working principle is to copy the collected original SDNN data, pass it to each of the cluster; after the cluster receives the data, the data is clustered with the K-Means algorithm (each coefficient The K value is not the same), the cluster calculates the distance, cluster distance, DB index according to the respective cluster results, and transmits the DB index to the evaluation device; when the evaluation is received from each category After the DB index, select the corresponding cluster according to the "DB index minimum" principle, thereby obtaining the most clustered result; the classifier is based on the minimum set, the maximum cluster distance threshold is k in the optimal clustering result. Clusters are classified one by one. among them,
[0088] a) Cluster (Cluster)
[0089] The present invention employs a M coarator (m = 10), each of which is clustered by the K-Means algorithm, and calculates the DB value of the cluster results. Both data sources have been standardized, and the only difference is K, the purpose is to reduce the K-Means algorithm to K is worth depending on.
[0090] The algorithm is as follows:
[0091] Enter: Number of clusters K and N objects
[0092] Output: k clusters
[0093] step:
[0094] a) randomly select K object as the initial cluster center
[0095] b) Assign each object (rein) to the nearest cluster from the average of the objects in the cluster.
[0096] c) Update the average of the cluster, that is, calculate the average of objects in each cluster.
[0097] d) Repeat steps 2, 3 until each cluster center is no longer changing
[0098] When calculating the data and cluster center distance, the European Mid formula is taken, as shown in the formula (1):
[0099]
[0100] (N represents the number of each attribute, in the invention n = 3);
[0101] The properties of each record in the present invention include SDNN INDEX, gender, age.
[0102] The cluster distance between the present invention is: δ (c i , C j ) = D (sc i -SC j The SCI represents the center point of the cluster, and the formula (2) refers to the center of the center of the cluster and the central distance of the j cluster:
[0103]
[0104] Among them, XP represents P3 data in the cluster, | CI | represents the total number of data in the cluster, which is twice the average distance between all samples in a cluster.
[0105] The DB index mentioned in the present invention is a method of measuring the mass of the clustering. When the distance between the cluster is increased, when the distance between the cluster is increased, the DB index is smaller, and finally indicates that the clustering effect is greater, that is, the DB index is small, the better the effect of the cluster. The model uses the DB index to allow the evaluation device to select the best cluster results in multiple cuquers. The DB index is calculated as shown in the formula (3):
[0106]
[0107] Where k represents the K value used in the K-Means algorithm, that is, the number of clusters contained in the clustering result.
[0108] b) evaluation device (Assessor)
[0109] M category submits the respective calculated DB index to the evaluator, select the corresponding cluster according to the "DB index minimum" principle, and put the cluster results in the curator as the final cluster result of the model , Send this result to the classifier.
[0110] c) classifier (Classifier)
[0111] During the interrogation conversation, due to the high similarity of the normal human SDNN Index data cluster, the unusual heart suddenly died of his SDNN Index data cluster, thereby causing a small distance within the cluster, so In the present invention, the model minimum cluster is defined in the present invention to identify the SDNN INDEX exception. When the SDNN INDEX normal data is high, the normal data and abnormal data are similar, those SDNNINDEX abnormal data will not fall into the normal cluster, which becomes isolated, these isolated points are gathered When a cluster is used excessively, the present invention defines the maximum inner distance of Max.
[0112] The classifier uses two thresholds in the minimum cluster within Min and the maximum cluster to classify each cluster in the final clustering result, respectively: normal clusters, abnormal clusters. The judgment detection is that the cluster is abnormal cluster when the distance is less than min or greater than max, otherwise it is normal cluster. The threshold setting in the present invention is determined by 100,000 experimental data tests, Min = 11.34, MAX = 22.69, exhibits good performance and accuracy.
[0113] 9) According to the minimum value of the SDNN classifier, the HRV heart sudden death probability and the warning mark
[0114] With a 5-minute SDNN, 30 minutes to sudden death probability observation window, window statistics consist of 6 SDNN values, when MIN
[0115] Sudden death probability X is the number of sudden deaths.
[0116] The present invention selects 10,000 SDNN INDEX data from field acquisition 2015-2017, divided into 10 groups, 10,000 units per group. 3 coalescents are set, (CI, Ki), (C1, 3), (C2, 5), (C3, 7), CI, refer to the i-thicker, K is the i-th context The K value used by the class. Through a large amount of data verification, min = 11.34, MAX = 22.69 is, showing good performance and accuracy.
[0117] It is an object of the present invention to analyze the changes of HRV fluctuation information to analyze HRV fluctuations by extracting changes in blood periodic pulsation from a non-touchless video signal. The blood capacity in the human body will constantly change with the cyclic pulsation of the heart. When the skin surface of the human body receives a certain wavelength, a certain intensity visible beam is because the skin and the oxygen are different light wavelengths and The absorption and reflection ability of the intensity light is different, resulting in the determination of the change in the reflection of the reflection received by the photoelectric detection device, so that we can use the average brightness of the light to reveal the blood. The change of capacity, this is the information of the initial BVP, and the blood oxygen capacity of the blood oxygen capacity is actually a cardiac jumping law. The light of the cardiac law is revealed back to obtain a heart rate, and then pass the heart rate The information calculates the HRV change information, calculates the fluctuation data of SDNN, and then the cluster-based non-supervised learning, which is classified by sudden death abnormality, thereby issuing a sudden sudden death warning.
[0118] The above embodiments are exemplified only to illustrate the principles and their efficacy of the present invention, rather than limiting the invention. Anyone familiar with this technique can modify or change the above embodiment without violating the spirit and scope of the invention. Thus, all of the artists in the art will have all the equivalent modifications or changes that are not departed under the spirit and technical idea of the present invention, still covered by the appended claims.
PUM


Description & Claims & Application Information
We can also present the details of the Description, Claims and Application information to help users get a comprehensive understanding of the technical details of the patent, such as background art, summary of invention, brief description of drawings, description of embodiments, and other original content. On the other hand, users can also determine the specific scope of protection of the technology through the list of claims; as well as understand the changes in the life cycle of the technology with the presentation of the patent timeline. Login to view more.