Ecosystem attribute component composition structure time evolution quantitative analysis method
An ecosystem and quantitative analysis technology, applied in data processing applications, instruments, forecasting, etc., can solve the problem of comparative analysis of time evolution laws of different ecosystem attribute components, lack of quantitative description, and difficult ecosystem attribute component structures Quantitative analysis of time evolution law and other issues
- Summary
- Abstract
- Description
- Claims
- Application Information
AI Technical Summary
Problems solved by technology
Method used
Image

Examples
specific Embodiment approach 1
[0013] Embodiment 1: The quantitative analysis method for the time evolution of the composition and structure of the ecosystem attribute components in this embodiment is carried out according to the following steps:
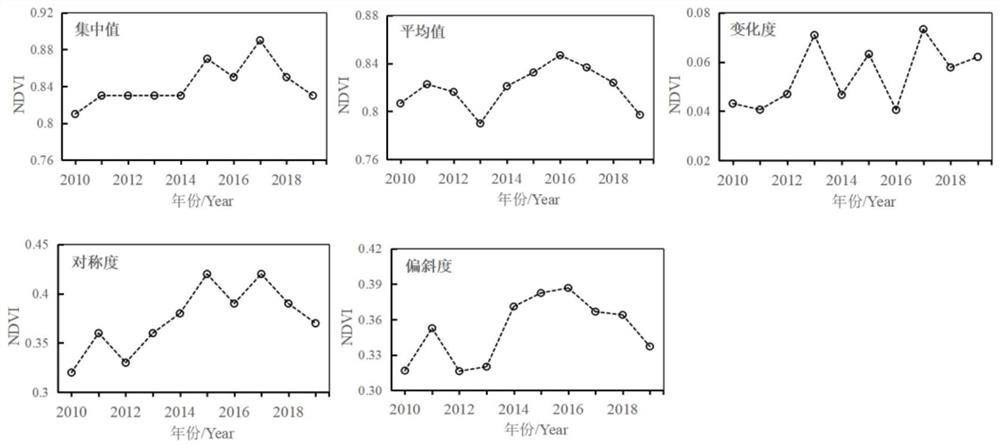
[0014] 1. Calculation of quantitative indicators of frequency parameters of attribute components: Obtain the multi-period frequency distribution data of the attribute components of the ecosystem, and calculate the quantitative indicators of frequency parameters respectively;
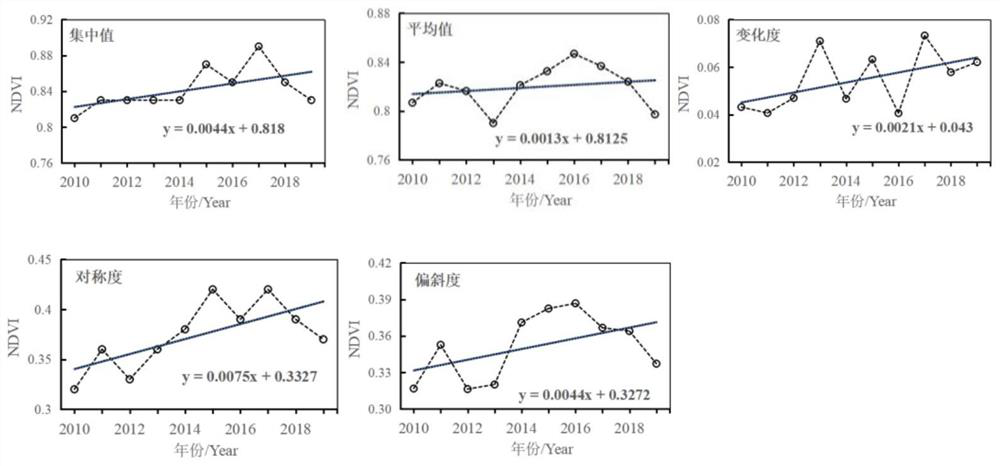
[0015] 2. Taking the quantitative index of each frequency parameter as the dependent variable and time as the independent variable, obtain the univariate linear regression time trend model of each frequency parameter, and form the parameter set of the trend model, and then learn the temporal evolution of the composition and structure of the ecosystem attribute components. .
specific Embodiment approach 2
[0016] Embodiment 2: The difference between this embodiment and Embodiment 1 is that the ecosystem attribute component in step 1 is a vegetation index or an ecological parameter. Other steps and parameters are the same as in the first embodiment.
specific Embodiment approach 3
[0017] Embodiment 3: The difference between this embodiment and Embodiment 1 or 2 is that the frequency parameter in step 1 includes the concentration value, average value, degree of change, degree of symmetry and degree of deviation of the frequency distribution of each period. Other steps and parameters are the same as in the first or second embodiment.
PUM
 Abstract
Description
Claims
Application Information
 - R&D
- Intellectual Property
- Life Sciences
- Materials
- Tech Scout
- Unparalleled Data Quality
- Higher Quality Content
- 60% Fewer Hallucinations
Browse by: Latest US Patents, China's latest patents, Technical Efficacy Thesaurus, Application Domain, Technology Topic, Popular Technical Reports.
© 2025 PatSnap. All rights reserved.Legal|Privacy policy|Modern Slavery Act Transparency Statement|Sitemap|About US| Contact US: help@patsnap.com