
Online traffic flow spider diagram generation method based on PostGIS

A technology of traffic flow and cobweb graph, applied in the field of traffic information, can solve the problems of unable to monitor the characteristics of urban traffic situation changes online for a long time, unable to share, complex operation, etc., and achieve fast execution mode and calculation efficiency, simple steps, and simple operation Effect

Active Publication Date: 2021-04-02
SHENZHEN URBAN TRANSPORT PLANNING CENT
View PDF6 Cites 1 Cited by
  • Summary
  • Abstract
  • Description
  • Claims
  • Application Information

AI Technical Summary

Problems solved by technology

[0006] The purpose of the research and development of the present invention is to solve the problems of cumbersome steps, complex operation, high cost, inability to share, inability to share, and inability to monitor the characteristics of urban traffic situation changes online for a long time in the prior art. A brief overview of the present invention is given below , in order to provide a basic understanding of certain aspects of the invention

Method used


Image

  • Online traffic flow spider diagram generation method based on PostGIS
  • Online traffic flow spider diagram generation method based on PostGIS
  • Online traffic flow spider diagram generation method based on PostGIS

Examples


specific Embodiment approach 1

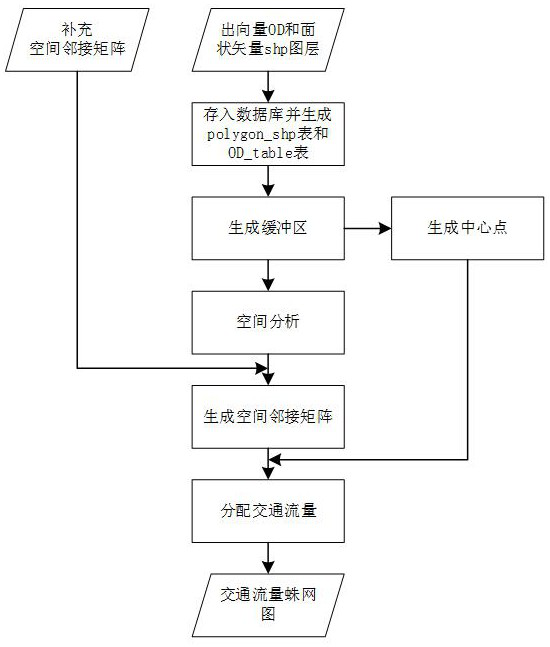
[0035] Specific implementation mode one: refer to Figure 1 to Figure 2 , illustrate the present embodiment, a kind of online traffic flow cobweb diagram generation method based on PostGIS of the present embodiment, concrete steps are:

[0036] Step 1. According to the distribution requirements of the traffic trips, the trips OD and the area vector shp layer are stored in the database;

[0037] According to the distribution requirements of traffic trips, the area vector shp layer data is stored in the PostGIS database to generate spatial data, which has a geom (geometric field type) field, and the polygon_shp table is generated in the database.

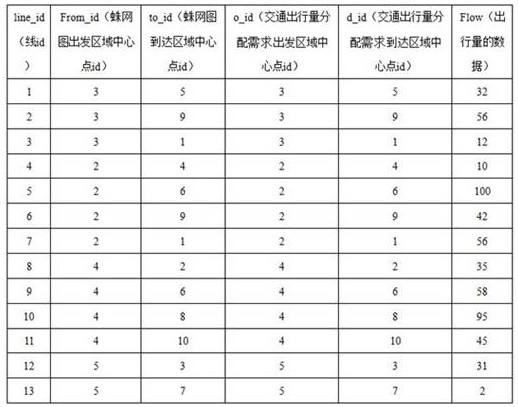
[0038] According to the distribution requirements of traffic trips, the travel volume OD is stored in the PostgreSQL database, and the OD_table table is generated in the database. Table 1 is the OD_table sample data table.

[0039] surface od_table sample data

[0040]

[0041] Step 2, generating buffers for each planar vecto...


PUM


Abstract

The invention discloses an online traffic flow spider diagram generation method based on PostGIS, and belongs to the technical field of traffic information. The method comprises a spatial algorithm ofa spatial data library, buffer analysis, spatial analysis and path allocation, and realizes standard data input and traffic flow spider diagram distribution result visualization at the front end. Themethod standardizes input and output data, supports a user to replace the input data on line, rapidly outputs an expression mode of the traffic corridor distribution cobweb graph, solves the problemthat a traditional cobweb graph drawing process is complex, and has the advantages of being easy and rapid to operate, saving manual operation cost and the like.

Description

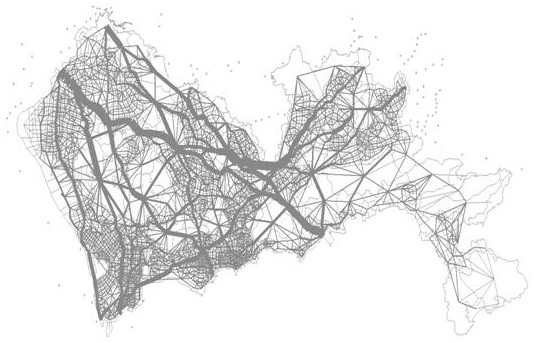
technical field [0001] The invention relates to the technical field of traffic information, and relates to a PostGIS-based online traffic flow cobweb graph generation method. Background technique [0002] The traffic flow spider diagram is the result of eliminating the cross-area expected line, leaving only the expected line of the adjacent area. The value of the expected line between the adjacent areas is not only the traffic demand value of the adjacent area, but the value of all traffic passing through the adjacent area. The value of the corridor in the community is the traffic distribution result of the whole network. This kind of graph can clearly express the trend of urban traffic passenger flow. It presents the shape of urban traffic corridors, which can evaluate the construction process of urban corridors, the supply and demand of transportation infrastructure, the connection strength of urban agglomerations and the degree of "integration", and provide data support f...

Claims


Application Information

Patent Timeline
Patent Type & Authority Applications(China)
IPC IPC(8): G06F16/29G06Q50/26
CPCG06Q50/26G06F16/29
Inventor 张晓春丘建栋庄立坚林青雅林丽健
Owner SHENZHEN URBAN TRANSPORT PLANNING CENT
Learn More