Stock technical index display method, device and system

A technical indicator and display system technology, which is applied in the field of stock technical indicator display, can solve the problems of inconvenient display and analysis of various stock technical indicators, low service efficiency, etc., and avoid complex data display that is not timely enough and less processed data , the effect of improving efficiency

Pending Publication Date: 2021-06-01
沈阳麟龙科技股份有限公司
View PDF0 Cites 1 Cited by
  • Summary
  • Abstract
  • Description
  • Claims
  • Application Information

AI Technical Summary

Problems solved by technology

[0003] The present invention provides a method, device and system for displaying stock technical indicators, which solves the pro

Method used


Image

  • Stock technical index display method, device and system
  • Stock technical index display method, device and system
  • Stock technical index display method, device and system

Examples


Embodiment Construction

[0022] In order to make the purpose, technical solution and advantages of the present invention clearer, the technical solution of the present invention will be clearly and completely described below in conjunction with specific embodiments of the present invention and corresponding drawings. Apparently, the described embodiments are only some of the embodiments of the present invention, but not all of them. Based on the embodiments of the present invention, all other embodiments obtained by persons of ordinary skill in the art without making creative efforts belong to the protection scope of the present invention.

[0023] In the existing stock technical index display method, only one or several index data are usually fixedly displayed. When the user needs to compare various stock technical index data according to his own needs, the user usually has two ways: 1. On the screen Configure multiple technical indicators in the two or three boxes in the box, 2. Compare by switching...


PUM


Abstract

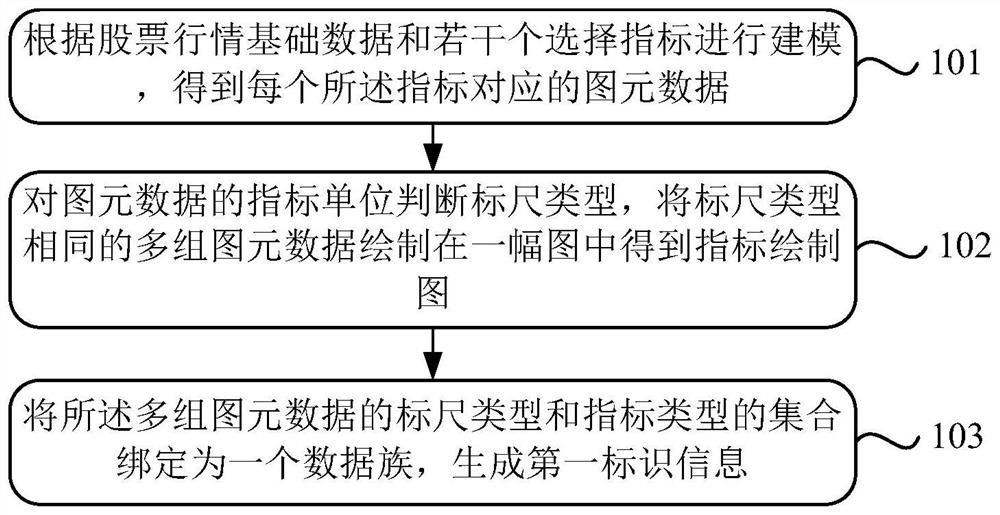
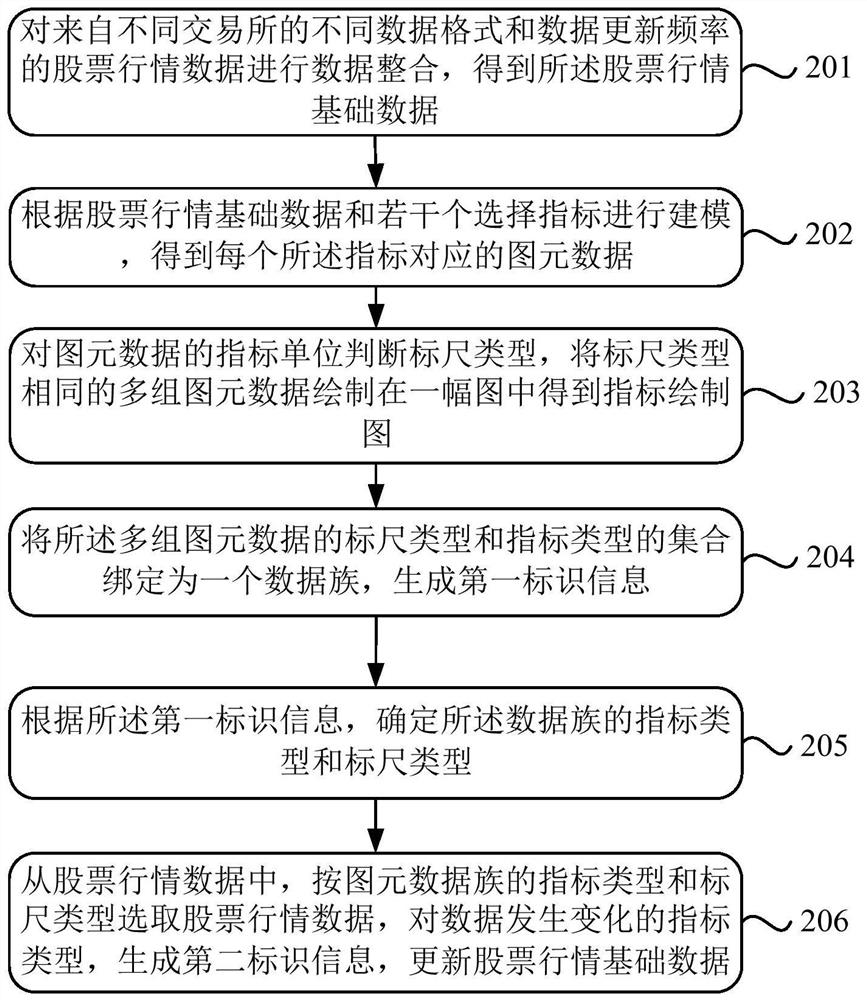
The invention discloses a stock technical index display method, device and system, and the method comprises the steps: carrying out the modeling according to stock quotation basic data and a plurality of selection indexes, and obtaining corresponding graphic element data; judging the scale type of the index unit of the primitive data, and drawing multiple groups of primitive data with the same scale type in one graph to obtain an index drawing graph; and binding the sets of the scale types and the index types of the multiple groups of primitive data into a data family. The system and the device are used for implementing the method. The problems of inconvenient operation and low service efficiency in the prior art are solved.

Description

technical field [0001] The invention relates to the technical analysis field of stock quotes, in particular to a method, system and device for displaying stock technical indicators. Background technique [0002] Existing software for displaying stock market information on hand-held terminals usually only displays one or several index data fixedly. When users need to compare multiple stock technical index data according to their own needs, users usually have two methods: : Configure a variety of technical indicators in the two or three boxes in the screen, and compare them by switching charts. The disadvantage of configuring multiple technical indicators is that it is limited by the screen size of the handheld terminal, and the number of indicators that support configuration is limited, and multiple indicators are on different charts, which cannot be compared more intuitively; During this period, the stock market data is updated in real time, and the way of switching charts ...

Claims


Application Information

Patent Timeline
IPC IPC(8): G06Q10/06G06Q30/02G06Q40/04
CPCG06Q10/06393G06Q30/0201G06Q40/04
Inventor 安萌何国立周朝阳严亚军
Owner 沈阳麟龙科技股份有限公司
Why Eureka
Try Eureka