A Quality Evaluation Method of ECG Signal
A technology for evaluating the quality of ECG signals, applied in diagnostic recording/measurement, medical science, diagnosis, etc., can solve problems such as error analysis, poor quality ECG records, increase the workload of doctors, etc., and achieve the effect of improving accuracy
- Summary
- Abstract
- Description
- Claims
- Application Information
AI Technical Summary
Problems solved by technology
Method used
Image

Examples
Embodiment 1
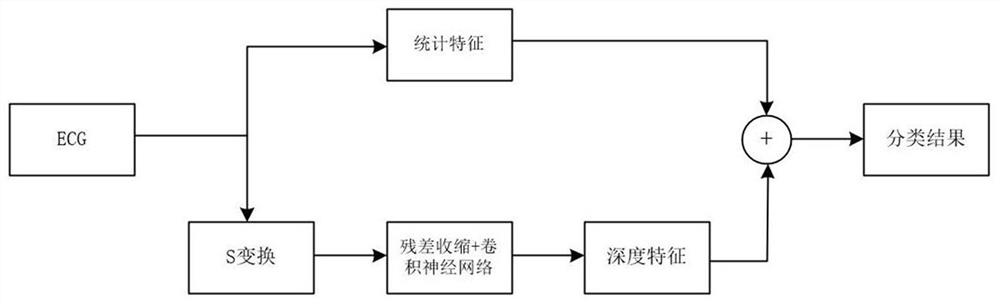
[0037] Step b) The central electrical signal E(t) is segmented into equal-length segments of 10s, and the segmented ECG signals are marked as acceptable and unacceptable according to the annotation standards of the 2011 PhysioNet / Computingin Cardiology Challenge.
Embodiment 2
[0039] The feature in the statistical feature matrix StaF in step c) includes:
[0040] c-1) Take the maximum R-peak interval as the quality index 1 of the ECG record.
[0041] c-2) The minimum R-peak interval is used as the quality index 2 of the ECG record.
[0042] c-3) The average R peak interval is used as the quality index 3 of the ECG record.
[0043] c-4) The standard deviation of the R peak interval is used as the quality index 4 of the ECG record.
[0044] c-5) The ratio pNN50 of the difference between adjacent R peaks greater than 50 ms is used as the quality index 5 of the ECG record.
[0045] c-6) The R peak density (that is, the number of R peaks / record length) is used as the quality index 6 of the ECG record.
[0046] c-7) The root mean square RMSSD of the difference between adjacent R peaks is used as the quality index 7 of the ECG record.
[0047] c-8) The RR interval sampling entropy, which measures the confusion of R peak interval changes, will be used a...
Embodiment 3
[0050] The S-transform in step d) is the inheritance and development of the wavelet transform and the short-time Fourier transform, which can not only maintain a high high-frequency time resolution, but also maintain a high low-frequency frequency resolution. The formula for the S-transform is: Through this calculation, the time-spectrum matrix S(τ,f) is obtained, where x(t) is the ECG signal to be analyzed, τ is the time shift factor, p is a rational number, i is an imaginary number unit, t is time, and e is an irrational number , f is the frequency.
PUM
 Abstract
Description
Claims
Application Information
 - R&D Engineer
- R&D Manager
- IP Professional
- Industry Leading Data Capabilities
- Powerful AI technology
- Patent DNA Extraction
Browse by: Latest US Patents, China's latest patents, Technical Efficacy Thesaurus, Application Domain, Technology Topic.
© 2024 PatSnap. All rights reserved.Legal|Privacy policy|Modern Slavery Act Transparency Statement|Sitemap