Combined analysis of cytokines as a marker of schizophrenia and its application
A technology for schizophrenia and cytokines, which is applied in the field of detecting the effects of medication in patients with schizophrenia, can solve the problems that the detection effect is difficult to determine, the AUC value, specificity and sensitivity of the detection are not published publicly, and the diagnosis is rigorous and highly sensitive. Sexual and specific effects
- Summary
- Abstract
- Description
- Claims
- Application Information
AI Technical Summary
Problems solved by technology
Method used
Image
Examples
Embodiment 1
[0040] The subjects were 24 first-episode schizophrenia patients (FEDF) admitted to the Third People's Hospital of Foshan City, and 25 age- and sex-matched healthy volunteers were recruited as controls (HC), of which 19 patients with schizophrenia received eight-week treatment. Peripheral blood samples were collected again after short-term treatment. All physicians involved in the diagnosis work are qualified as psychiatrists and have more than 10 years of experience in psychiatry. They are proficient in ICD-10 and DSM-V diagnostic criteria. The psychopathological state of the patients was evaluated, the operating standards were unified, and the consistency test met the requirements (Kappa=0.68-0.82), and schizophrenia patients with comorbidities were excluded before enrollment. All participants gave written informed consent before inclusion in the study. The study protocol was approved by the Ethics Committee of the Third People's Hospital of Foshan.
[0041] 1. Serum Extra...
Embodiment 2
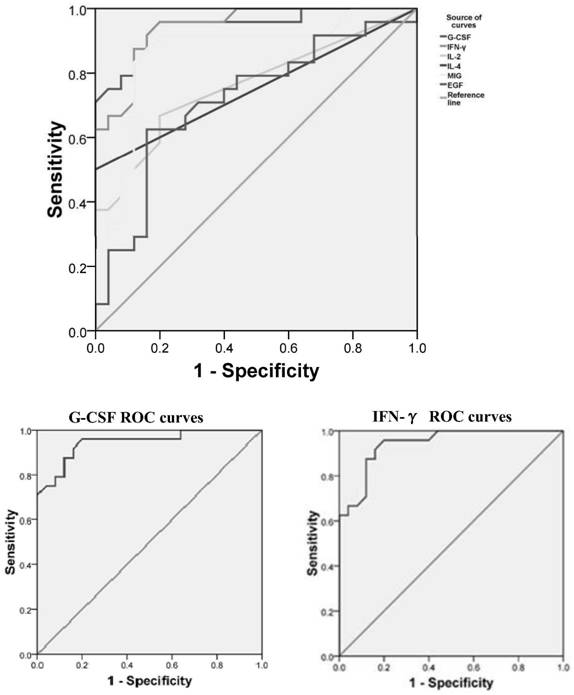
[0056] On the basis of Example 1, the diagnostic effects of G-CSF, IFN-γ, IL-2, IL-4, MIG, and EGF were independently observed and represented by ROC curve. The larger the area under the line (AUC) of the ROC curve, the better the diagnostic effect.
[0057] The result is as image 3 It was shown that the AUCs of G-CSF, IFN-γ, IL-2, IL-4, MIG, and EGF were 0.945, 0.942, 0.774, 0.750, 0.867 and 0.718, respectively. Among them, G-CSF and IFN-γ had the best diagnostic effect, and the sensitivity and specificity of the two factors reached 95.8% and 80.0%.
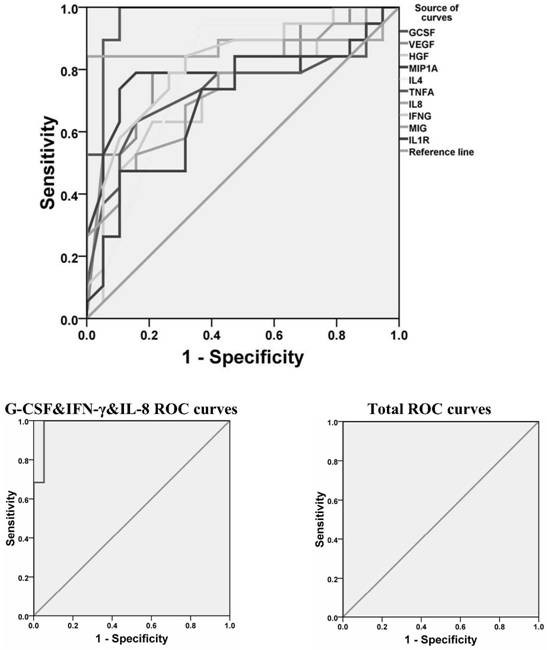
[0058] Further, the diagnostic effect of the combination of five factors of G-CSF, IL-2, IL-4, MIG and EGF was observed and represented by ROC curve. The larger the area under the line (AUC) of the ROC curve, the better the diagnostic effect.
[0059] The result is as Figure 4 It was shown that the AUC of the combined analysis of G-CSF, IL-2, IL-4, MIG and EGF was 0.993, and its sensitivity and specificity reached 100% and...
Embodiment 3
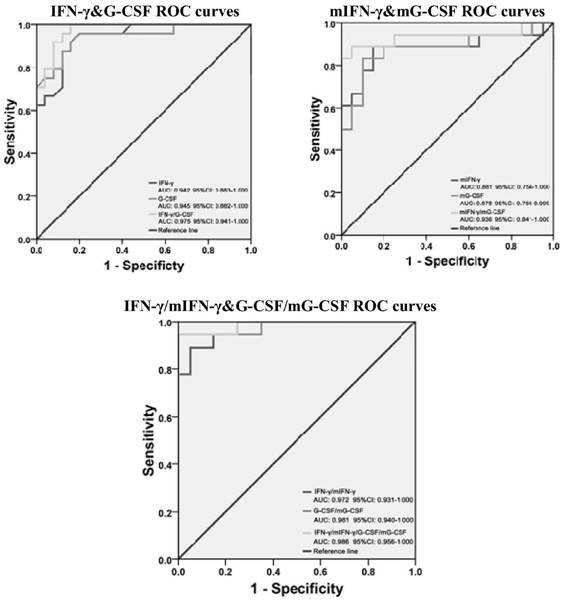
[0061] The diagnostic effect of G-CSF, IL-2, IL-4, IFN-γ, MIG and EGF combination of six factors was observed and represented by ROC curve. The larger the area under the line (AUC) of the ROC curve, the better the diagnostic effect.
[0062] The result is as Figure 5 As shown, the AUC of the combined analysis of the six factors G-CSF, IFN-γ, IL-2, IL-4, MIG and EGF was 0.997. Its sensitivity and specificity reached 100% and 96%.
PUM
| Property | Measurement | Unit |
|---|---|---|
| Sensitivity | aaaaa | aaaaa |
| Sensitivity | aaaaa | aaaaa |
Abstract
Description
Claims
Application Information
 - R&D
- Intellectual Property
- Life Sciences
- Materials
- Tech Scout
- Unparalleled Data Quality
- Higher Quality Content
- 60% Fewer Hallucinations
Browse by: Latest US Patents, China's latest patents, Technical Efficacy Thesaurus, Application Domain, Technology Topic, Popular Technical Reports.
© 2025 PatSnap. All rights reserved.Legal|Privacy policy|Modern Slavery Act Transparency Statement|Sitemap|About US| Contact US: help@patsnap.com


