

Power grid real-time data visualization display method and system
A real-time data, power grid technology, applied in visual data mining, data processing applications, structured data browsing, etc., can solve problems such as low visualization efficiency, and achieve the effect of increasing simulation accuracy and visualization efficiency
- Summary
- Abstract
- Description
- Claims
- Application Information
AI Technical Summary
Problems solved by technology
Method used
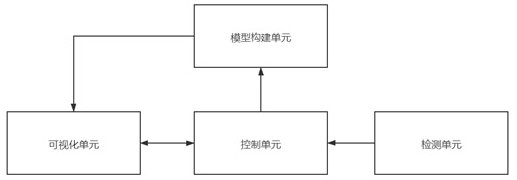
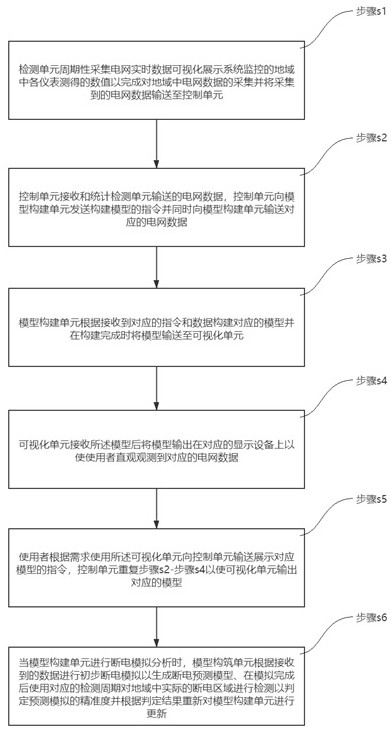
Image

Examples
Embodiment Construction
[0058] In order to make the objects and advantages of the present invention clearer, the present invention will be further described below in conjunction with the examples; it should be understood that the specific examples described here are only for explaining the present invention, and are not intended to limit the present invention.
[0059] Preferred embodiments of the present invention are described below with reference to the accompanying drawings. Those skilled in the art should understand that these embodiments are only used to explain the technical principle of the present invention, and are not intended to limit the protection scope of the present invention.
[0060] It should be noted that, in the description of the present invention, terms such as "upper", "lower", "left", "right", "inner", "outer" and other indicated directions or positional relationships are based on the terms shown in the accompanying drawings. The direction or positional relationship shown is ...
PUM
 Abstract
Description
Claims
Application Information