

Thermal anomaly detection and classification
a technology of thermal anomalies and anomalies, applied in the field of thermal anomalies detection and classification, can solve problems such as the challenge of detecting events in observational data sets such as satellite imagery
Active Publication Date: 2022-04-19
DESCARTES LABS INC
View PDF10 Cites 1 Cited by
- Summary
- Abstract
- Description
- Claims
- Application Information
AI Technical Summary
Benefits of technology
The patent text describes a system and method for detecting and classifying events in large amounts of observational data, such as satellite imagery. The technical effects of this patent include improved efficiency in processing and analyzing such data, as well as the ability to detect and classify events in real-time. The system uses a boundary map to enhance the classification of images and can also detect and classify changes in the spectral signatures of crops over time. The patent also includes various methods for ingesting and preprocessing data, as well as creating a composite image and enhancing the classification of an image using a boundary map. Overall, the patent provides techniques for more effectively analyzing and processing large amounts of data.
Problems solved by technology
Detecting events in observational data sets such as satellite imagery can be challenging due to factors such as the size of such observational data sets, and the manner in which they are encoded / captured.
Method used
View moreImage
Smart ImageViewing Examples

Examples
example fires
[0348]E. Example Fires
[0349]Ignitions corresponding to three California wildfires are depicted in FIGS. 42A-42C. FIG. 42A shows ignition of the Barham fire as detected using a platform implementing techniques described herein. FIG. 42B shows ignition of the Kincaid fire as detected using a platform implementing techniques described herein. FIG. 42C shows ignition of the Maria fire as detected using a platform implementing techniques described herein.
[0350]Representations of the detection events (e.g., as stored in platform 2800 as GeoJSON formatted Vector messages) are depicted, respectively, in FIGS. 43A-43C.
Login to View More PUM
 Abstract
A set of images is received. A thermal anomaly is detected in the received set of images. The detected thermal anomaly is classified. Examples of classifications of thermal anomalies include: stationary targets, gas flares, agricultural anomalies, and wildfires. An action is taken based at least in part on the classified detected anomaly.
Description
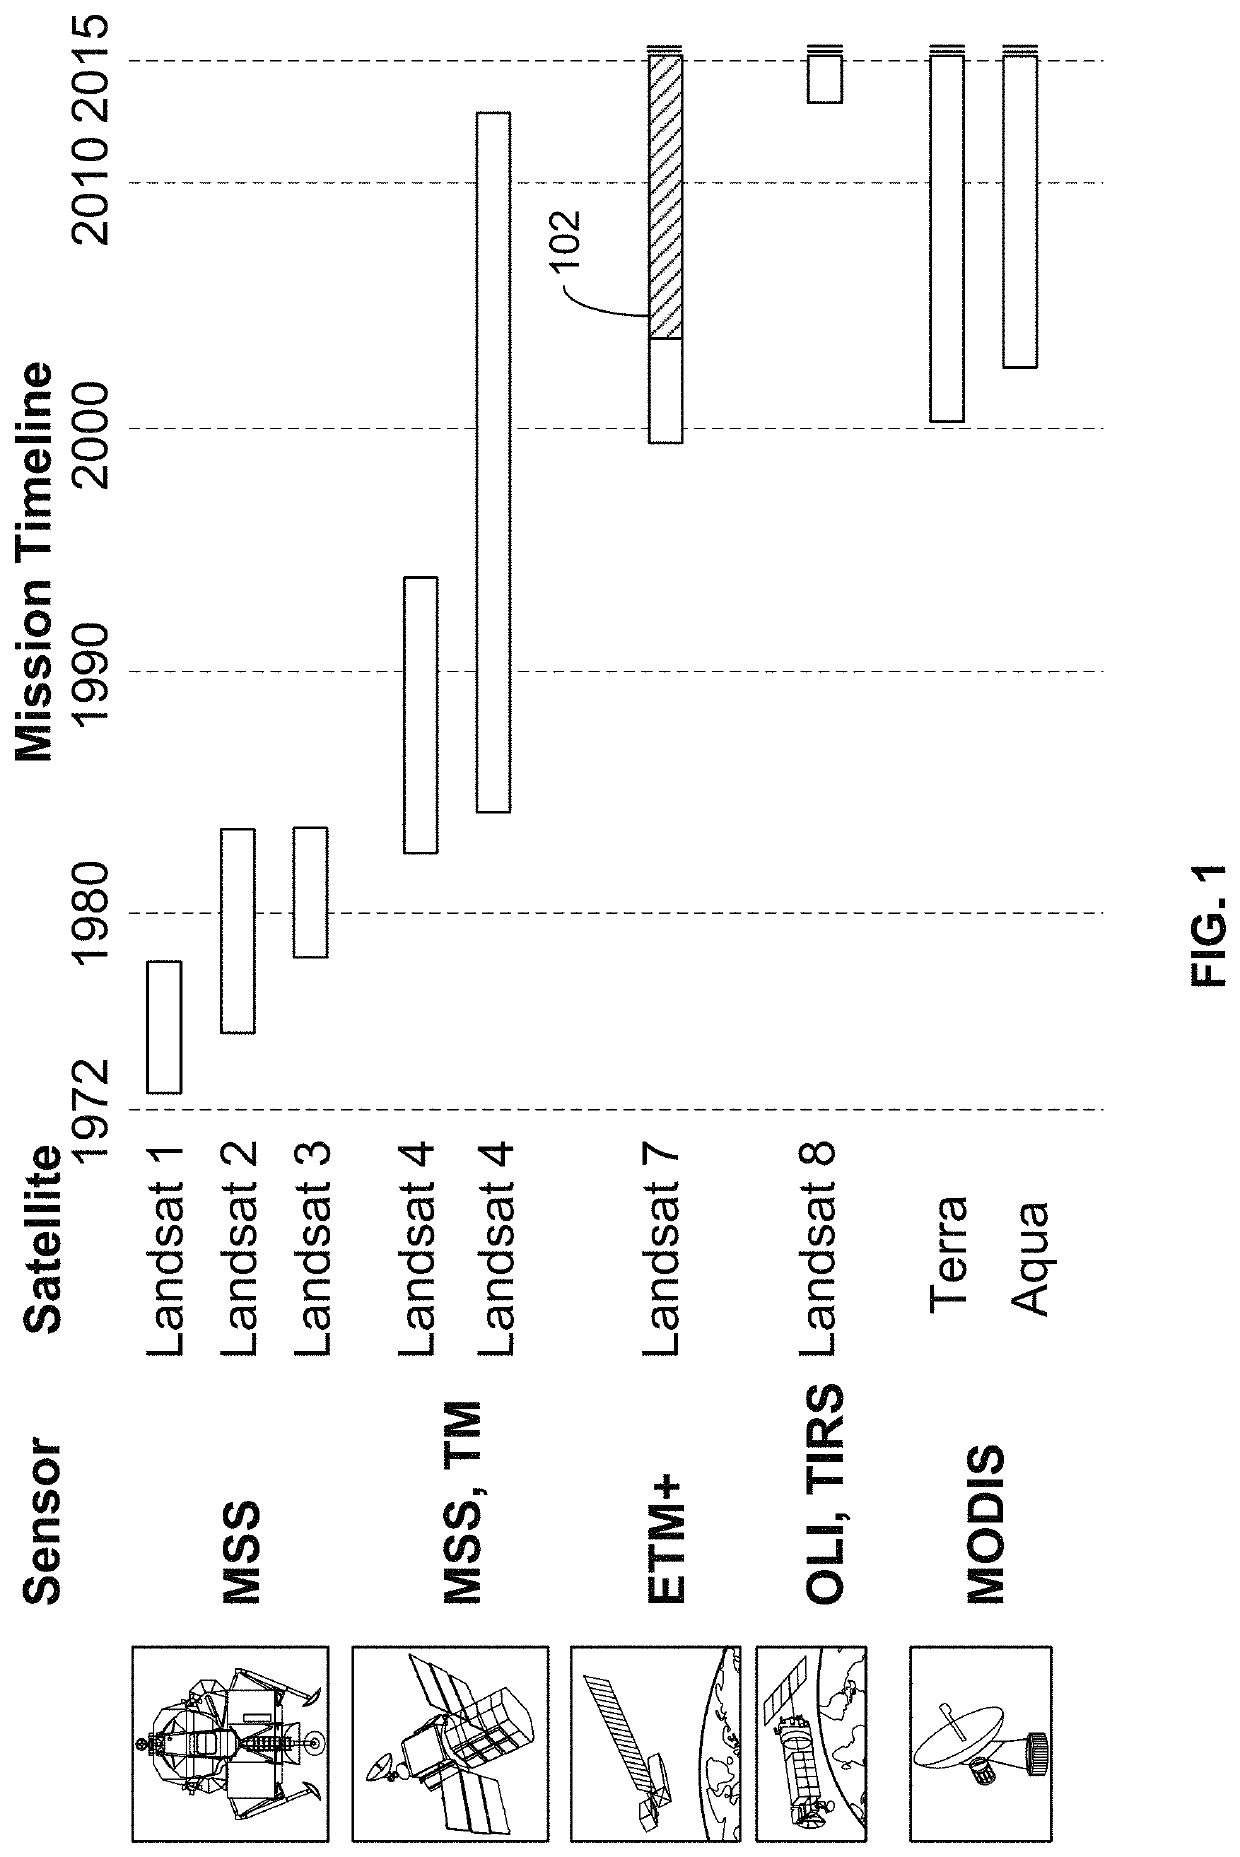
CROSS REFERENCE TO OTHER APPLICATIONS[0001]This application claims priority to U.S. Provisional Patent Application No. 62 / 992,080 entitled THERMAL ANOMALY DETECTION AND CLASSIFICATION filed Mar. 19, 2020 which is incorporated herein by reference for all purposes.BACKGROUND OF THE INVENTION[0002]Detecting events in observational data sets such as satellite imagery can be challenging due to factors such as the size of such observational data sets, and the manner in which they are encoded / captured. This challenge can be particularly daunting when attempting to detect events in real time. Accordingly, there is an ongoing need for systems and techniques capable of efficiently processing imagery data.BRIEF DESCRIPTION OF THE DRAWINGS[0003]Various embodiments of the invention are disclosed in the following detailed description and the accompanying drawings.[0004]FIG. 1 shows NASA / USGS Landsat and MODIS satellites and sensors providing data that can be processed using embodiments of techniq...
Claims
Login to View More Application Information
Patent Timeline
 Patent Type & AuthorityPatents(United States)
IPC IPC(8): G06T7/00G06T7/162G06T5/50H04N5/33G01J5/02G01J5/00
CPCG06T5/50G01J5/025H04N5/332G01J2005/0077G06T2207/10048G06T2207/30188G01J5/026G06T7/0002G06T2207/10036H04N23/11
InventorWHEELER, CLYDE BENNETZHOU, HANG
OwnerDESCARTES LABS INC