Computer software program for graphically displaying genetic linkage disequilibrium, and the method thereof

a computer software and disequilibrium technology, applied in the field of computer software programs for graphically displaying genetic linkage disequilibrium and the method thereof, can solve the problems of difficult identification of differences between the case group and the control group, and the difficulty of finding differences

Inactive Publication Date: 2004-12-23
DYNACOM
View PDF0 Cites 10 Cited by
  • Summary
  • Abstract
  • Description
  • Claims
  • Application Information

AI Technical Summary

Problems solved by technology

However, in the prior art, the linkage disequilibrium values have been simply shown separately in a table format; thus, finding differences between the case group and the control group has been very d

Method used


Image

  • Computer software program for graphically displaying genetic linkage disequilibrium, and the method thereof
  • Computer software program for graphically displaying genetic linkage disequilibrium, and the method thereof
  • Computer software program for graphically displaying genetic linkage disequilibrium, and the method thereof

Examples


Embodiment Construction

[0036] An embodiment of the present invention is described below with reference to the accompanying figures.

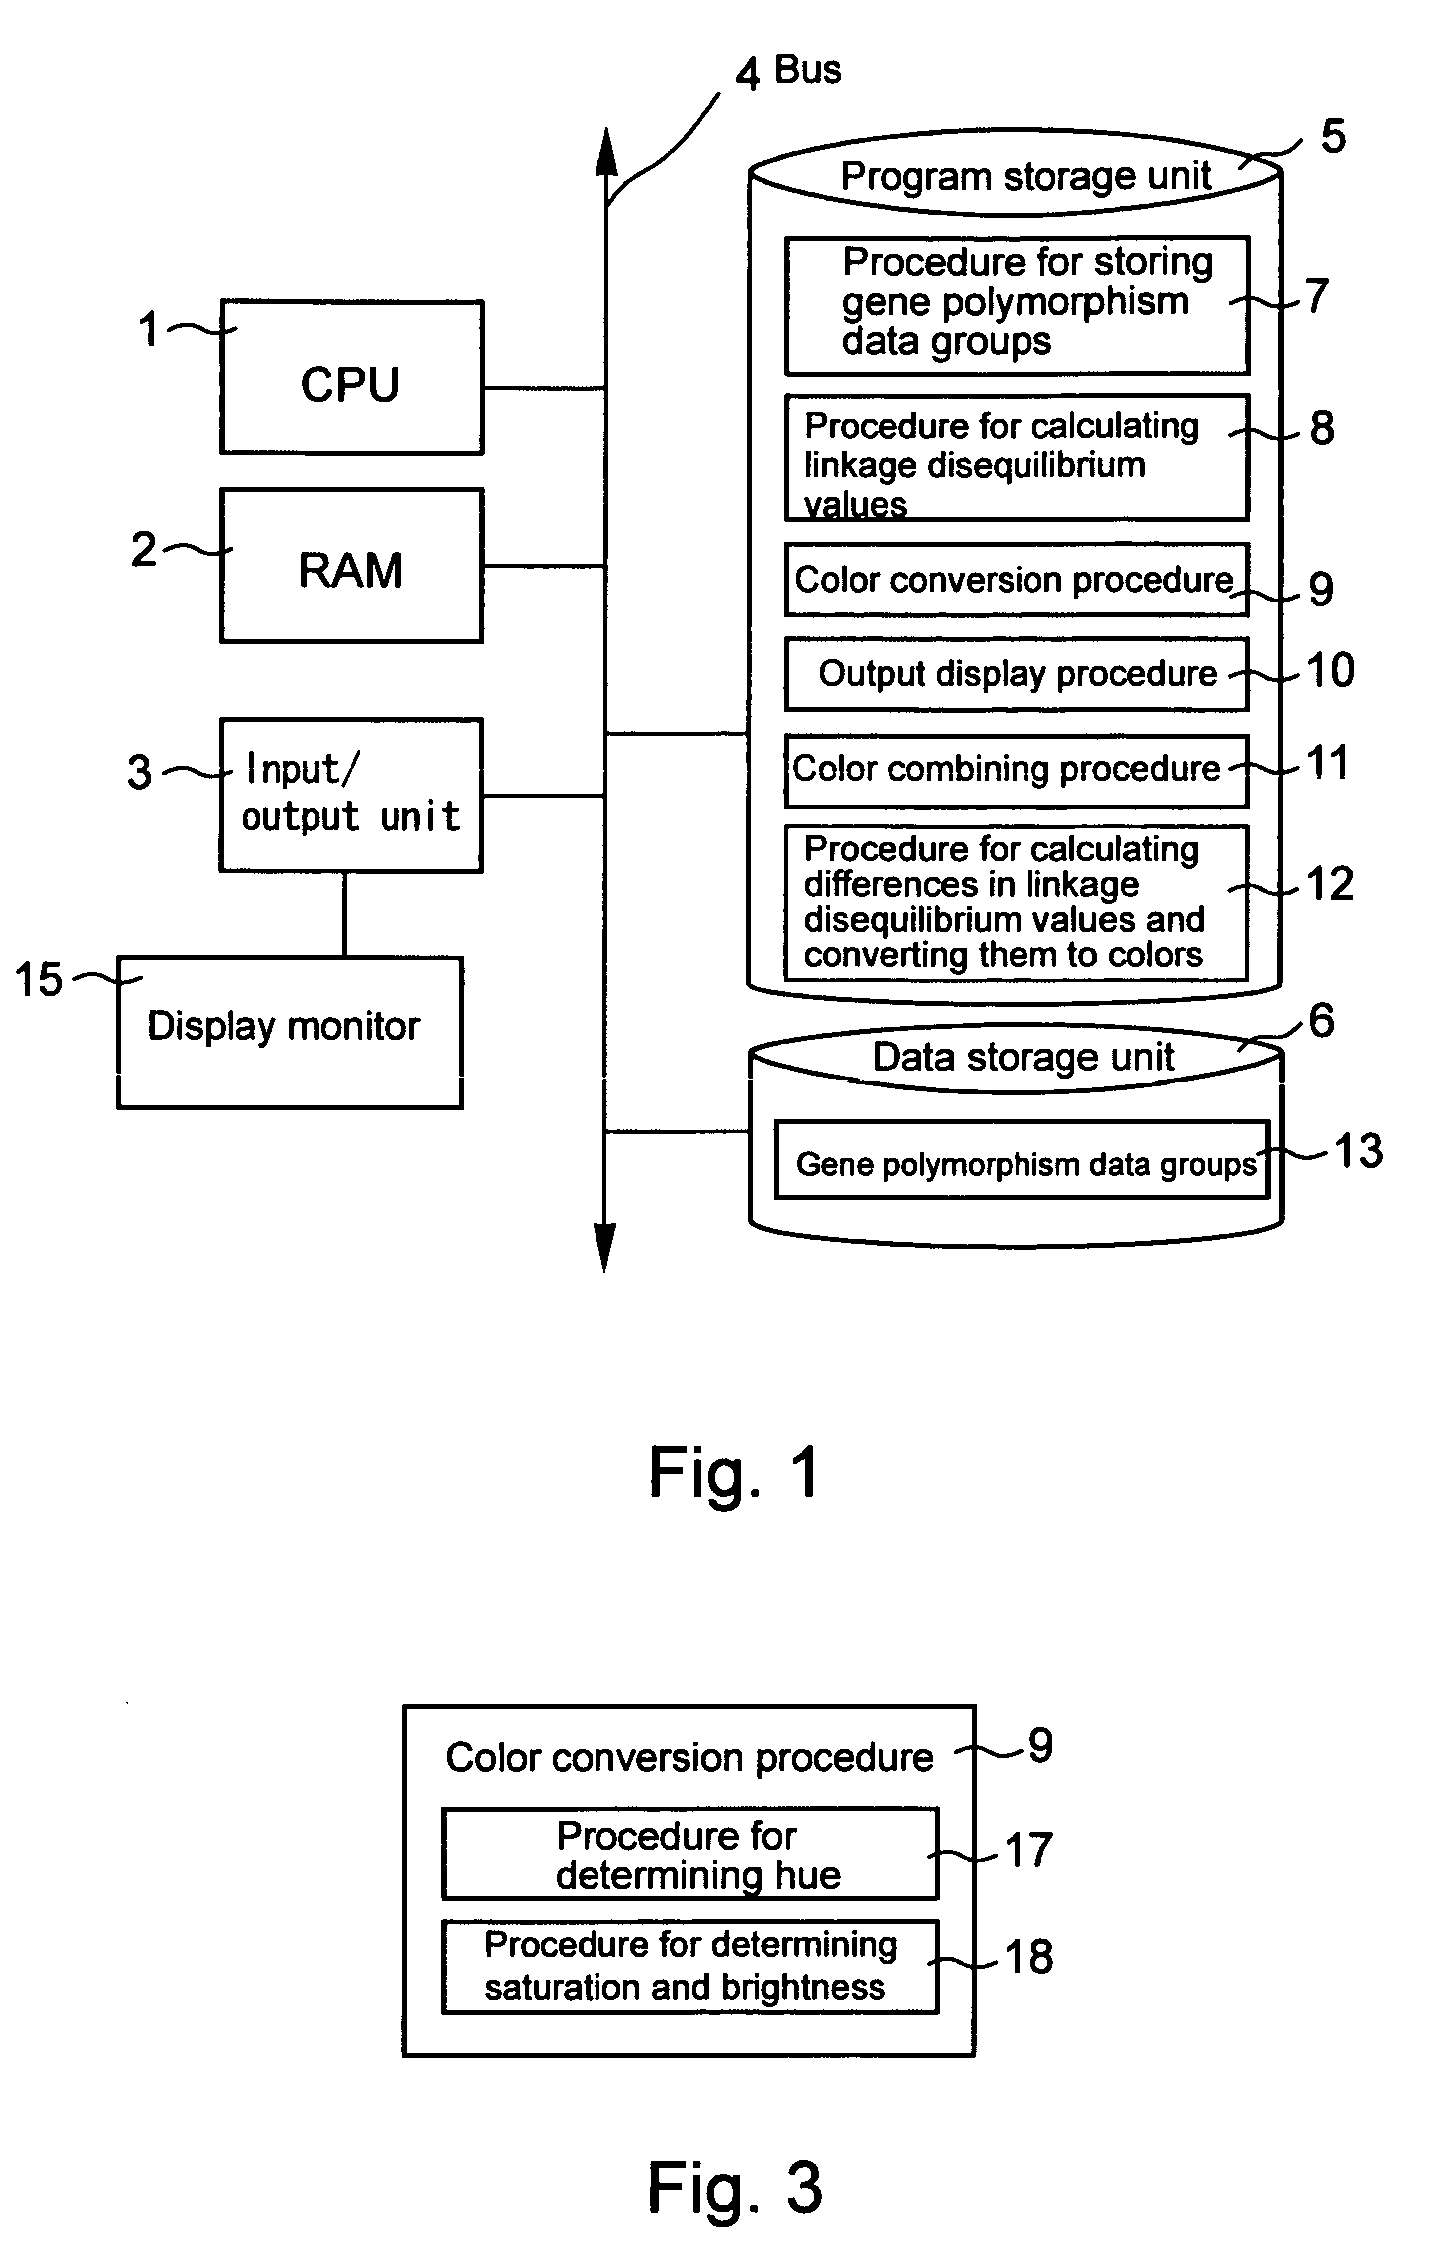
[0037] FIG. 1 is an overview of a system configuration with the computer software concerning the embodiment.

[0038] This system is comprised of a program storage unit 5 and a data storage unit 6, both connected to a bus 4 to which a CPU 1, a RAM 2 and an I / O unit 3 are also connected. The program storage unit 5 is comprised of the following components: a gene polymorphism data groups storage procedure 7 for storing gene polymorphism data groups 13 in the data storage unit 6; a linkage disequilibrium values calculation procedure 8 for calculating linkage disequilibrium values for pairs of gene loci for each data group by creating a pairwise contingency table; a color conversion procedure 9 for converting the linkage disequilibrium values to a set of colors having color densities based on the values for each data group; a color combining procedure 11 for obtaining combined colors...


PUM


Abstract

This invention relates to a computer software program product, including computer readable memory and a computer software program stored on the memory, for calculating linkage disequilibrium values for individual pairs of gene loci for two or more gene polymorphism data groups and displaying results comparatively on a display monitor. The program includes: a color output command for converting the linkage disequilibrium values for individual pairs of gene loci for a first gene polymorphism data group and those for a second gene polymorphism data group into a first color set and a second color set, each color set comprising colors with differently allocated saturation, brightness and density based on the linkage disequilibrium values, and for outputting the two color sets; and a comparative display command for displaying comparative results for the first and second color sets on a display monitor in such a way that comparison of the disequilibrium values between the first and second gene polymorphism data groups can be made.

Description

[0001] This application claims priority under 35 U.S.C. 119 based upon Japanese Patent Application Serial No. 2003-48216, filed on Jan. 21, 2003. The entire disclosure of the aforesaid application is incorporated herein by reference.[0002] 1. Field of the Invention[0003] This invention relates to a method of graphically and comparatively displaying pairwise linkage disequilibrium values that are calculated respectively for a case group and for a control group in gene polymorphism data analyses.[0004] 2. Description of the Related Art[0005] In gene polymorphism studies, linkage strengths among various gene loci are often calculated. "Linkage" means that polymorphism at a certain gene locus and that at a target gene locus are genetically transferred as a pair to the descendants. If sufficiently separated from each other on the chromosome, genes undergo a process of random recombination so that after 5 to 6 generations, a state of equilibrium is achieved. This state is called the Hardy...

Claims


Application Information

Patent Timeline
IPC IPC(8): G01N33/48G01N33/50G16B20/20G16B20/40G16B45/00
CPCG06F19/18G06F19/26G16B20/00G16B45/00G16B20/20G16B20/40
Inventor FUJIMIYA, HITOSHINAKAMURA, EIJIADACHI, HIROKI
Owner DYNACOM
Why Eureka
Try Eureka