
Method and device for measuring visual similarity

a visual similarity and similarity technology, applied in image data processing, instruments, digital data processing details, etc., can solve the problems of reducing the cost of computation time, and reducing the complexity of the calculation of similarity

Inactive Publication Date: 2005-01-06
THOMSON LICENSING SA
View PDF3 Cites 57 Cited by
  • Summary
  • Abstract
  • Description
  • Claims
  • Application Information

AI Technical Summary

Benefits of technology

[0016] The present invention proposes a method for measuring visual similarity taking into account the distance between attributes in the global criterion for maximizing the similarity for the determination of the list of pairs of matched regions. In this way, the present invention enables better measurement of similarity between images and can be used in image search applications based on measurement of visual similarity.
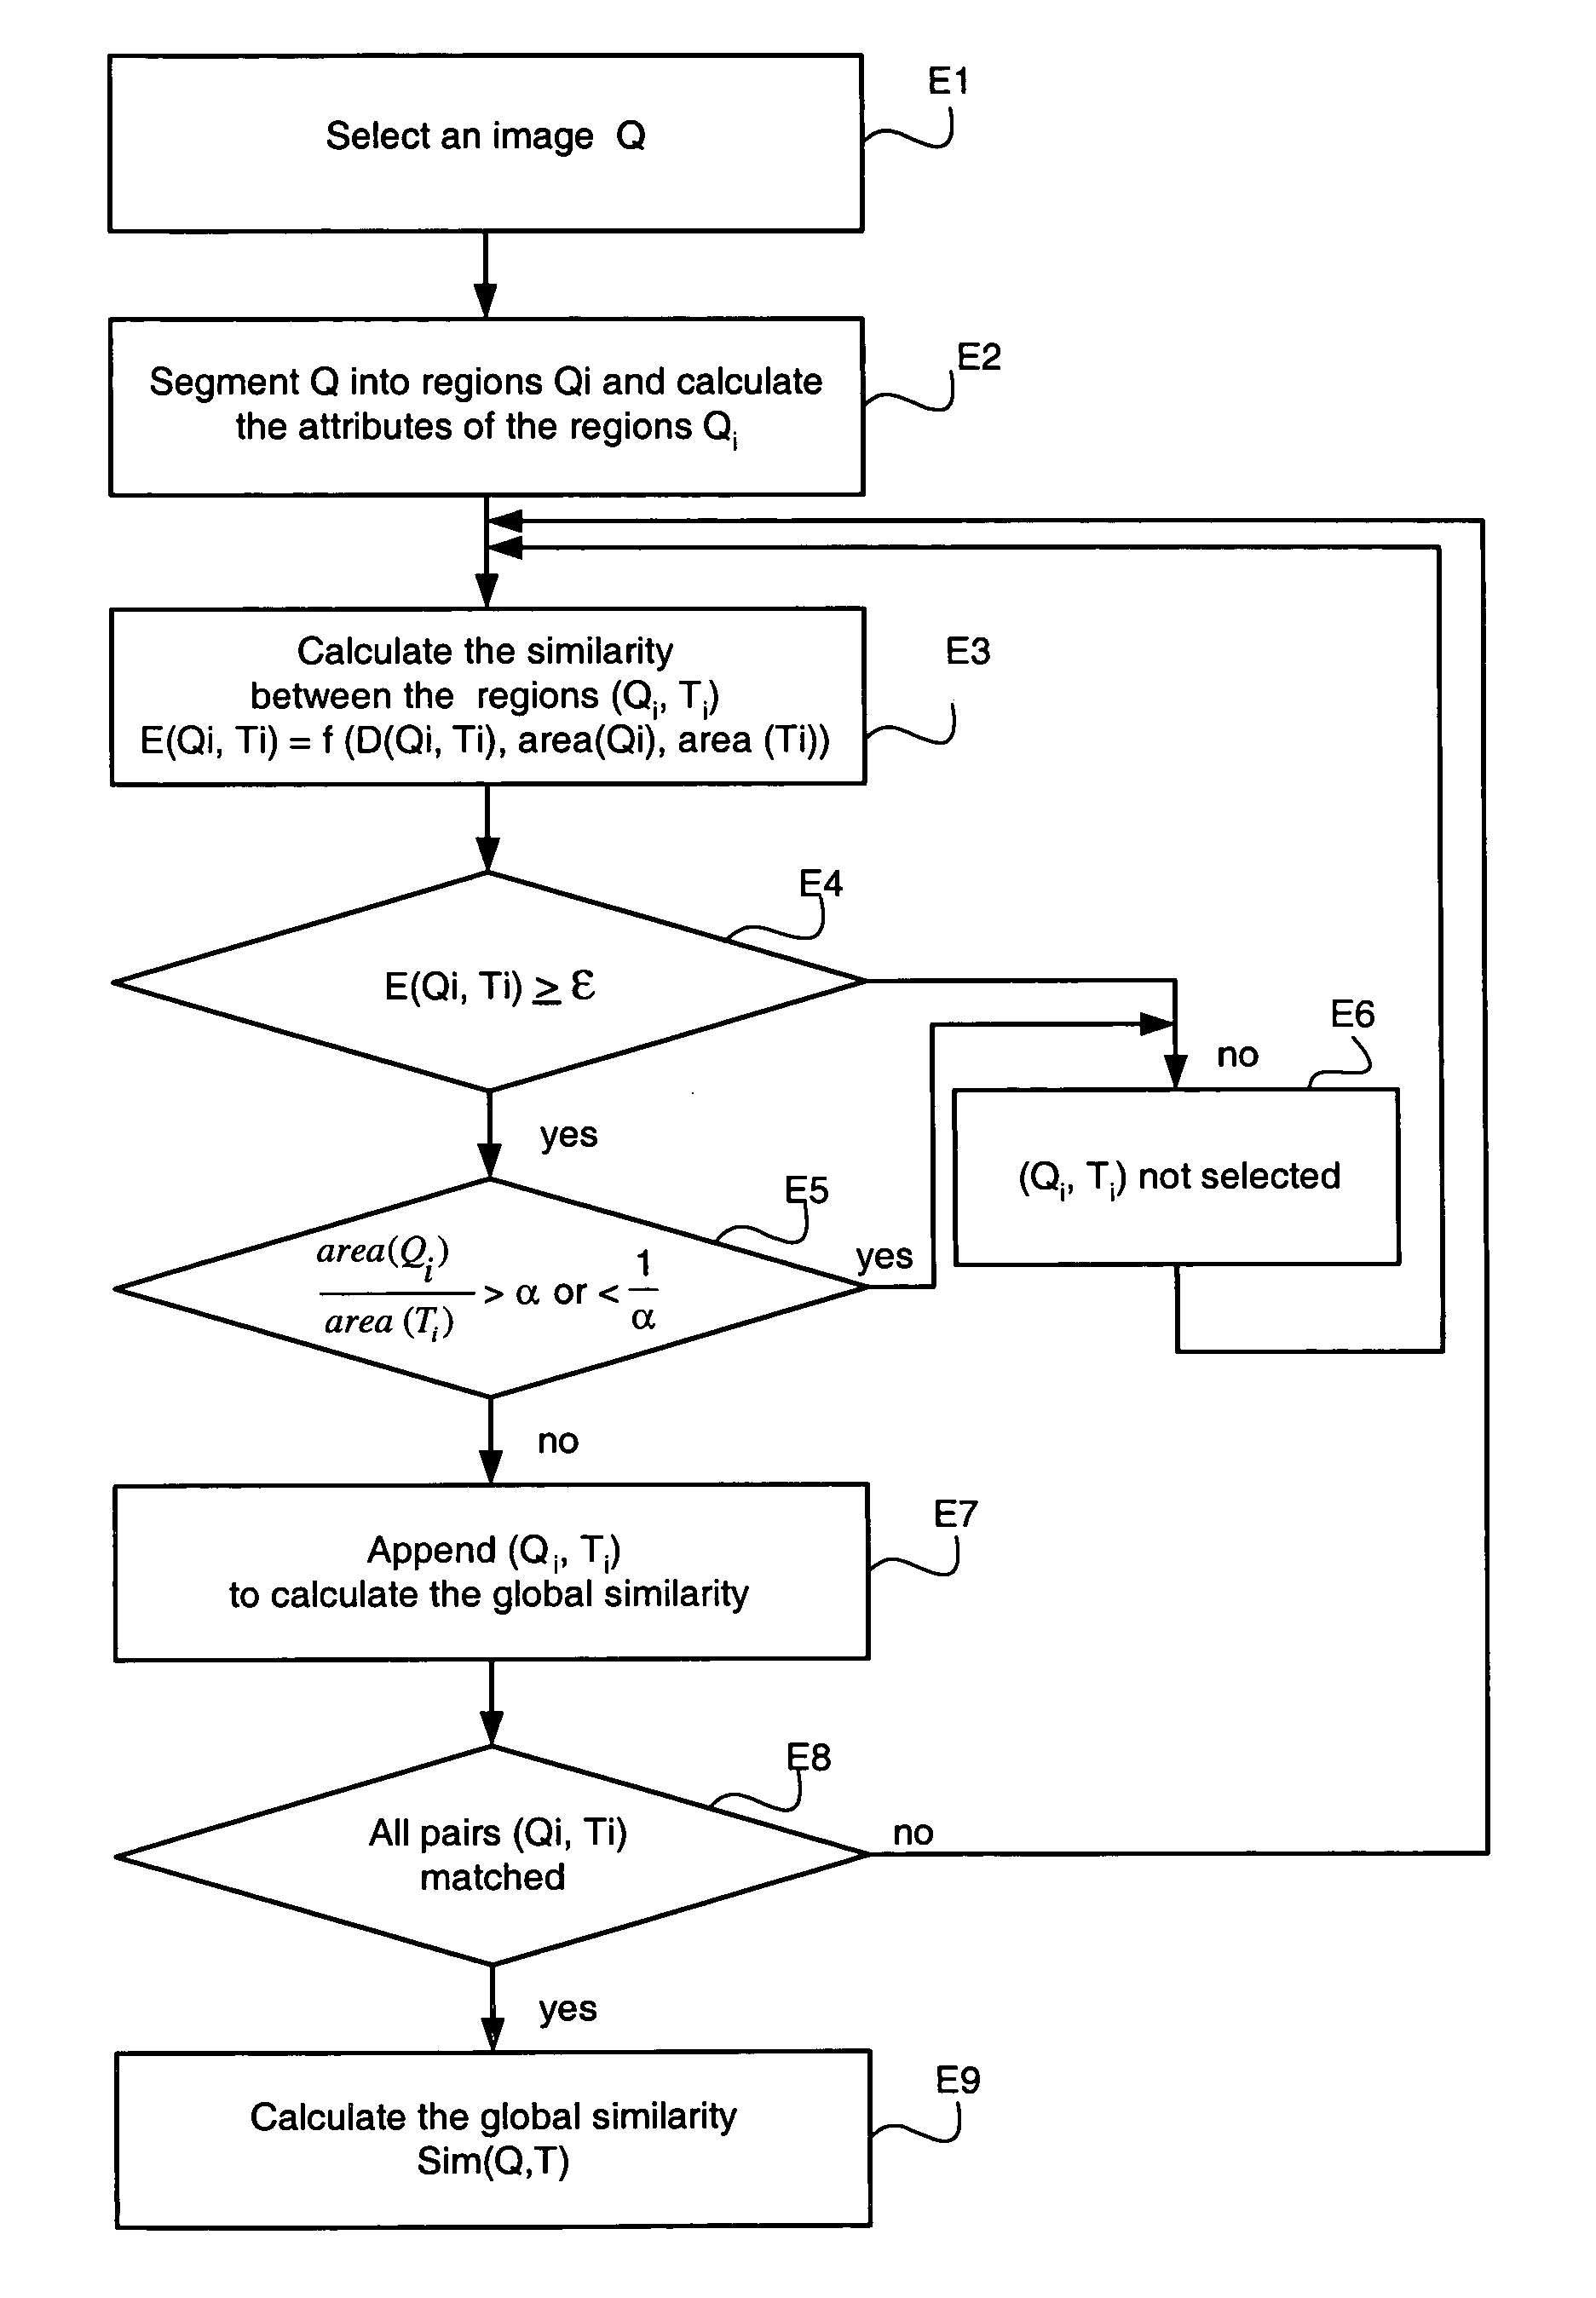
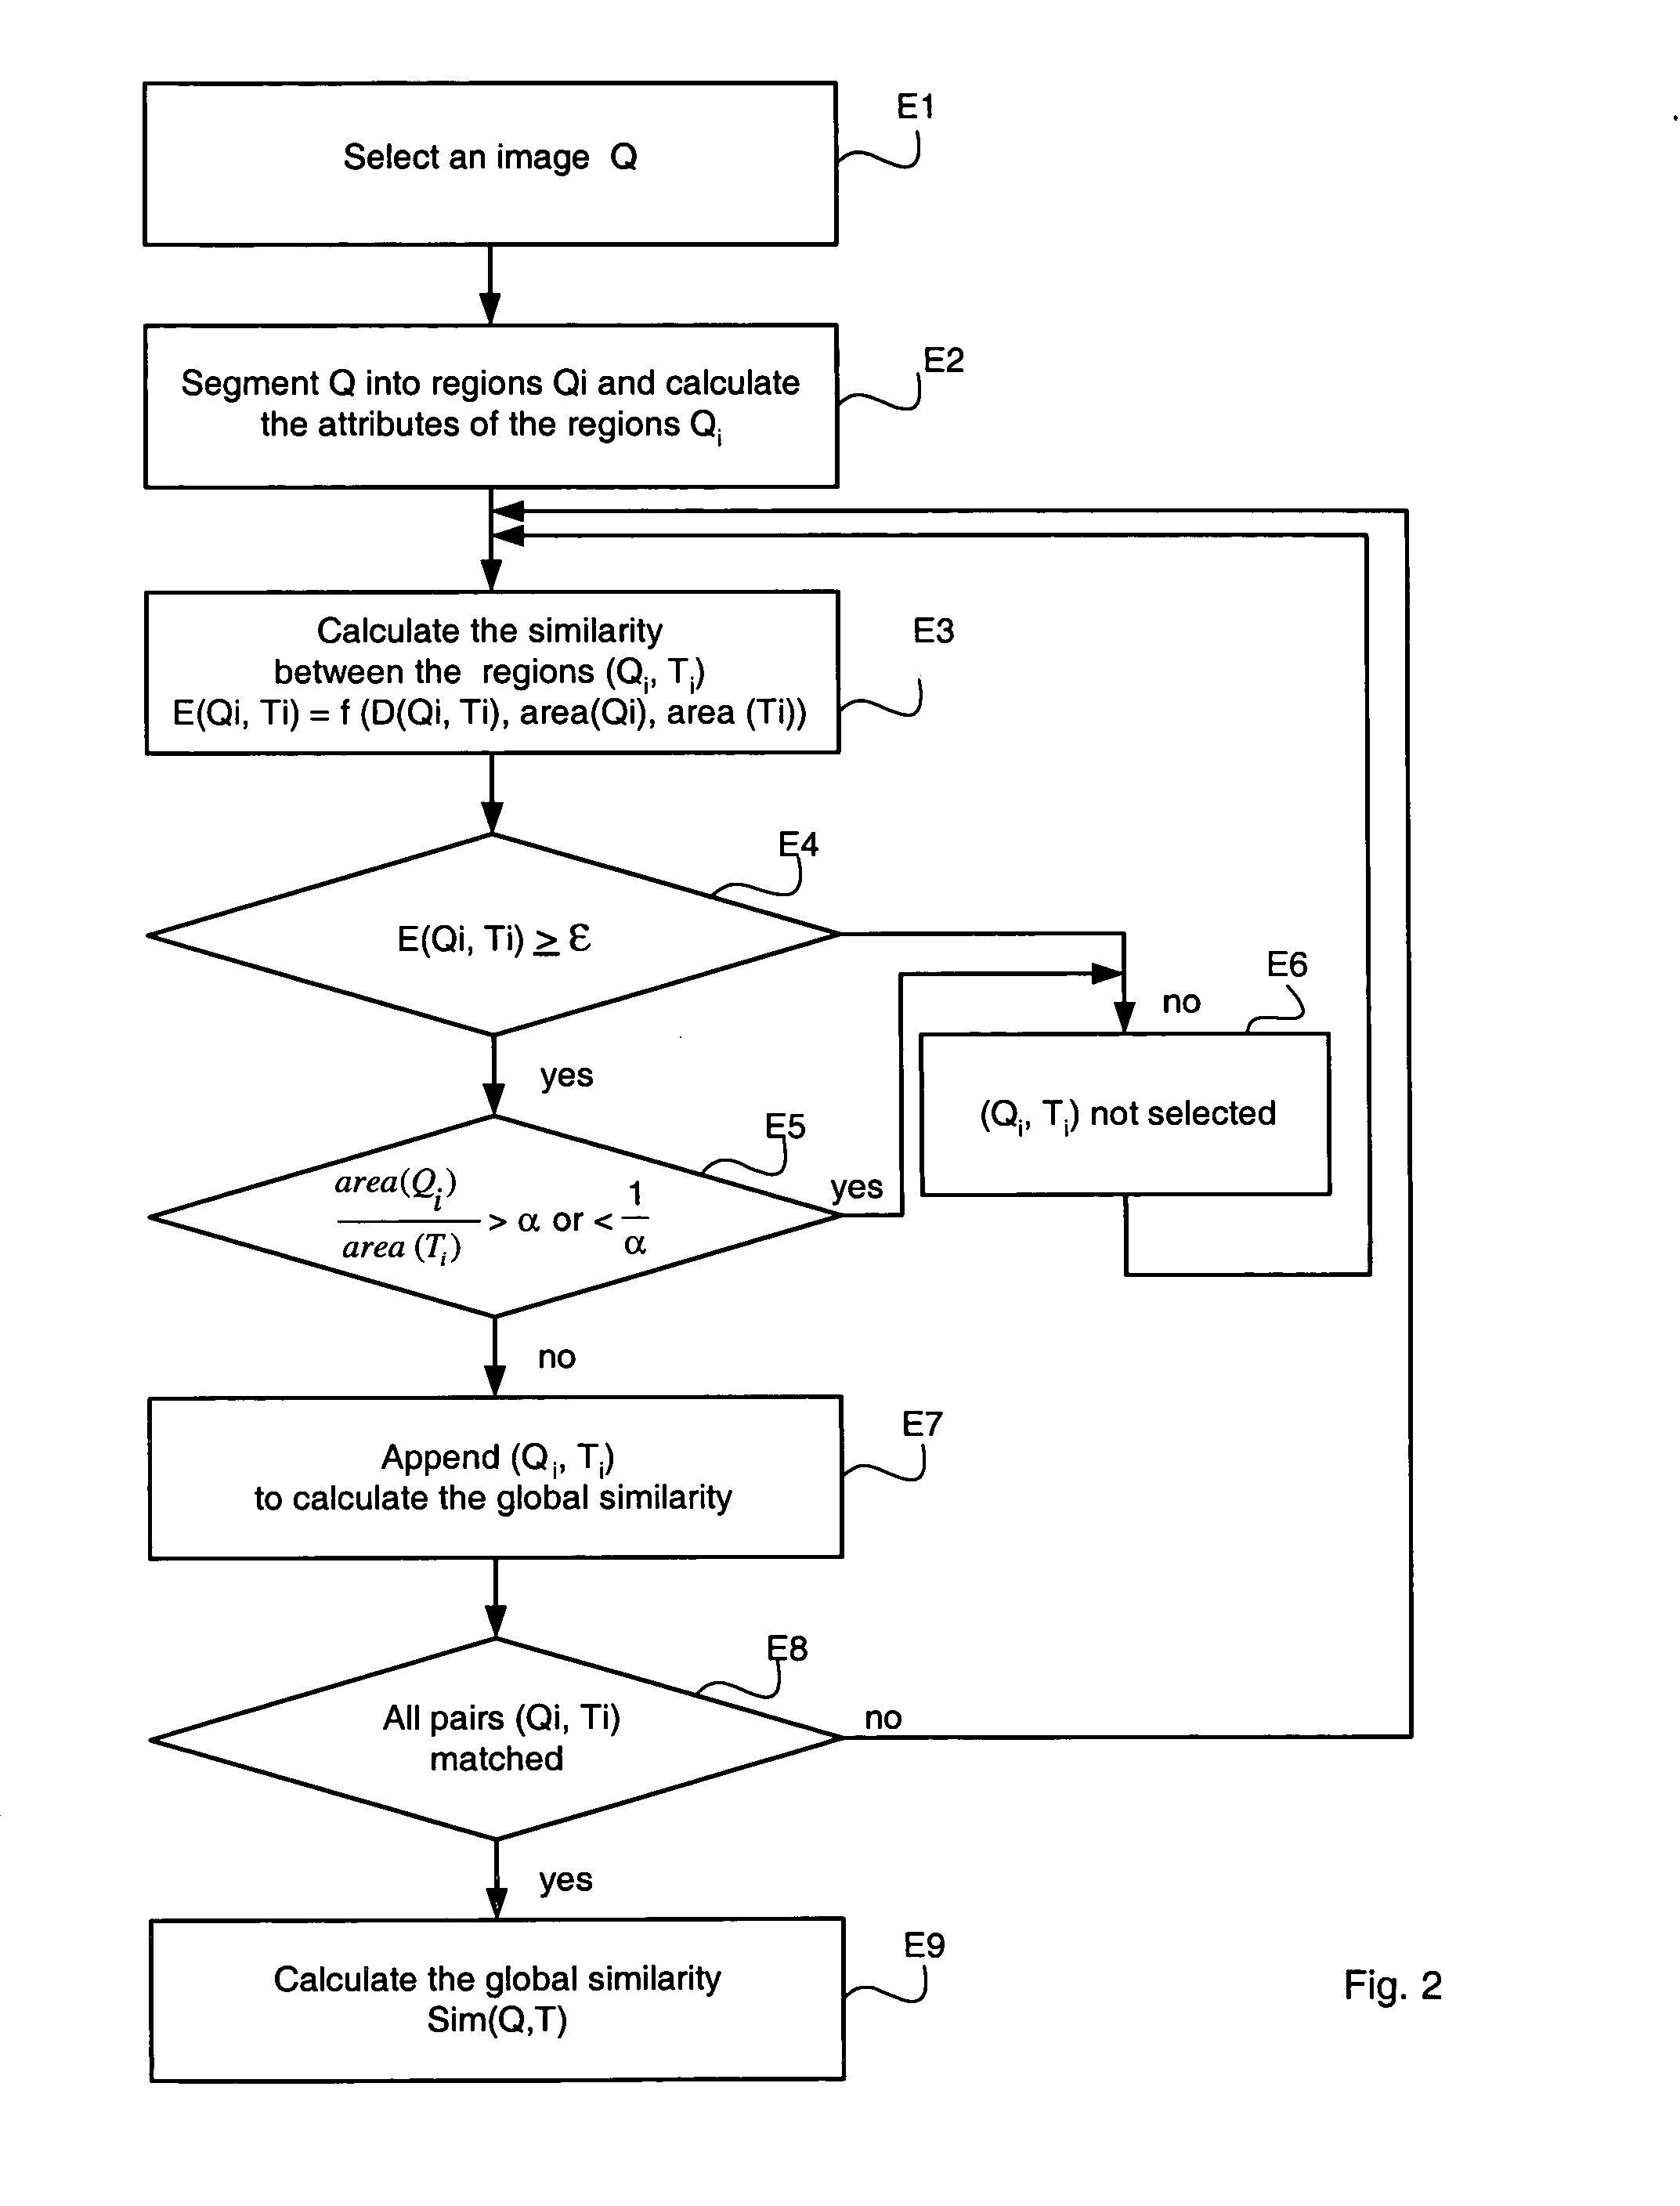
[0029] This corresponds to a suboptimal solution which enables a decrease in the complexity of the calculations of similarity between all the possible regions. In effect, a matching of all the possible regions of the model image with all the possible regions of the target image and an a-posteriori decision of the pairs of regions is very expensive in computation time. The preferred mode of practice proposed makes it possible to minimize the calculations by taking a region of the model image, by measuring the visual similarity between this region and all the regions of the target image and by choosing the region of the target image exhibiting the greatest similarity with the region of the model image. The pair of regions which is thus formed is no longer reassessed thereafter and we move on to another region of the model image as long as some regions remain.

Problems solved by technology

The visual similarity calculated by the machine may sometimes not coincide with the semantic similarity expected by the user, this constituting the main limitation of these content-based indexation and search systems.
However, this method is very dependent on the threshold value ε. Once two regions have been declared visually similar because the distance between their attributes is less than ε, this binary choice is no longer reassessed in the remainder of the calculation.
Too low a threshold will lead to a subestimate of the global similarity between the images, fixed too high it will lead to pairs of regions that are very alike or on the contrary very unalike being processed at the same level.
This makes it possible to be robust to changes of scale (that is to say of zoom factor) but leads to rather undesirable situations where a very small region is matched with an entire image, on the sole basis of their similarity in terms of attributes.

Method used


Image

  • Method and device for measuring visual similarity
  • Method and device for measuring visual similarity
  • Method and device for measuring visual similarity

Examples


Embodiment Construction

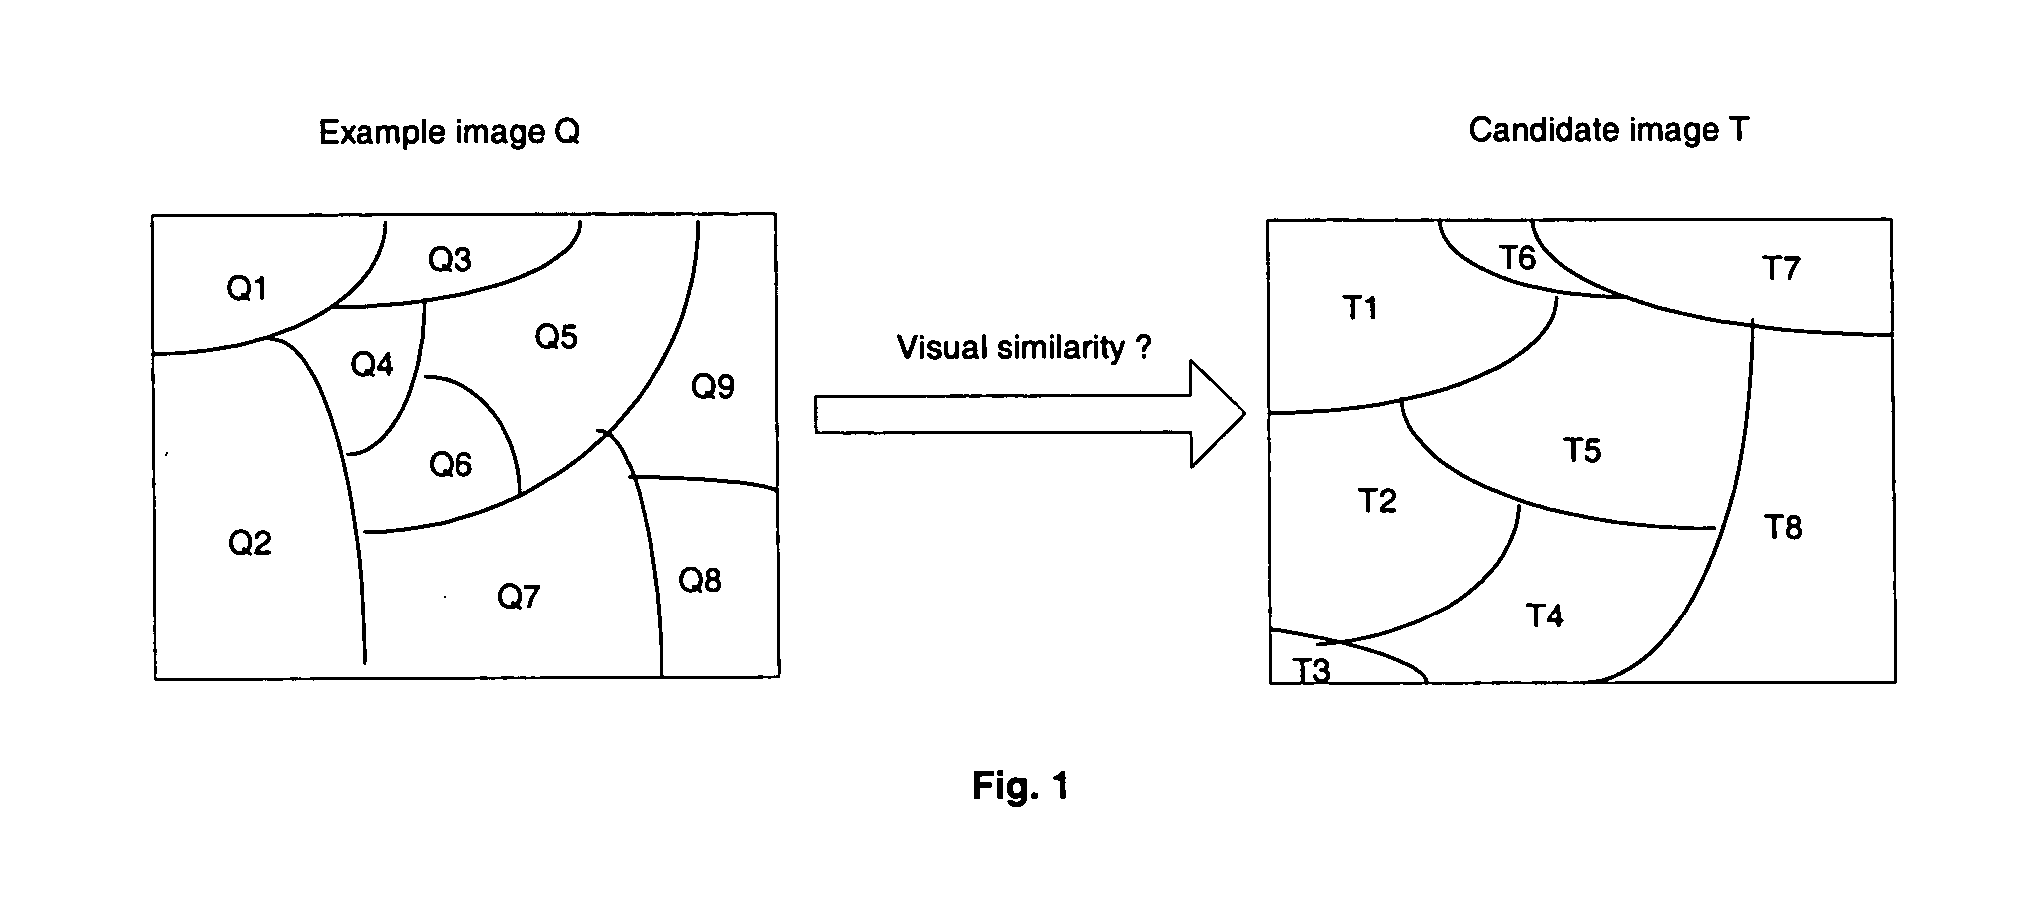
[0037]FIG. 1 represents an example of decomposing an image Q called the decomposed model image into Q regions Qi. The image Q represents the example image submitted to the device according to the invention and for which the device must return similar images.

[0038] The image Q is an image divided into regions of any shape as opposed to a division into a square grid. The division into regions Qi corresponds to a division according to objects, or according to subparts of these objects, represented on the image. These subparts are obtained via a segmentation algorithm commonly employed by the person skilled in the art.

[0039] The image T, called the target image, represents an image of a database comprising images whose visual similarity with the selected image Q is searched for. The images of the database such as T, are also decomposed into regions using the same method of segmentation as the image Q.

[0040] The image Q can be an image proposed by the user or an image itself emanating...


PUM


Abstract

A device and a method for measuring visual similarity between two images. One image (Q) being referred to as the model and one image (T) being referred to as the target, the method comprises a prior step (E2) of segmenting the images into regions (Qi, Ti), with each region there being associated at least one attribute (F) representative of at least one characteristic of the region. It furthermore comprises the steps of calculating (E3) the visual similarity between the pairs (Qi, Ti) of possible regions of the two images (Q, T), by taking into account the distance (D(Qi, Ti)) between the said attributes (F) of the regions (Qi, Ti) matched and the areas of the regions (Qi, Ti) matched; selecting (E4) a certain number of pairs (Qi, Ti) of regions whose similarity is greater than a first fixed threshold (ε), calculating (E9) the global similarity between the two images, based on the pairs (Qi, Ti) of regions selected.

Description

[0001] The invention relates to a device and a method for measuring visual similarity. BACKGROUND OF THE INVENTION [0002] The context of the invention is the content-based indexing of images and the searching via visual similarity of databases of still images. [0003] Traditionally, these databases were indexed manually via keywords. The accumulation of immense quantities of digital data, on account of the accelerated growth in communication throughputs and in the capacity of storage devices, has made it necessary to develop robust tools for automatically annotating images via their content. [0004] In a typical application of similarity-based searching, the user formulates his request with the aid of an example image and the system sends him back a list of images that are assumed to be visually much the same, and are ranked by increasing distances. The distance used is a distance between attributes extracted automatically from the images (that is why one speaks of indexing of images ...

Claims


Application Information

Patent Timeline
IPC IPC(8): G06T7/00G06F17/30G06K9/46G06K9/64G06K9/68
CPCG06F17/30247G06K2009/6213G06K9/6211G06F16/583G06V10/759G06V10/757G06V10/75
Inventor CHUPEAU, BERTRANDOISEL, LIONELLE CLERC, FRANCOIS
Owner THOMSON LICENSING SA
Learn More