
Statistically identifying an increased risk for disease

a statistical method and risk technology, applied in the field of life sciences, can solve the problems of poor prognosis of patients regardless of treatment, relatively expensive cancer screening tests, and inability to accurately detect cancer

Inactive Publication Date: 2005-01-27
INTERGENETICS +1
View PDF2 Cites 19 Cited by
  • Summary
  • Abstract
  • Description
  • Claims
  • Application Information

AI Technical Summary

Benefits of technology

Particular shortcomings of the prior art are reduced or eliminated by the techniques discussed in this disclosure. In an illustrative embodiment, statistical techniques are used to evaluate large amounts of genetic data to determine if one or more particular ge

Problems solved by technology

Conversely, if a patient's cancer has spread from its organ of origin to distant sites throughout the body, the patient's prognosis is very poor regardless of treatment.
The problem is that tumors that are small and confined usually do not cause symptoms.
As a result, cancer-screening tests are relatively expensive to administer in terms of the number of cancers detected per unit of healthcare expenditure.
A related problem in cancer screening is derived from the reality that no screening test is completely accurate.
Falsely positive cancer screening test results create needless healthcare costs because such results demand that patients receive follow-up examinations, frequently including biopsies, to confirm that a cancer is actually present.
For each falsely positive result, the costs of such follow-up examinations are typically many times the costs of the original cancer-screening test.
In addition, there are intangible or indirect costs associated with falsely positive screening test results derived from patient discomfort, anxiety and lost productivity.
Falsely negative results also have associated costs.
Obviously, a falsely negative result puts a patient at higher risk of dying of cancer by delaying treatment.
This, however, would add direct costs of screening and indirect costs from additional falsely positive results.
Furthermore, while both models are steps in the right direction, neither the Claus nor Gail models have the desired predictive power or discriminatory accuracy to truly optimize the delivery of breast cancer screening or chemopreventative therapies.
One possible way in which to stratify an individual's risk is to consider the individual's genetic traits along with other factors, although conventional techniques in this regard are not altogether satisfactory.
Alternatively, accuracy is more difficult to attain when trying to estimate the frequency of a rare event in the general population based upon a sample.
Problems arise when the event or state being examined is relatively rare in the cases and / or the controls.
This estimate is very uncertain and likely to be inaccurate because the estimates of j and k are inaccurate.

Method used


Image

  • Statistically identifying an increased risk for disease
  • Statistically identifying an increased risk for disease
  • Statistically identifying an increased risk for disease

Examples


second embodiment

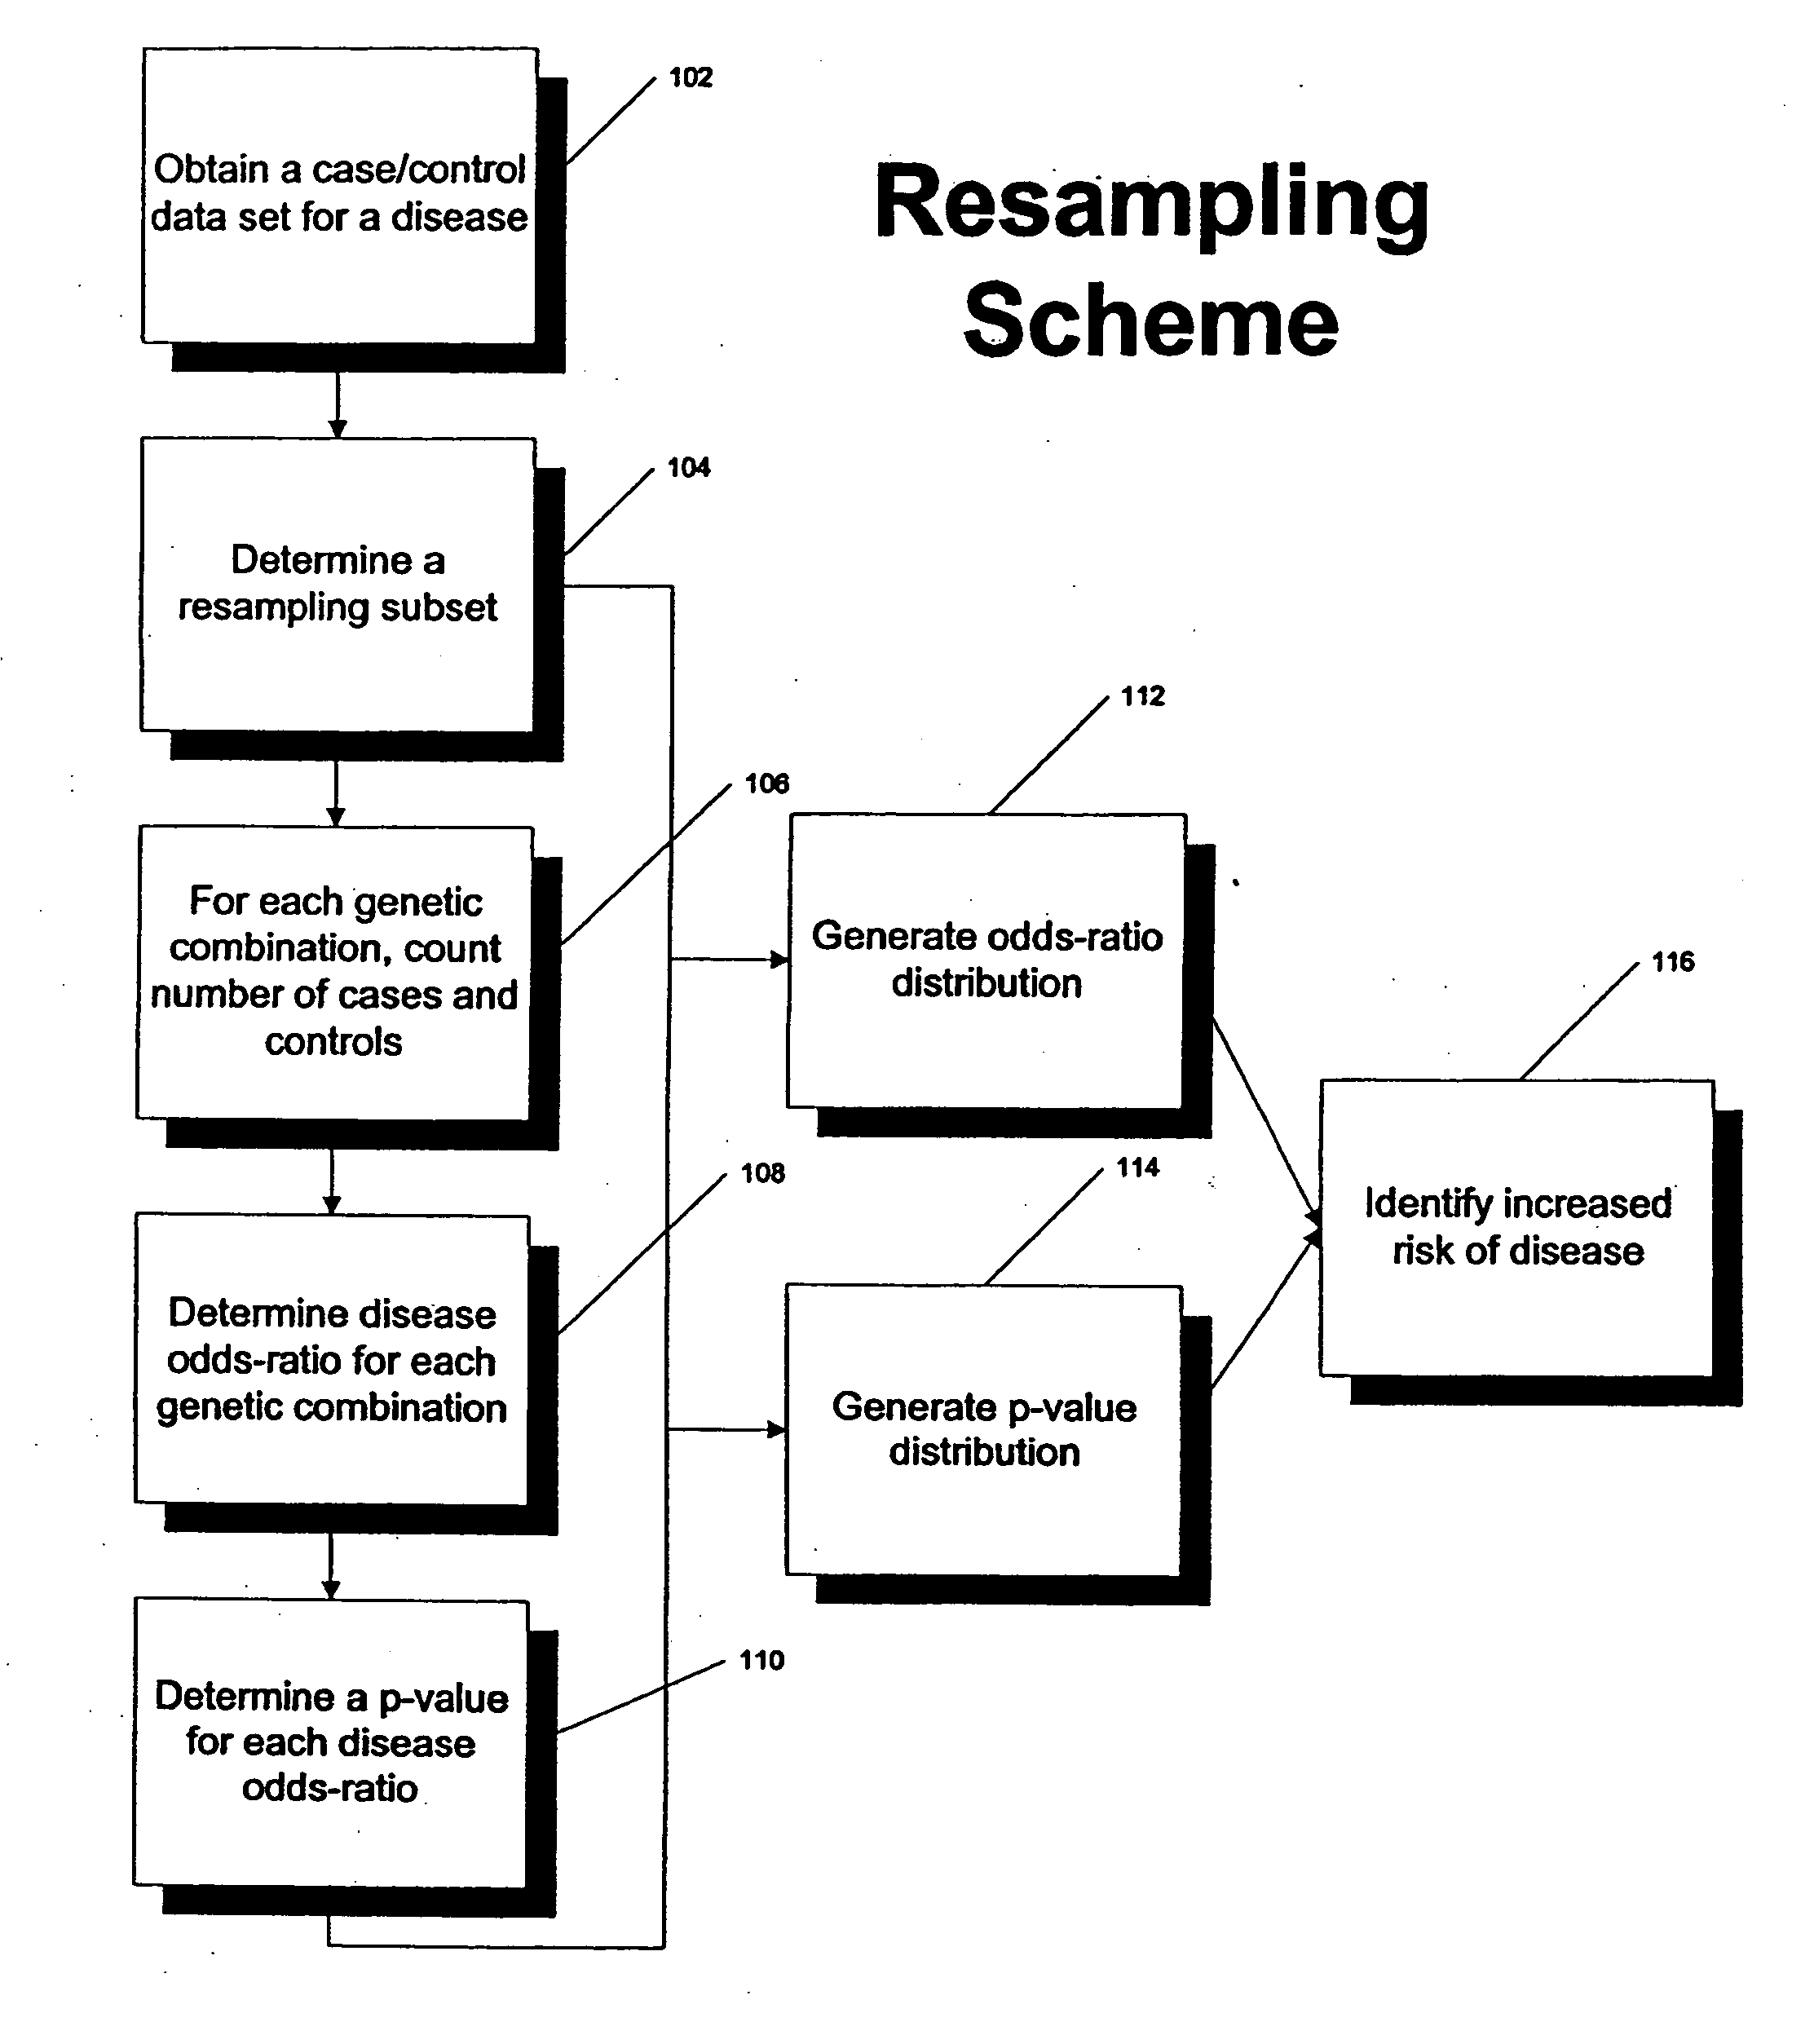
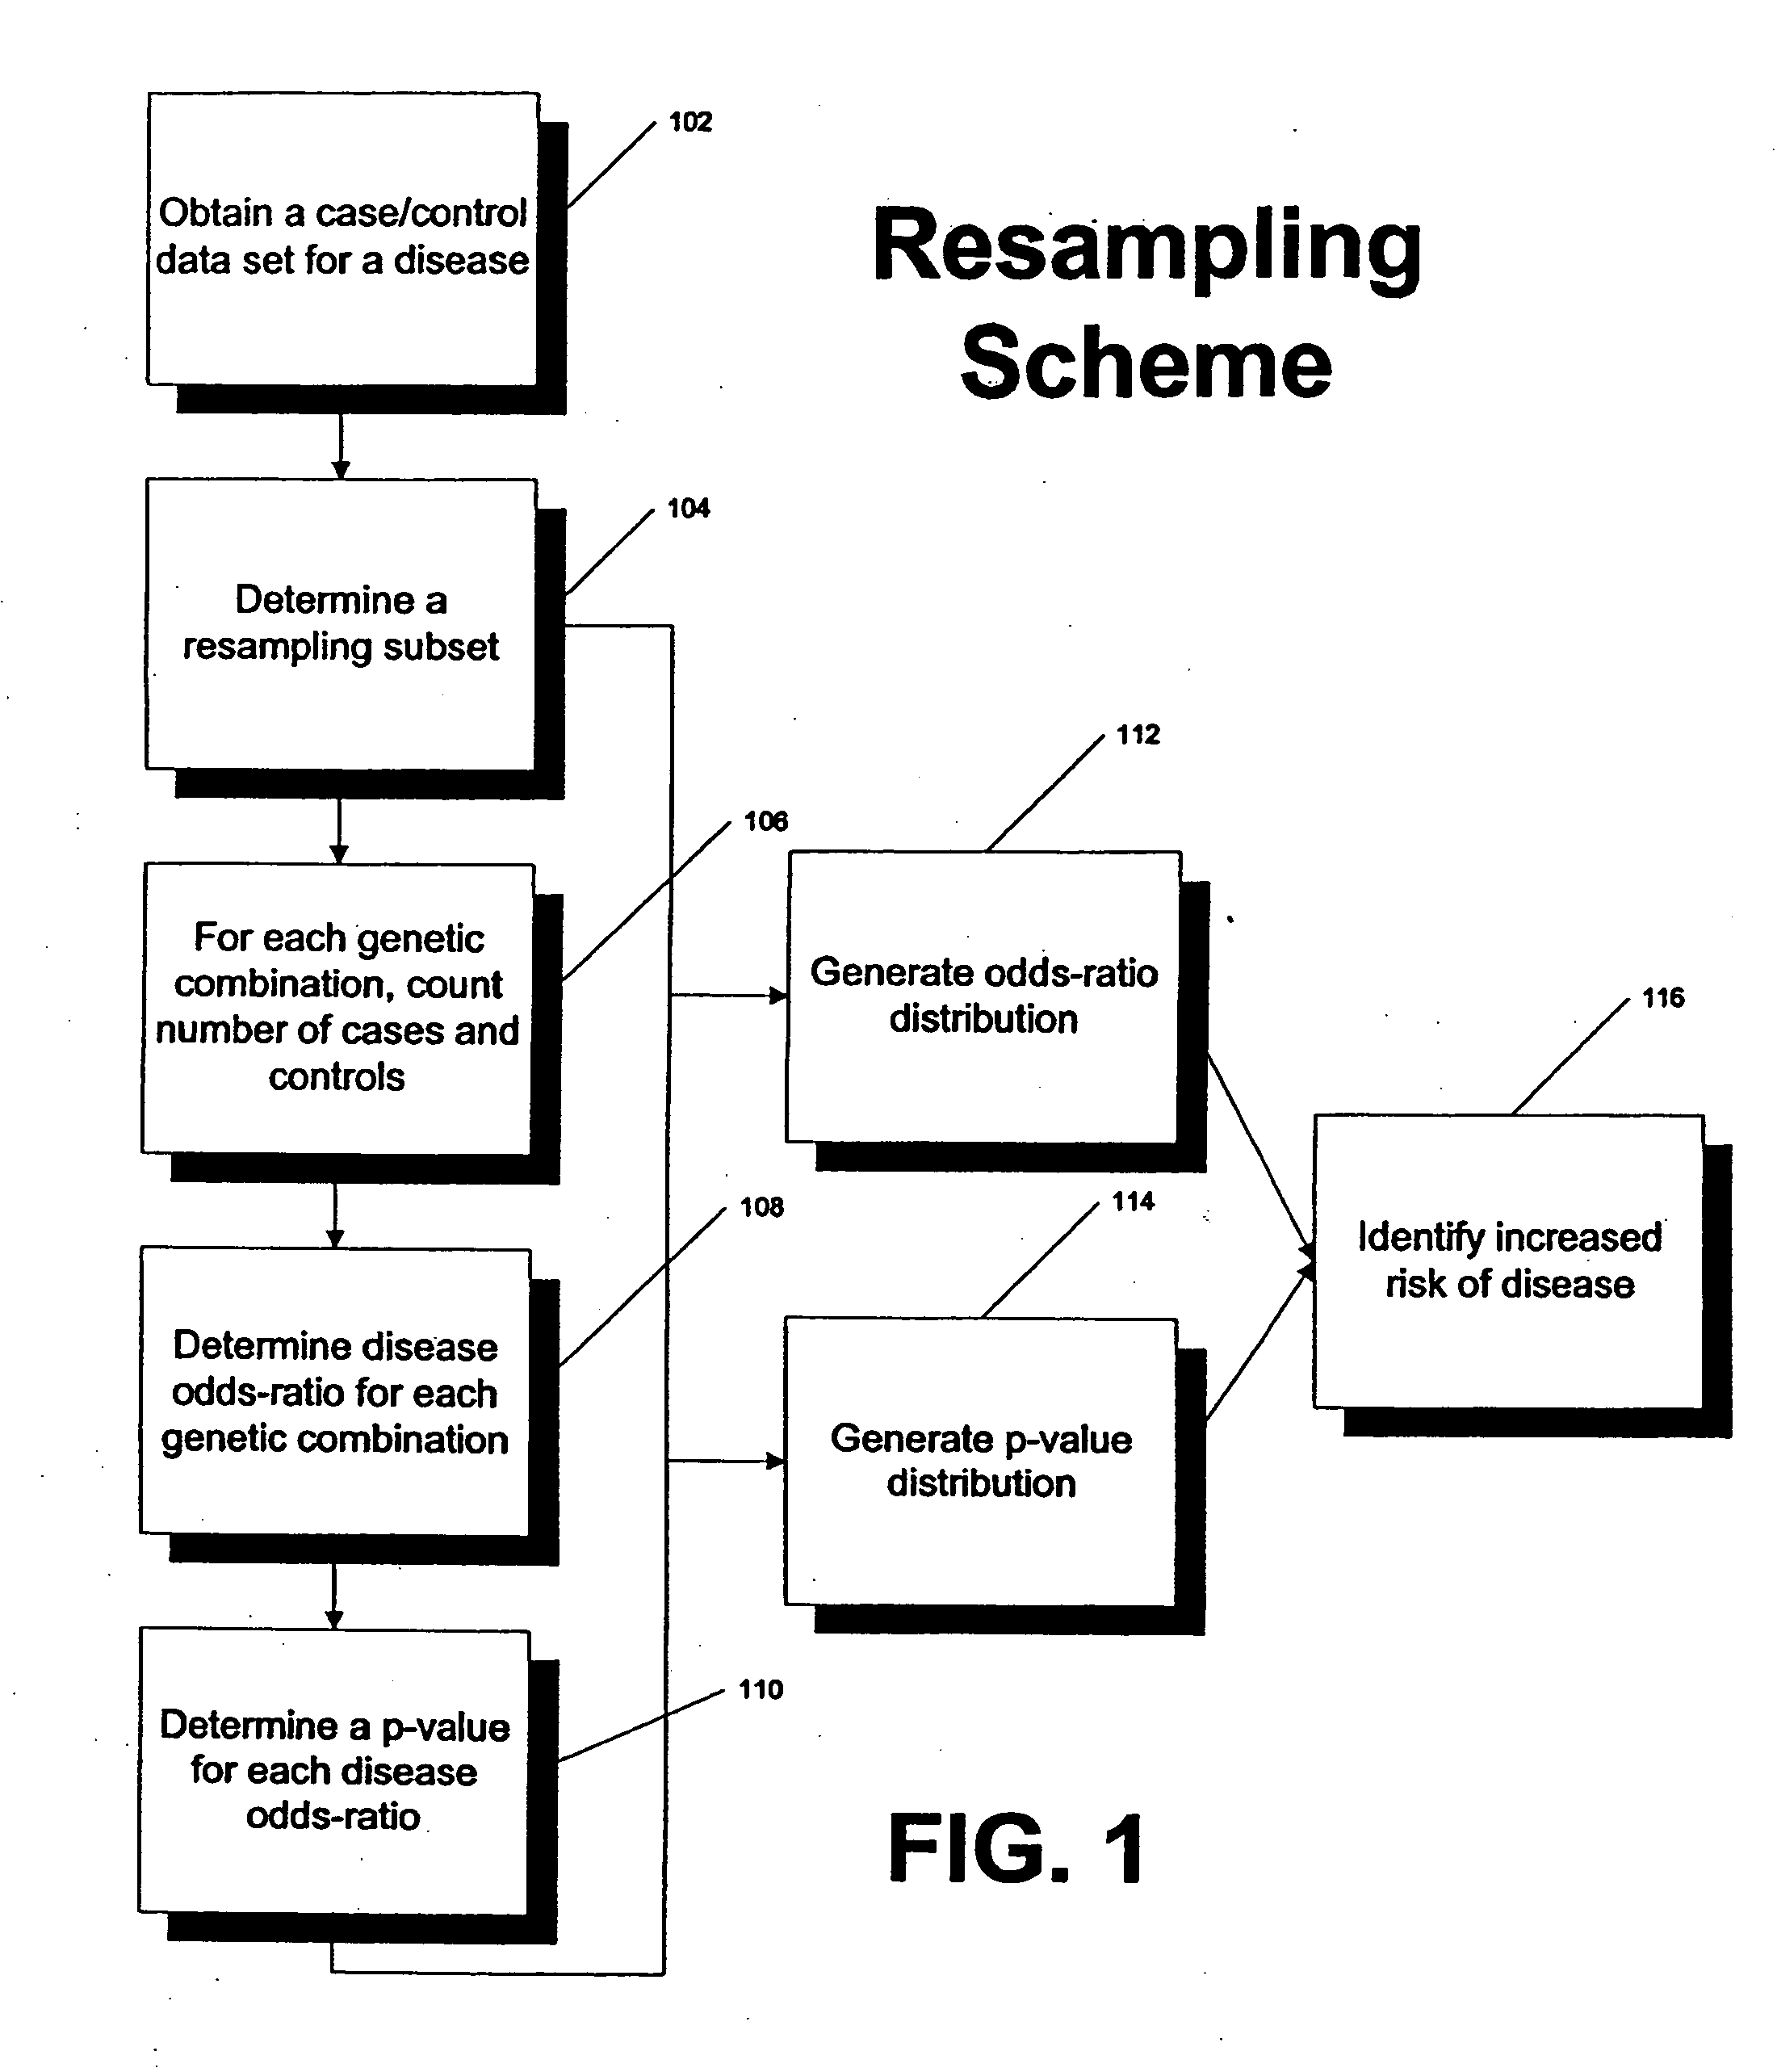
In a second embodiment, resampling of cases and controls is performed as described before. The allelic frequencies of all polymorphisms are then determined for the resampled dataset for the controls. Hardy-Weinberg modeling is then used to determine the predicted genotype frequencies for the one, two, three or more (as desired) combinations of genes in the controls for the resampled data. The predicted genotype frequencies are then used in comparisons with the observed genotype frequencies in the resampled cases. Odds ratios, p-values and other desired statistics are calculated as described before except that the Hardy-Weinberg modeled genotype frequencies are substituted for observed genotype frequencies in the controls. In this embodiment, the Hard-Weinberg modeling is repeated with each round of resampling.

An essence of the Hardy-Weinberg modeled predictions of genotype frequencies is that they are a more accurate estimate of the true frequencies of relatively rare genotypes in ...

example 1

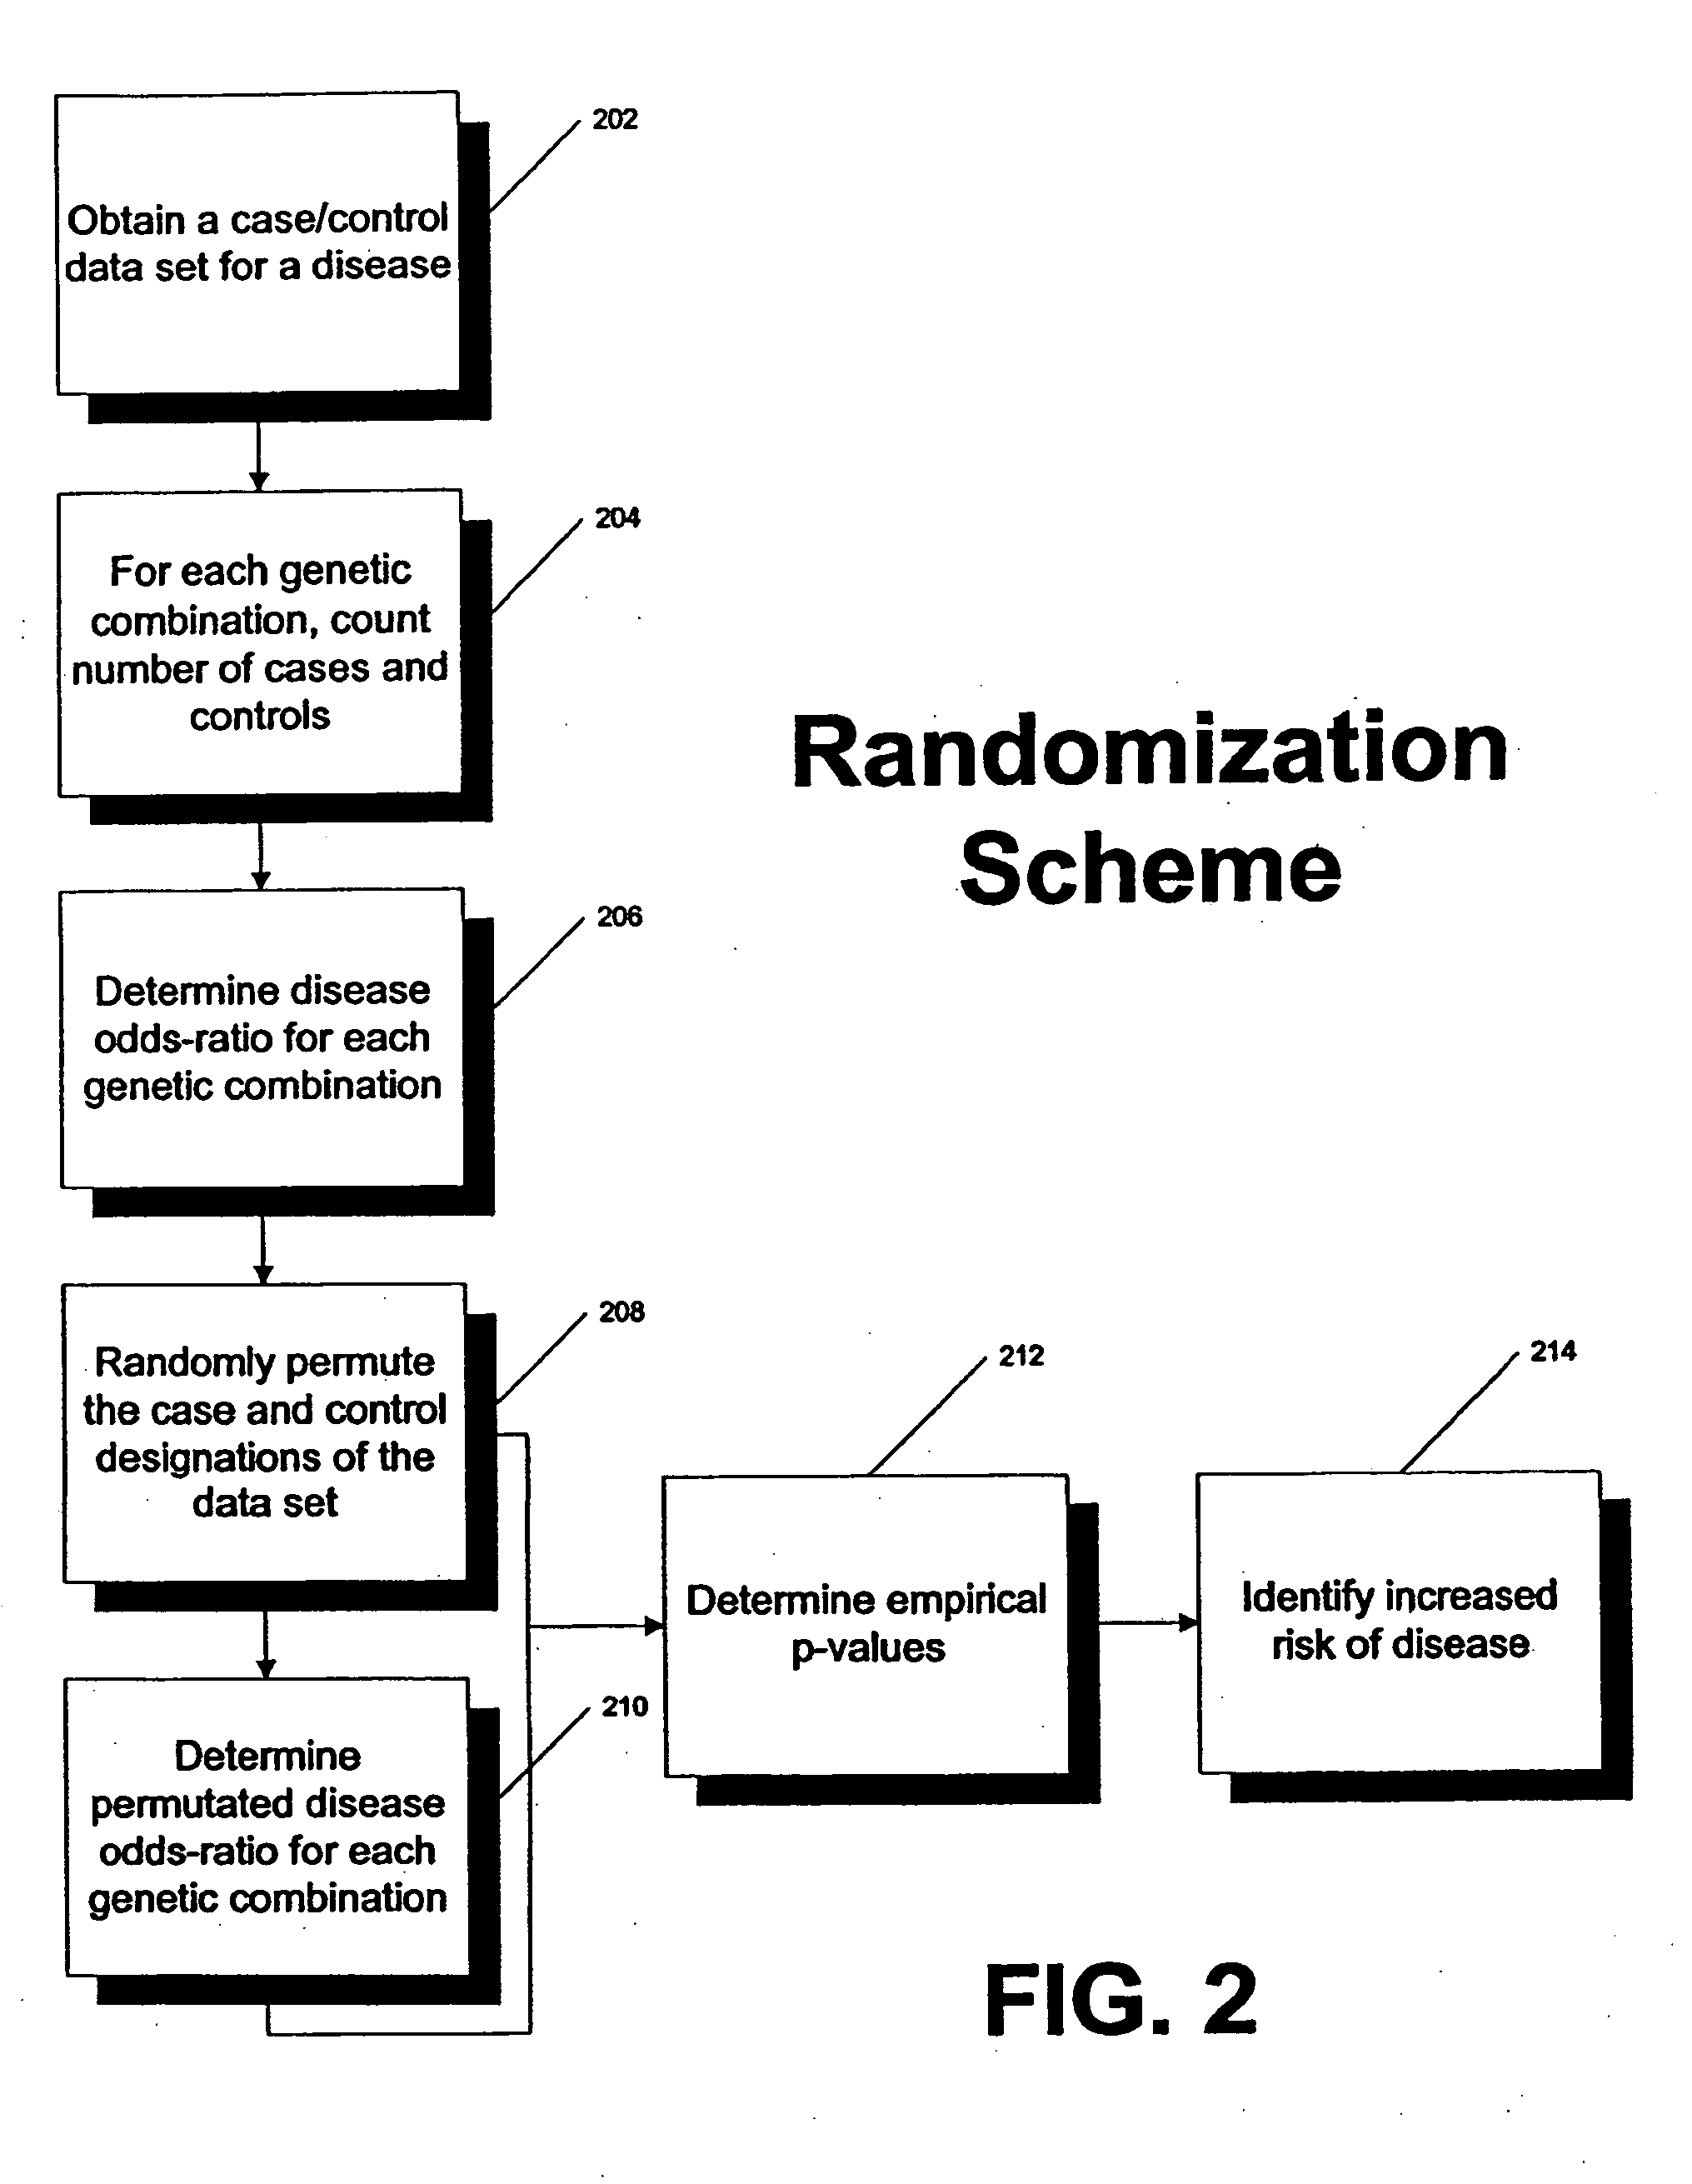
Techniques of this disclosure provide data analysis strategies to identify combinations of genetic polymorphisms and personal history measures that are associated with varying degrees of risk for developing breast cancer. These strategies are broadly applicable to many similar problems involving the interactions of many genes and many environmental factors in determining risk of developing complex diseases. Risk of developing other types of cancer, heart disease and diabetes may be considered. Additionally, one may use the techniques to predict the efficacies of various medical treatments. In short, these are methods to quantitatively dissect the complex, multifactoral interactions between genes and environmental factors to predict outcomes in medical or biological systems.

At least three main embodiments typify this disclosure:

1. Resampling of data.

2. Generating a null hypothesis for genetic association by randomly assigning data from cases and controls into sets of pseudo-ca...

example 2

The Intergenetics Breast Cancer Cohort is designed as a classic case-control study: ˜1000 cases, ˜4000 controls. The main tool for the analysis is the odds-ratio statistic, which approximates the relative risk, i.e., the increased risk for developing breast cancer among people in the exposed group compared to those who are not (or compared to the average risk in the general population). Exposure in this example is carrying a particular combination of alleles at a set of genes.

The genes being considered typically have two alleles, termed A and B for convenience. With consideration of possible patterns of dominance, this leads to five genotype classes per gene. For a combination of two genes there are then 5×5=25 genotype combinations to consider, 125 for combinations of three genes. Therefore, with a set of twenty genes from which to select three at a time (1140 selections) there are 142,500 three gene combinations to be considered.

A goal of this example is to provide software t...


PUM


Abstract

Methods and computer readable media for statistically identifying an increased risk for disease. In one embodiment, resampling techniques are utilized to consider different genotype combinations within a resampling subset of a case / control data set. Odds-ratios and theoretical p-values are calculated for each genotype combination so that an increased risk of disease associated with a particular genotype combination may be identified. In another embodiment, different genotype combinations within a case / control data set are considered. Odds ratios are calculated for each genotype combination. Empirical p-values are calculated for the odds ratios through randomization techniques. Using the odds-ratios and / or empirical p-values, an increased risk for disease associated with a particular genotype combination may be identified.

Description

REFERENCE TO APPENDIX This application includes a computer program listing appendix, submitted on compact disc (CD). The content of the CD is incorporated by reference in its entirety and forms a part of this specification. The content of the CD was included within the specification of U.S. Provisional Patent Application Ser. No. 60 / 447,600. The CD contains the following file: File nameFile sizeCreation date for CDSOURCE.txt40 kbFeb. 13, 2004BACKGROUND OF THE INVENTION 1. Field of the Invention The present invention relates generally to statistical methods finding application in the life sciences. More particularly, the present invention relates to bioinformatic techniques to statistically identify an increased risk for disease, such as but not limited to, breast cancer associated with one or more particular genotype combinations or other exposure factors. 2. Background For patients with cancer, early diagnosis and treatment are the keys to better outcomes. In 2001, there are ...

Claims


Application Information

Patent Timeline
IPC IPC(8): G16B20/00G01N33/48G06FG16B20/20G16B40/00
CPCG06F19/24G06F19/18G16B20/00G16B40/00G16B20/20
Inventor ASTON, CHRISTOPHERRALPH, DAVID
Owner INTERGENETICS
Learn More