Method for determining similarities between data sequences using cross-correlation matrices and deformation functions

a technology of cross-correlation matrix and deformation function, applied in the field of comparing finite data sequences, can solve the problems of large distances, failure of conventional distance metrics, and inability to determine a distance metric between sequences

Inactive Publication Date: 2005-05-12
MITSUBISHI ELECTRIC RES LAB INC
View PDF0 Cites 57 Cited by
  • Summary
  • Abstract
  • Description
  • Claims
  • Application Information

AI Technical Summary

Benefits of technology

[0012] Unlike prior art radiometric calibration methods, the method according to the invention does not require special, uniformly illuminated color charts, does not determine individual radiometric responses, does not depend on additional shape assumptions of the brightness transfer functions, and does not involve exposure control.

Problems solved by technology

However, if the sequences have shape deformations, non-linear shifts, scaling, and phase shifts, then conventional distance metrics often fail.
Furthermore, there is no method that can concurrently determine a distance metric between sequences, while aligning the sequences.
A major drawback of prior art ‘bin-by-bin’ distance measures, e.g., Minkowski, Intersection, Lorentzian, Chi, Bhattacharyya, etc., is that they account only for correspondences between bins with the same index.
For example, a shift of a bin index can result in larger distances, although the two sequences otherwise match, wielding erroneous results.
This causes the metrics to completely miss any similarity.
Although cross-bin matching is possible for EMD, the Hausdorff, and the quadratic form distance, those methods do not have any mechanism to preserve the ordering of the sequences.
Obviously, changing the order of the sequences can significantly deteriorate the accuracy of the distance when the similarity of the sequences is already marginal.

Method used


Image

  • Method for determining similarities between data sequences using cross-correlation matrices and deformation functions
  • Method for determining similarities between data sequences using cross-correlation matrices and deformation functions
  • Method for determining similarities between data sequences using cross-correlation matrices and deformation functions

Examples


Embodiment Construction

[0026] Data Sequences

[0027] A finite-length data sequence, h, is a vector [h[0], . . . , h[M]] of data values. Each ‘bin’ h[m] has the value of the vector at an index number m. The data sequence can represent various types of physical phenomena. In the case where the sequence h represents a color histogram of an image, the bin h[m] contains the number of pixels corresponding to a color range of m in the image, where M is the total number of the bins.

[0028] In this example, the sequence represents the pixel colors as a set of positive real numbers +. The widths of the bins can be made the same when the sampling frequency along the indexing axis is constant mi−mi−1=mj−mj−1 for every i and j. The sequence is normalized such that Σm=0mh[m]=1.

[0029] Although a color image is used as an example data sequence for the purpose of this description, the invention can be worked with other finite length data sequences that conform to the above definition, for example audio signals, radio sign...


PUM

PropertyMeasurementUnit
distancesaaaaaaaaaa
color histogramaaaaaaaaaa
lengthsaaaaaaaaaa

Abstract

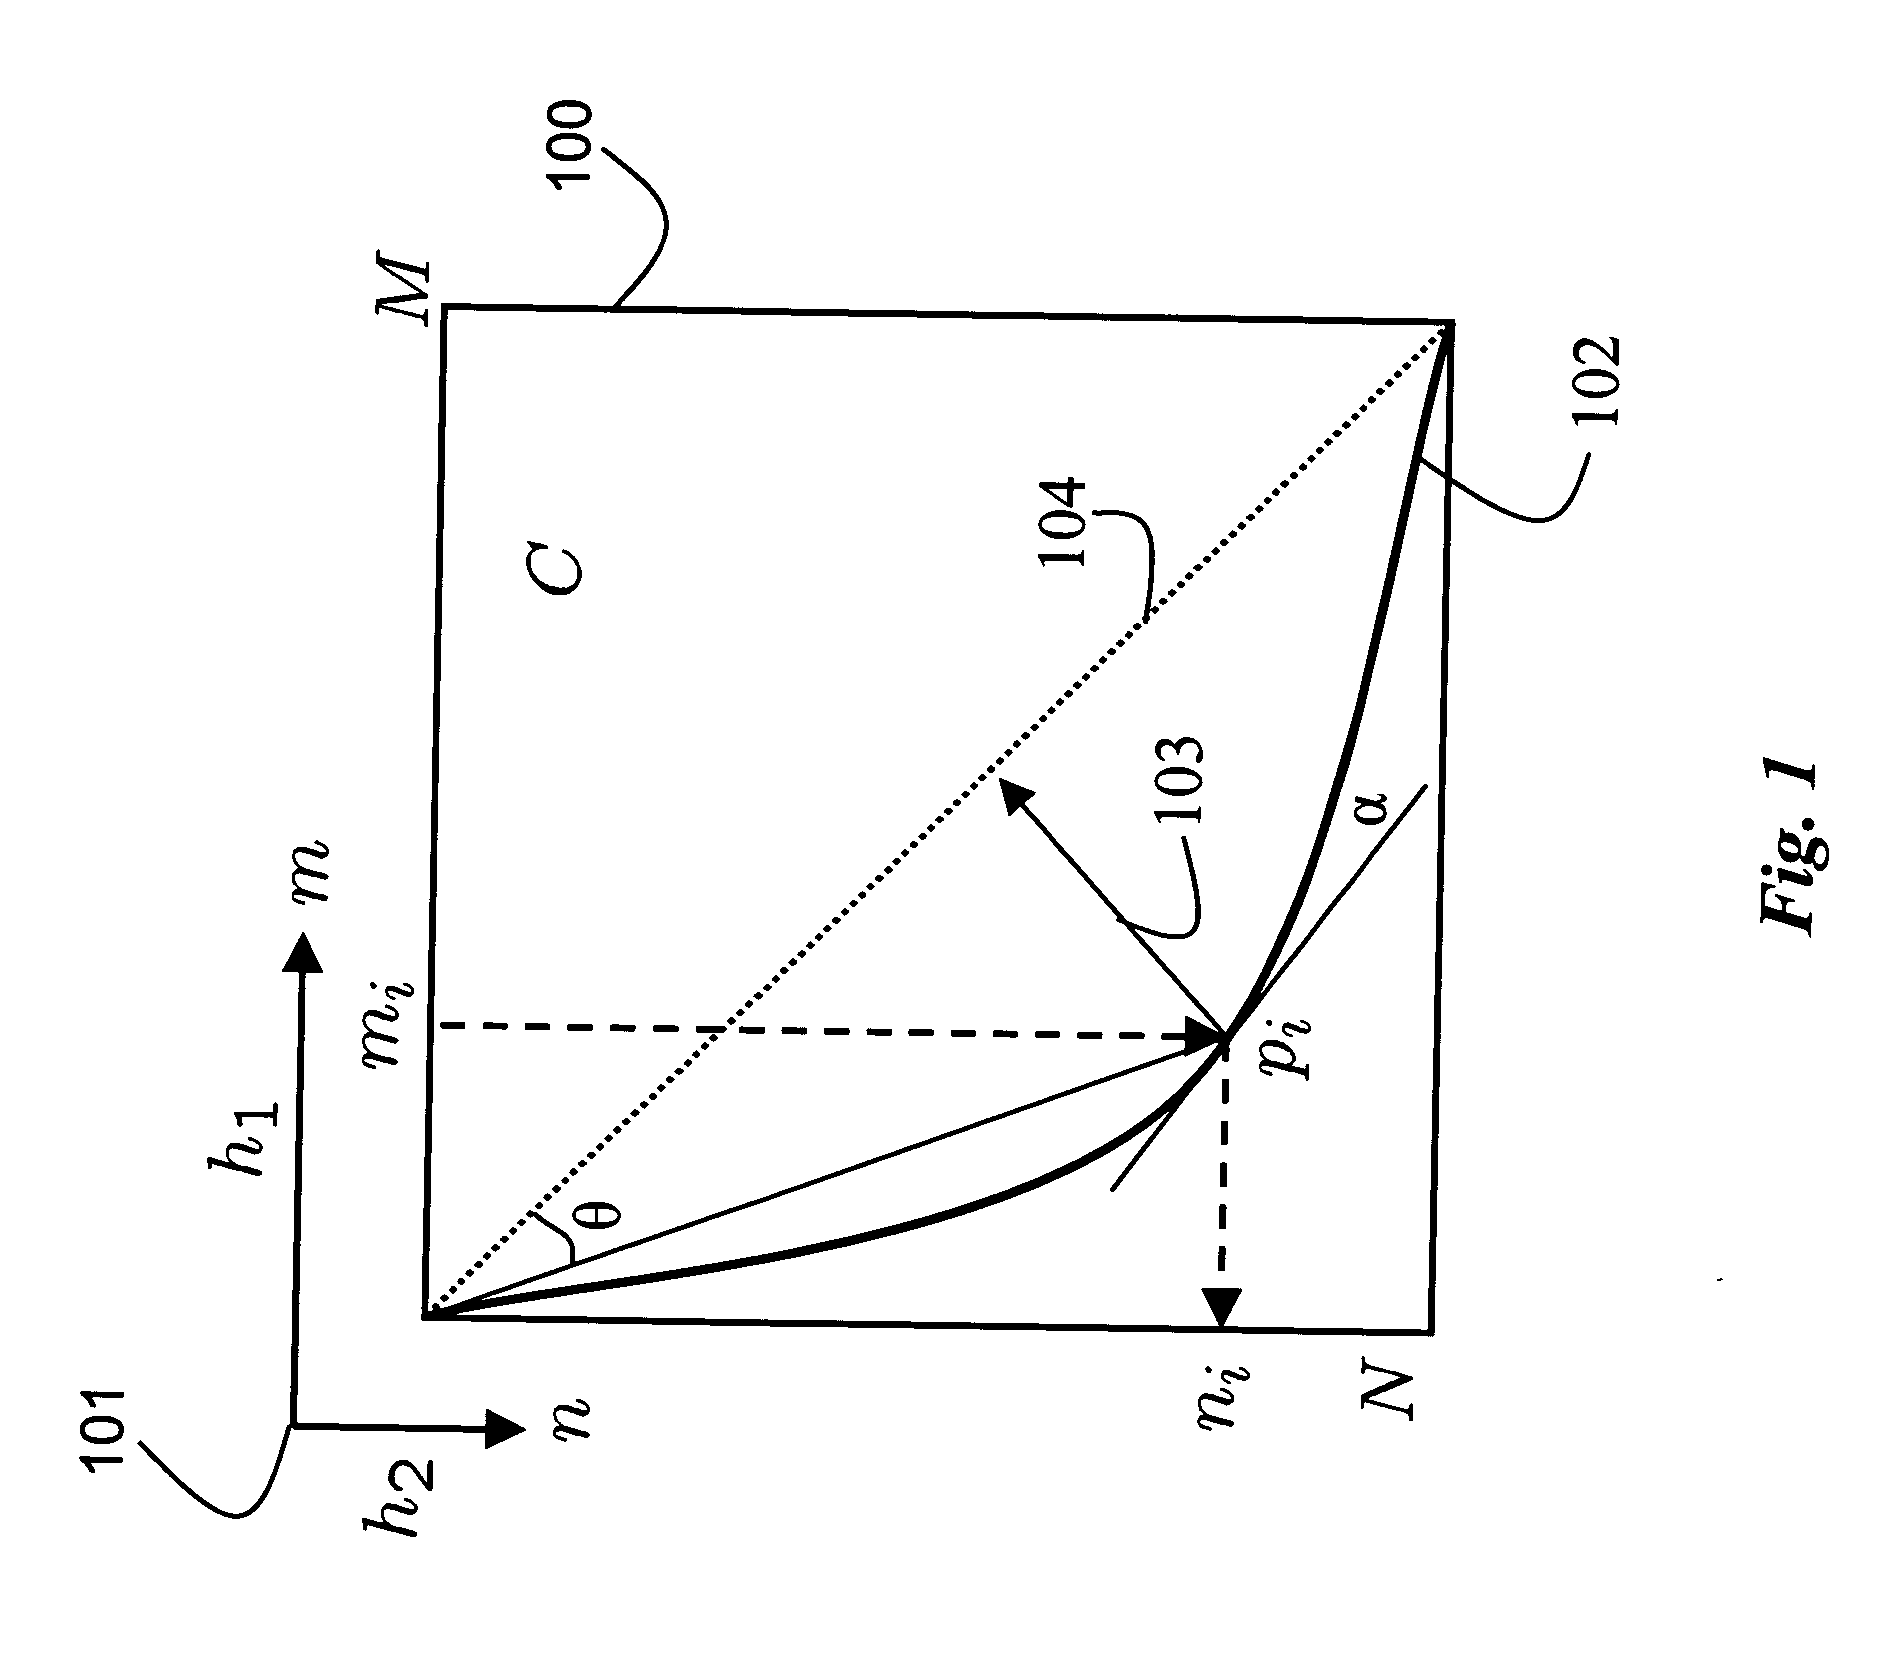
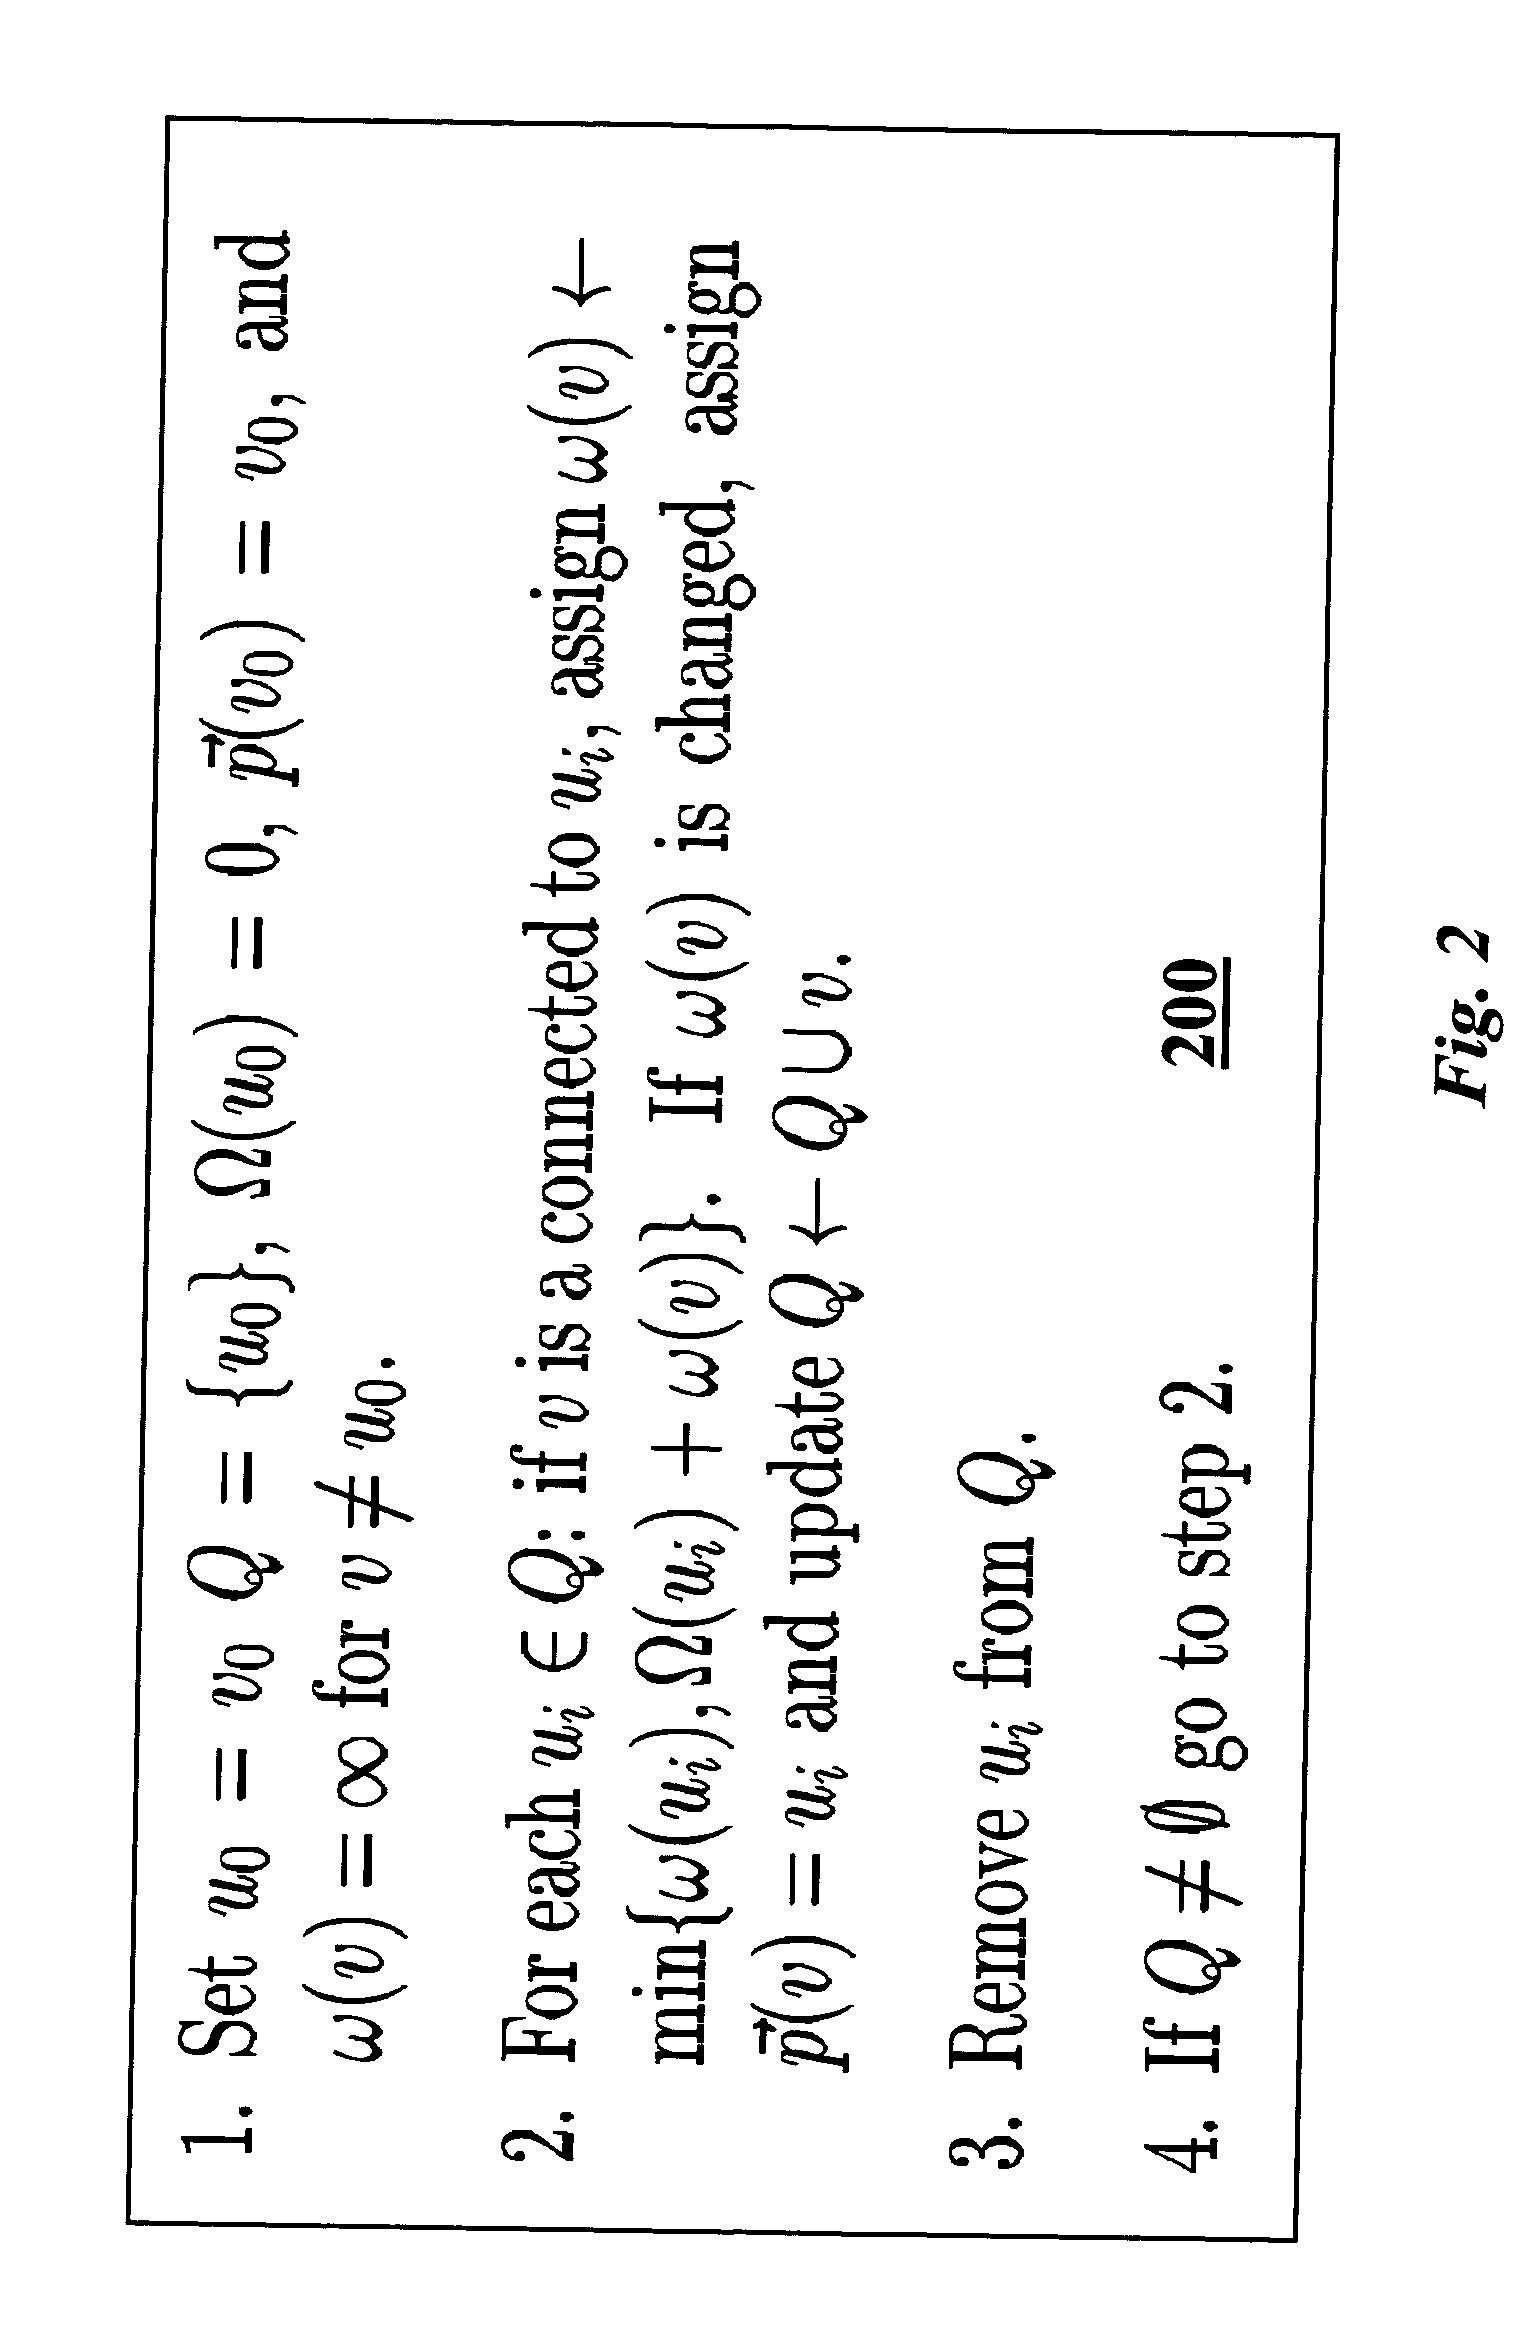
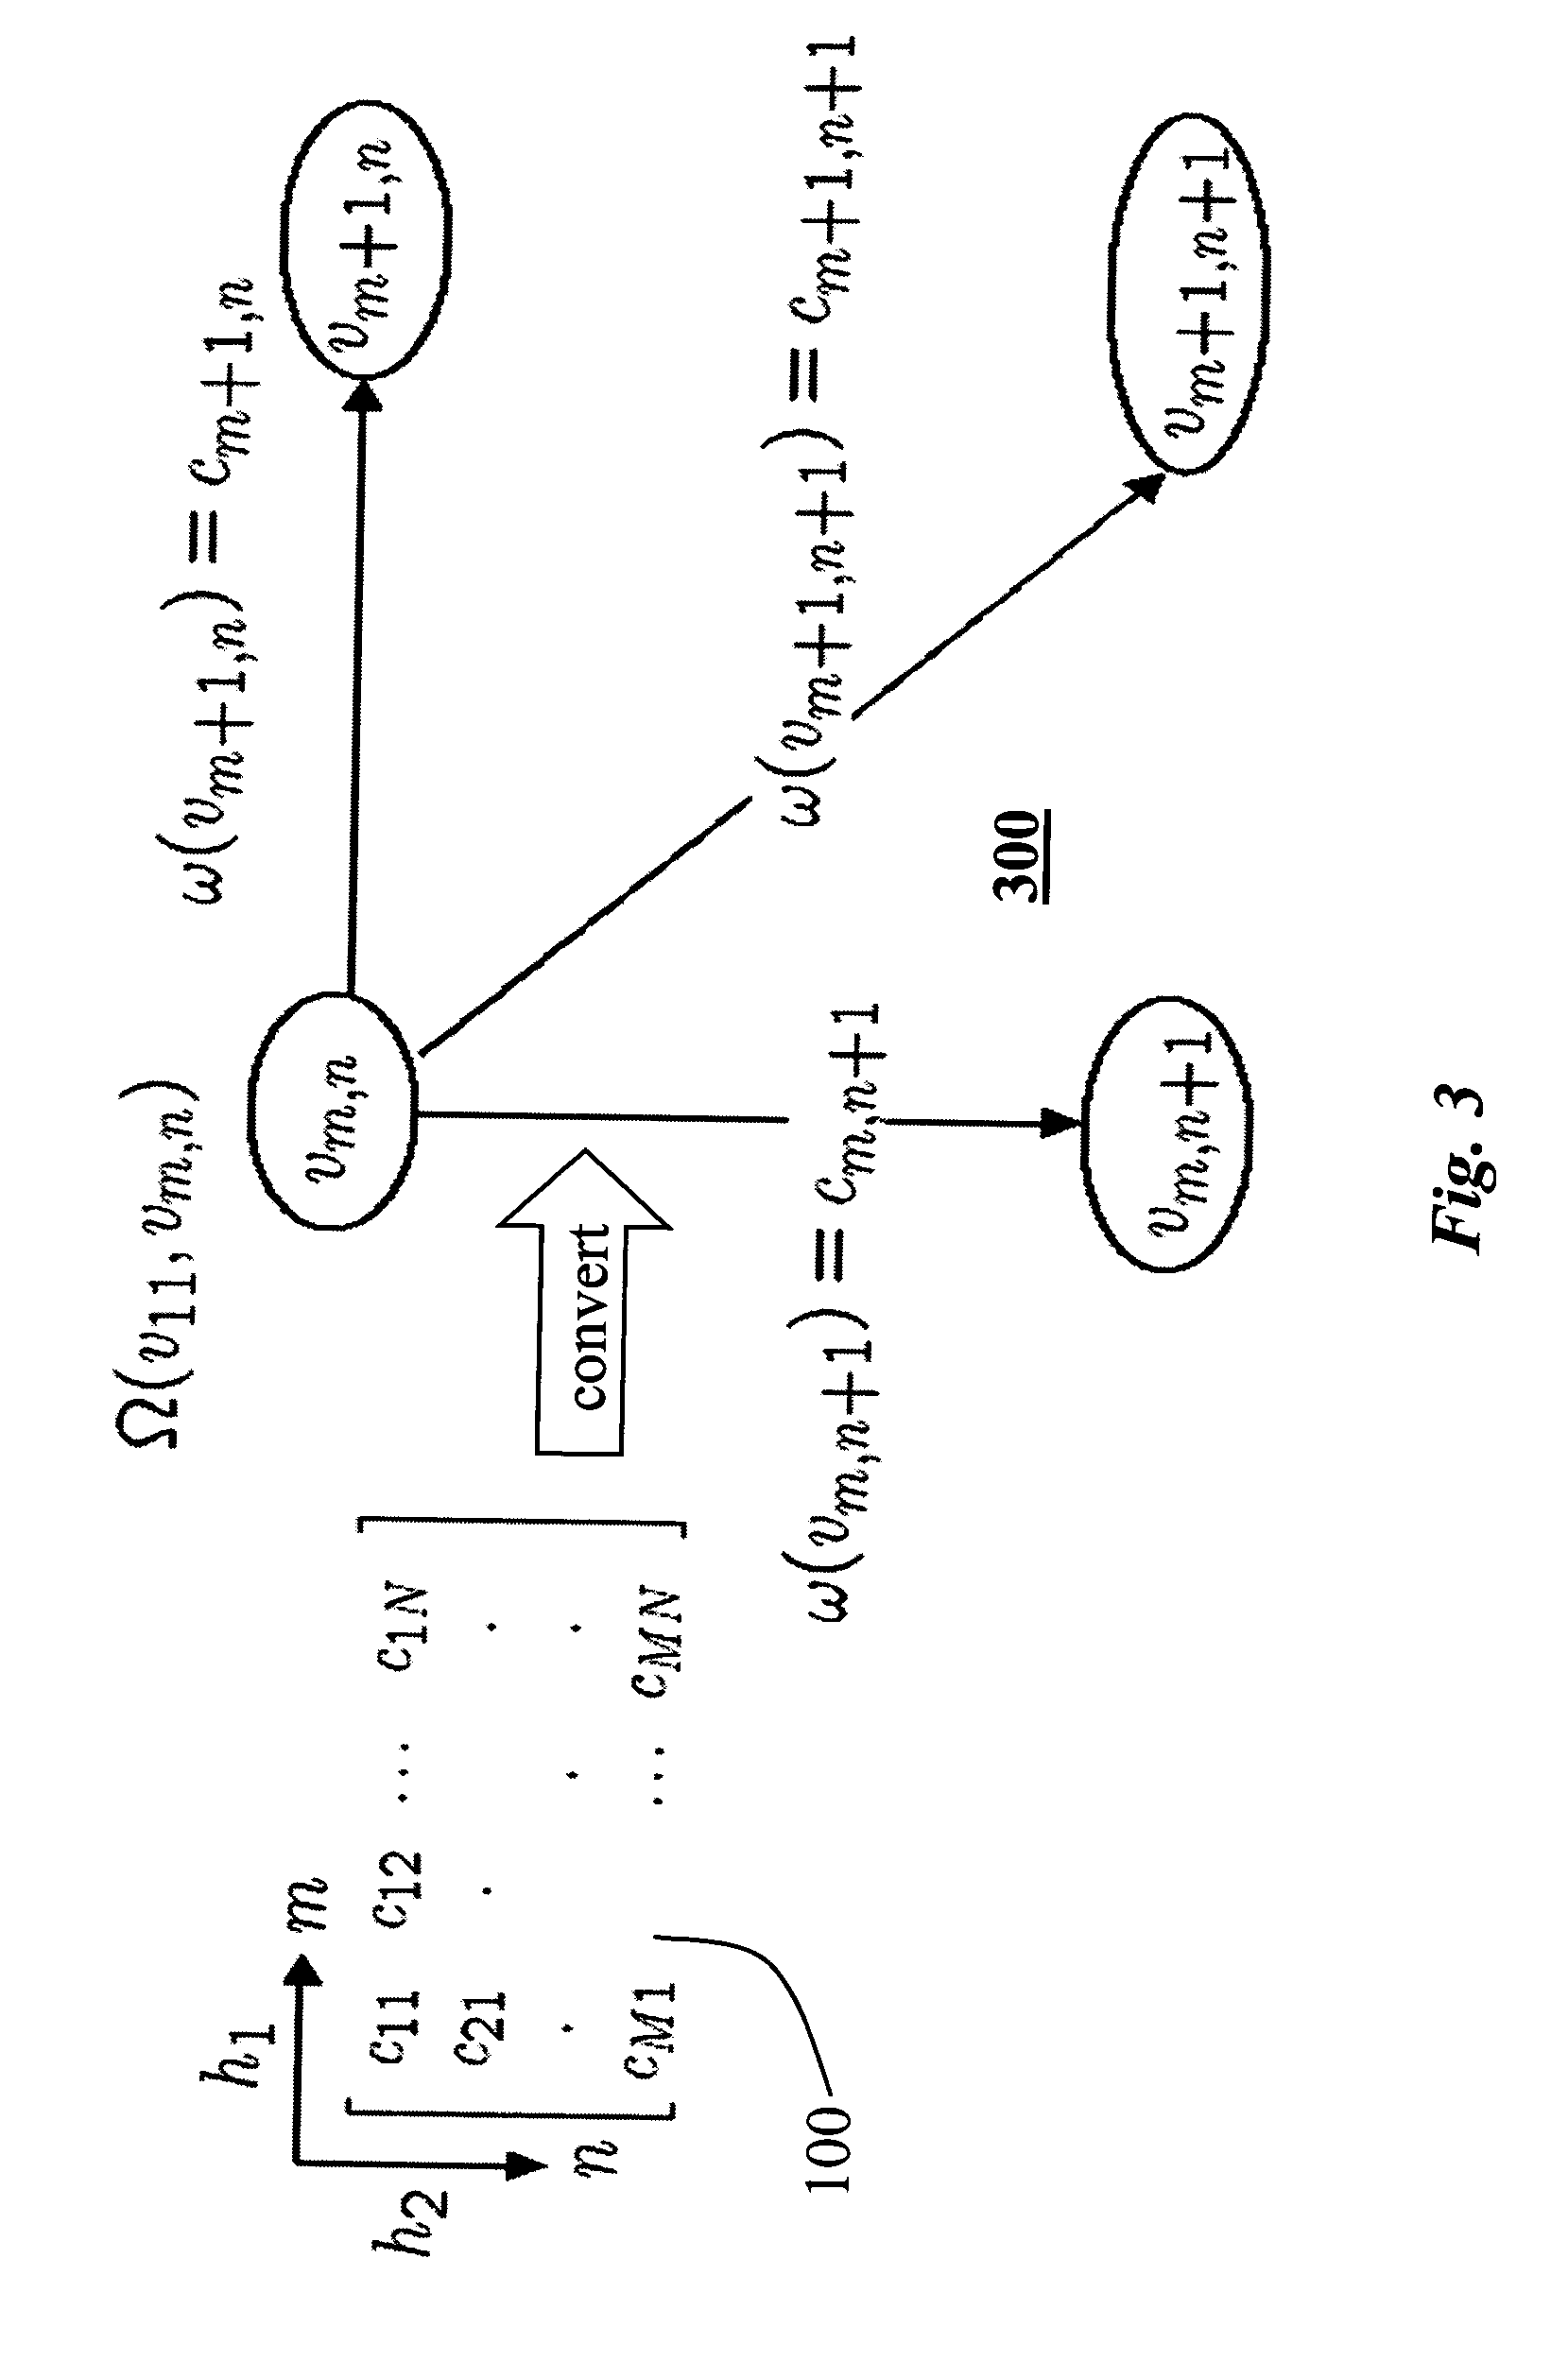
A method compares a first data sequence with a second data sequence. A cross-correlation matrix of distances between all possible pairs of values of the first and second data sequences is constructed. A minimum cost path between diagonally opposing corners of the cross-correlation matrix is determined. The minimum cost path is projected onto a transfer function that maps between the first data sequence and the second data sequence. Then, the minimum cost path is projected onto a deformation function that corresponds to a similarity between the first data sequence and the second data sequence.

Description

FIELD OF THE INVENTION [0001] This invention relates generally to comparing finite data sequences, and more particularly to measuring a similarity between data sequences. BACKGROUND OF THE INVENTION [0002] Temporal data sequences and spatial-temporal data sequences constitute a large portion of information stored in databases. Many applications need to measure similarity between data sequences instead of exact matches. A common way to analyze two time series signals or data sequences is to measure ‘distances’ between the two sequences. If the distance is zero, then the sequences are identical, and if the distance is less than a predetermined threshold, the sequences are considered similar. [0003] Such analysis can be used in applications such as image retrieval, DNA pattern recognition, economic growth patterns, price and stock trends, weather and astrophysics patterns, and geological feature identification. For example, an image can be represented as a color histogram, which is a d...

Claims


Application Information

Patent Timeline
Patent Type & Authority Applications(United States)
IPC IPC(8): G01N33/48G01N33/50G06F19/00G06K9/62G06K9/64
CPCG06K9/6215G06K9/6212G06V10/758G06F18/22
Inventor PORIKLI, FATIH M.
Owner MITSUBISHI ELECTRIC RES LAB INC
Why Eureka
Try Eureka