Supercharge Your Innovation With Domain-Expert AI Agents!

Distributed internet user experience monitoring system

a technology of user experience and monitoring system, applied in the field of distributed internet user experience monitoring system, can solve the problems of low sales figures, negative experiences of users, and difficulty for potential customers in san francisco to access the bookstor

Inactive Publication Date: 2005-05-19
ZHIGU HLDG
View PDF7 Cites 16 Cited by
  • Summary
  • Abstract
  • Description
  • Claims
  • Application Information

AI Technical Summary

Benefits of technology

"The invention is a method that uses a system of computers connected to the internet to measure the quality of their connection to a specific website. These computers act like regular users, accessing the website in the same way as they would if they were at their own computer. The data collected from these computers is then sent to a central server for analysis. This allows for a more accurate measure of the user experience when accessing the website. The method uses a distributed push scheme, where the computers first get instructions from the server and then access the website to gather data. This data is then pushed back to the server for analysis. Overall, the invention provides a way to measure the quality of internet connections and improve the user experience."

Problems solved by technology

Users may have negative experiences when connecting to a web site using particular ISPs or local dial-up connections.
These negative experiences can result in low sales figures in some areas.
For example, potential customers in San Francisco may have difficulty accessing bookstore 110 due to local Internet infrastructure limitations.
Companies that advertise on the Internet therefore spend large sums of money trying to determine whether customers and potential customers in various parts of the world can easily access, explore, and interact with company web sites.
Second, the software used to access the target site is different than the commercially available browser software used by typical users.
Moreover, the systems of FIGS. 2 and 3 do not measure some performance characteristics that are useful in assessing user experience; for example, neither system measures the time required for a user to download a given web page.

Method used


Image

  • Distributed internet user experience monitoring system
  • Distributed internet user experience monitoring system
  • Distributed internet user experience monitoring system

Examples


Embodiment Construction

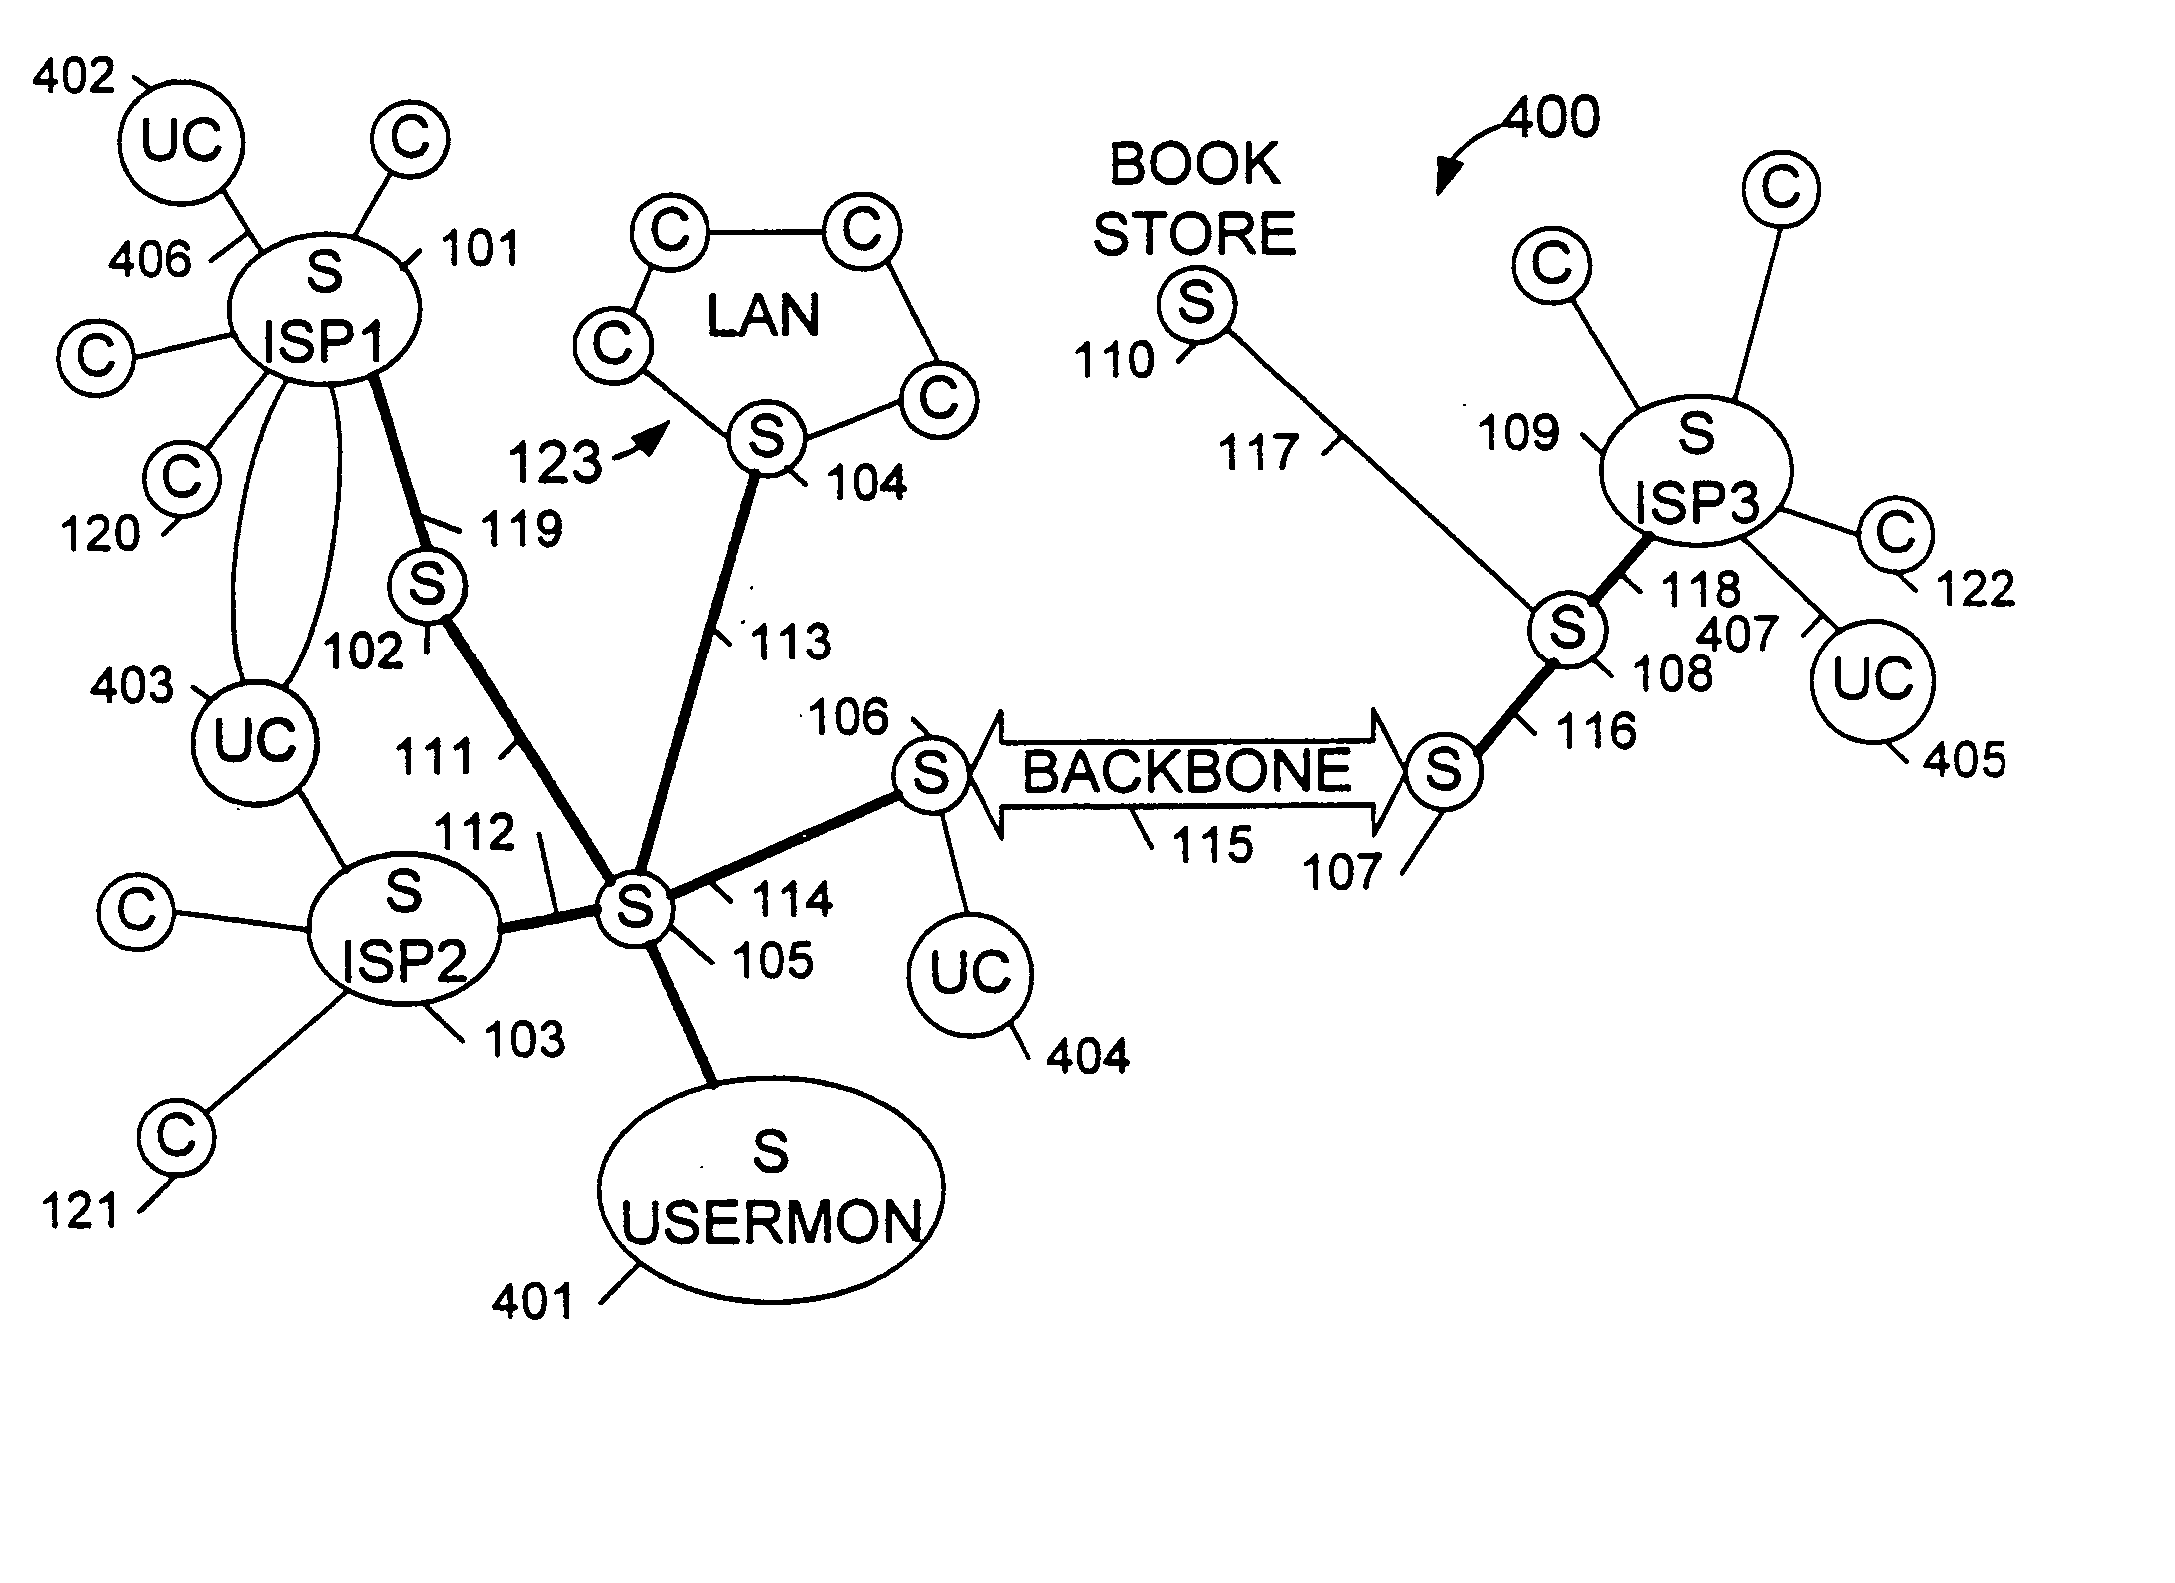
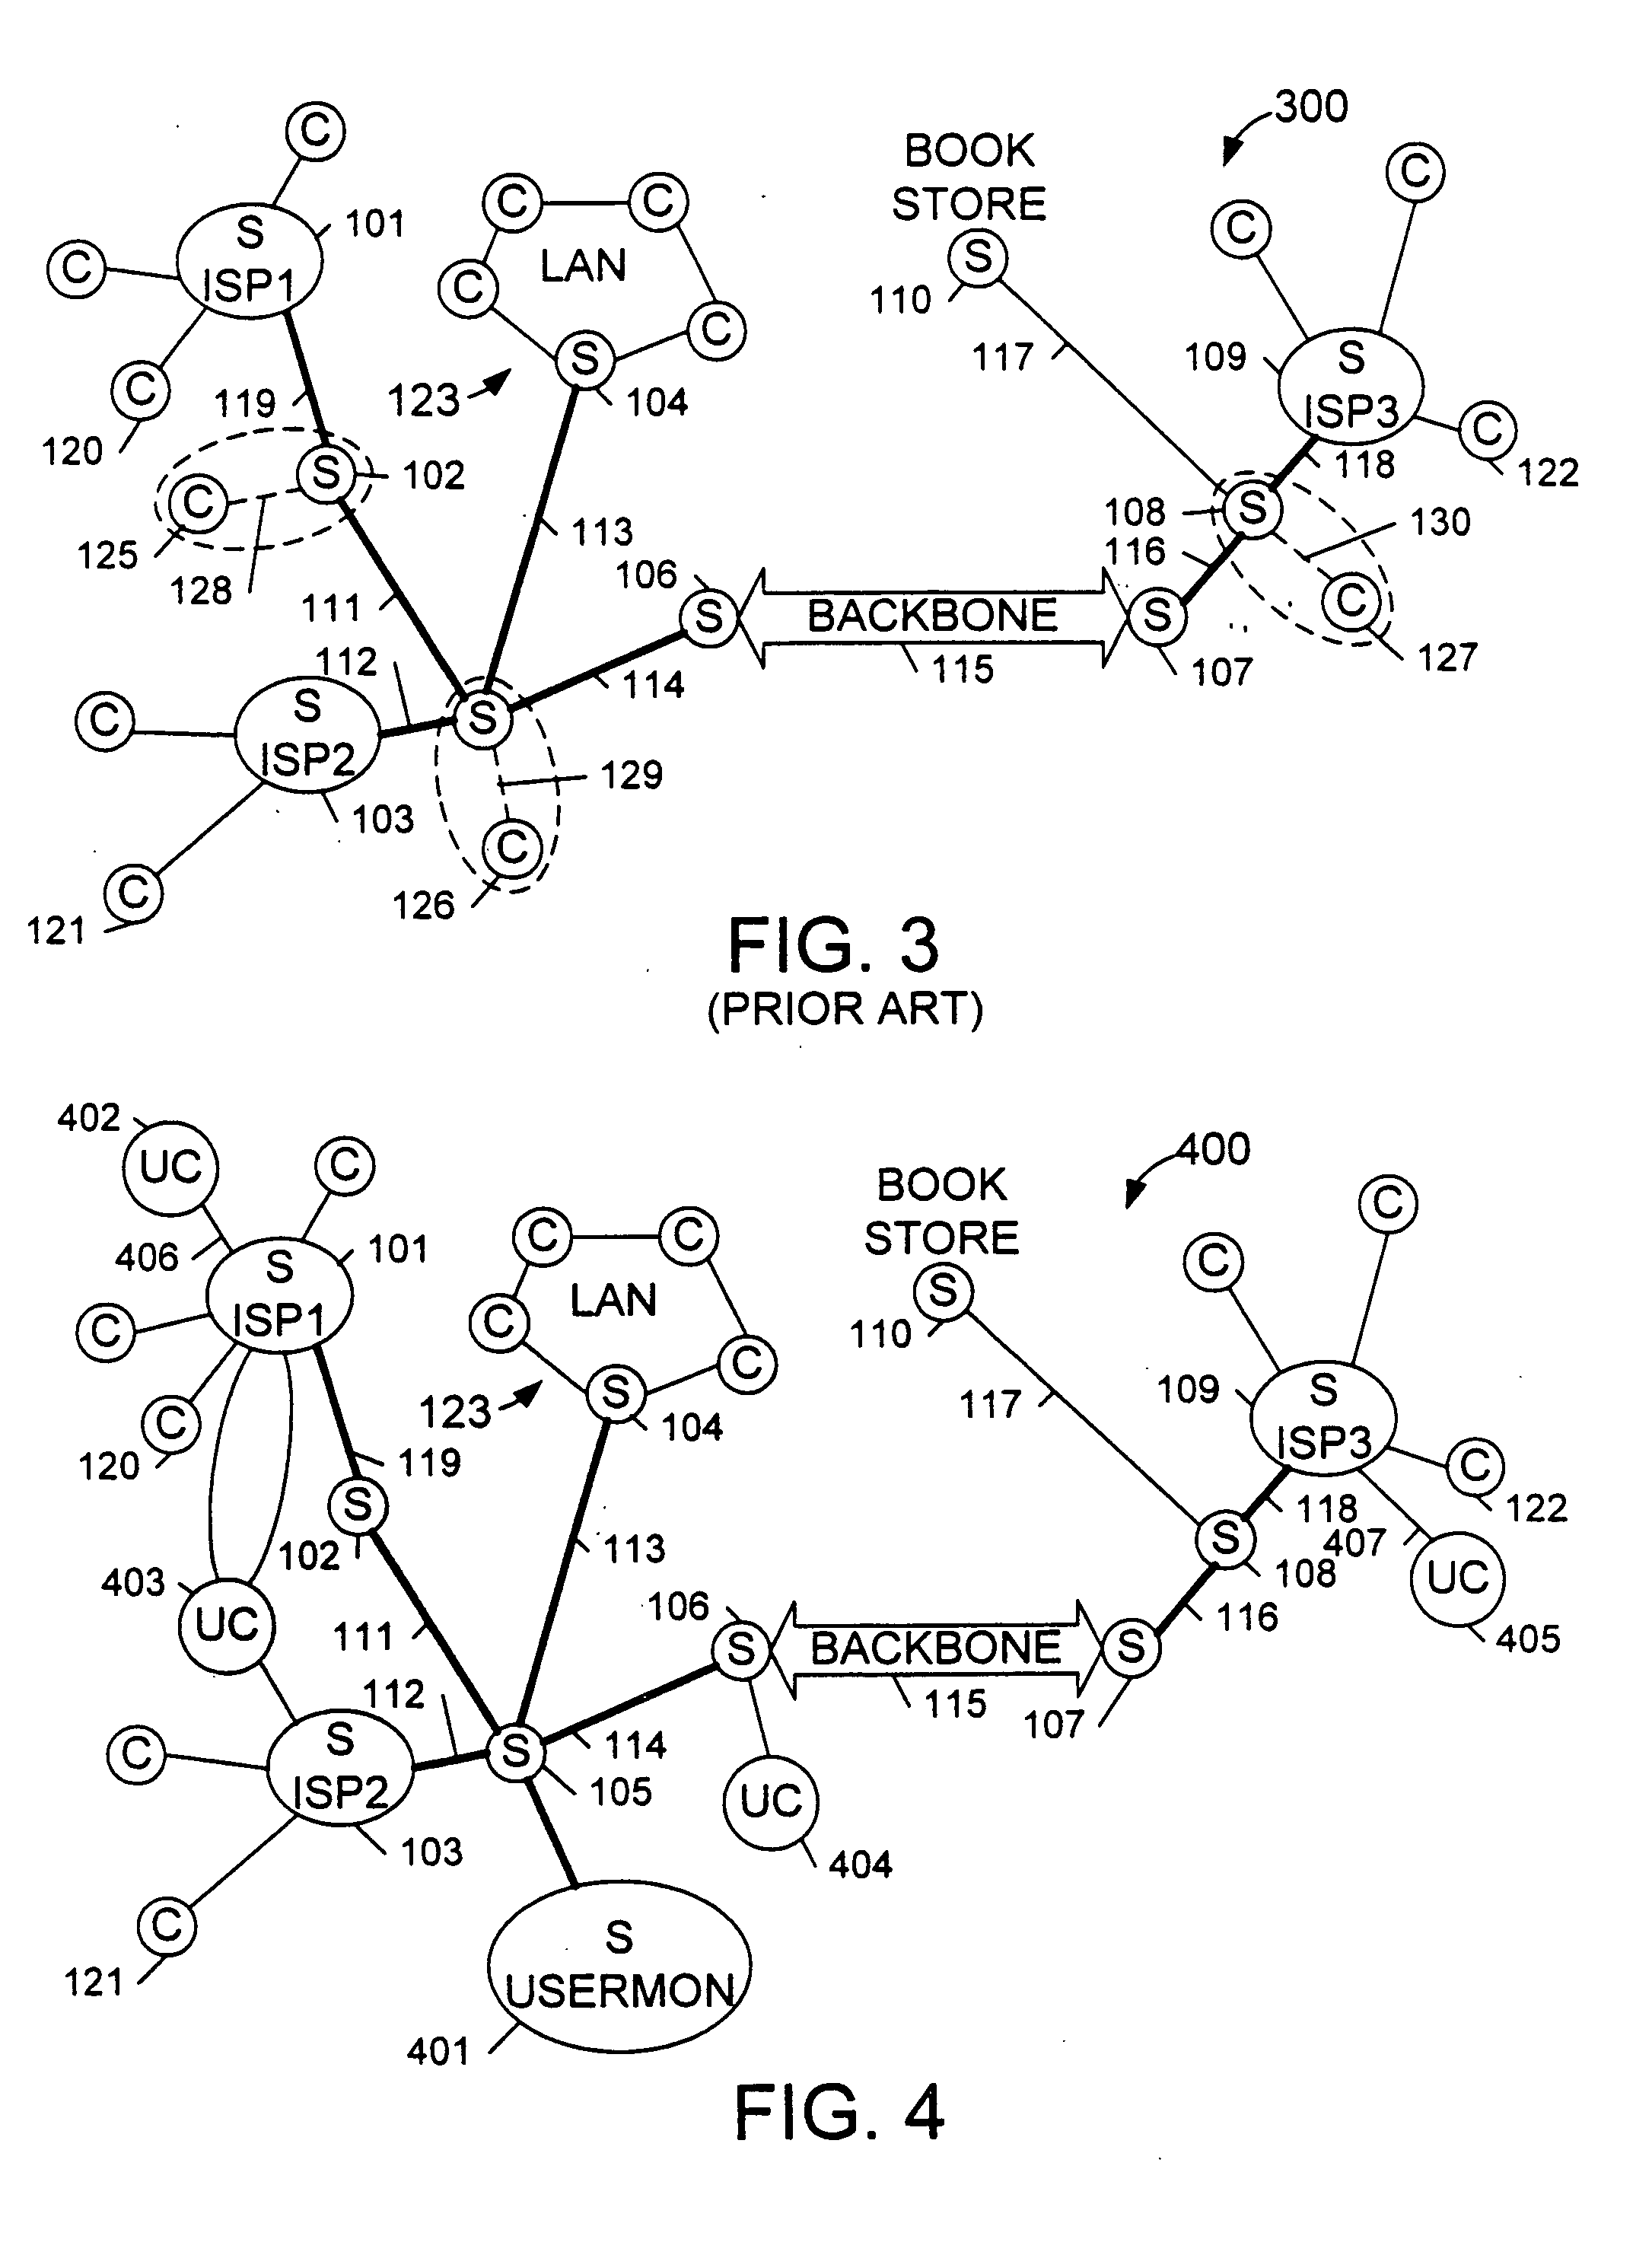
[0025]FIG. 4 is a simplified diagram of a system 400 that monitors the performance of Internet connections in accordance with the present invention. The overall performance of an Internet connection typically entails: the performance of a connection from a client to an Internet service provider (ISP), the performance of a connection from the ISP to a target web site, and the performance of the target site itself.

[0026] System 400 is a “distributed” system employing a number of data-gathering clients 402-405 connected to the Internet via local (i.e., not long distance) dial-up telephone connections. The system is called a “distributed” system because the data-gathering clients are distributed among a number of geographical locations. The system also involves a user-experience monitoring system server(s) 401, also called the “UserMon” server, that contains instructions to data-gathering clients 402 and 405 and receives data from data-gathering clients 402 and 405. As described below ...


PUM


Abstract

Geographically distributed data-gathering client computers are connected to the Internet in the same manner as typical users (for example, via local dial-up connections). The data-gathering client computers poll a central server (the “UserMon” server) for a target site to access. After receiving the address of a target site from the UserMon server, the data-gathering client computers access the target site and obtain performance-parameter values indicative of the quality of their respective Internet connections to the target site and / or the performance of the target site itself. Each data-gathering client computer then pushes the performance-parameter values back to the “UserMon” server for analysis.

Description

BACKGROUND INFORMATION [0001]FIG. 1 (Prior Art) is a diagram of an exemplary Internet structure 100. Internet structure 100 includes numerous servers 101-110 (each designated with an “S”) interconnected by high-speed connections 111-119. The high-speed connections are of several different types: for example, connection 113 is a T1 connection, connection 115 is a high-speed fiber-optic connection, part of the so-called “backbone” of the Internet, and connection 118 is a lower-speed ISDN connection. Internet structure 100 also includes numerous clients (each designated with a “C”) connected to the servers. Most of the clients are connected to the Internet via an Internet Service Provider, or “ISP.” For example, client 120 is connected to the Internet via ISP1 server 101. [0002] ISPs maintain servers on the Internet and sell Internet access to individual subscribing clients. A subscribing client typically gains access to the Internet using a modem to call the ISP. The client typically ...

Claims


Application Information

Patent Timeline
Patent Type & Authority Applications(United States)
IPC IPC(8): H04L12/24H04L12/26
CPCH04L41/5009H04L43/065H04L43/067H04L67/02H04L43/10H04L43/106H04L43/14H04L43/08
Inventor BOSS, JEROME D.MARCJAN, CEZARYSU, FEI
Owner ZHIGU HLDG
Features
  • R&D
  • Intellectual Property
  • Life Sciences
  • Materials
  • Tech Scout
  • Unparalleled Data Quality
  • Higher Quality Content
  • 60% Fewer Hallucinations
Learn More