
Method and apparatus for profiling power performance of software applications

a software application and power performance technology, applied in the field of power management in processor-based systems, can solve the problems of inability to accurately profile the power consumption of software lack of efficient and accurate mechanism for measuring and profiling power consumption of applications running on battery-powered devices, and inability to monitor a complex software application in its entirety. power measurement into the existing performance analysis framework will not yield an accurate profile of applications' power consumption

Inactive Publication Date: 2005-08-11
INTEL CORP
View PDF10 Cites 52 Cited by
  • Summary
  • Abstract
  • Description
  • Claims
  • Application Information

AI Technical Summary

Problems solved by technology

These tools, however, lack an efficient and accurate mechanism for measuring and profiling power consumption of applications running on battery powered devices.
Monitoring a complex software application in its entirety is very expensive and impractical, however.
However, simply incorporating power measurement into the existing performance analysis framework will not yield an accurate profile of an applications' power consumption.
Neither time- nor event-based sampling is suited for generating profiles of system power usage that provide an accurate and detailed account of power consumption of different code modules.
Both time- and event-based sampling are driven by parameters unrelated to power consumption and thus cannot provide an accurate power profile.
For example, time-based sampling will provide inaccurate measurement as different instructions consume different amounts of power, but may still have the same frequency of execution.
Two different code modules may execute the same instructions over the same time or may trigger a snapshot due to the same event (e.g., the same instruction causing a cache miss), but existing time-based and event-based sampling techniques would fail to recognize any differences in the amount of power consumed by the different modules.

Method used


Image

  • Method and apparatus for profiling power performance of software applications
  • Method and apparatus for profiling power performance of software applications
  • Method and apparatus for profiling power performance of software applications

Examples


example 1

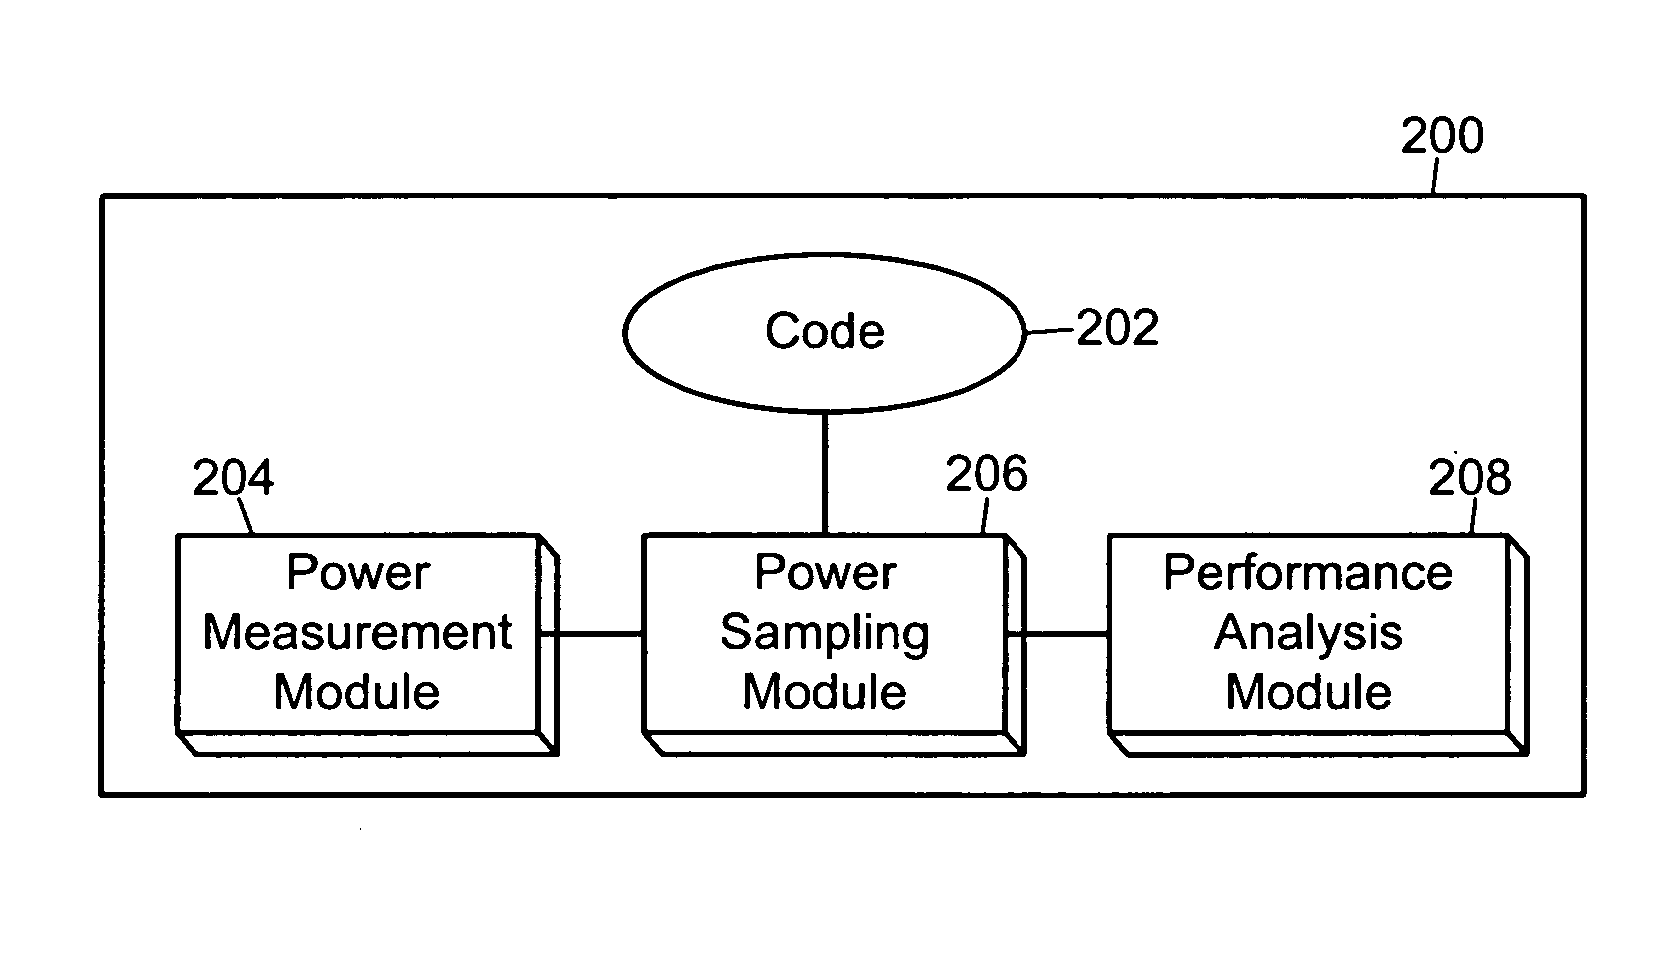
[0032]FIG. 4 illustrates an example implementation of architecture 400, similar to the architecture 200. A DC power source 402, such as a battery in a mobile or embedded device, supplies power to a subsystem 404 of the architecture 400. The subsystem 404 represents any machine subsystem, but in this example, it could also represent any component of a system or functional unit of the CPU. To measure the amount of power transmitted, a PMM 406 is coupled between the power source 402 and the subsystem 404. Alternatively, the PMM 406 may be coupled either to the power source 402 or to the subsystem 404. The PMM 406 is also coupled to a PSM 408 via a power monitoring interface 410, which may communicate with the PMM 406 to receive an indication that a desired quantum of power delivery from the power source 402 to the subsystem 404 has occurred. The PSM 408 further includes a system profiler 412 coupled to a CPU 414 for taking a snapshot of the CPU 414 upon a signal from the PMM 406. Alter...


PUM


Abstract

Techniques for profiling systems, such as mobile or embedded devices, are provided. The techniques can profile code executing on these systems based on power used by that code. The system may profile power usage for the entire system or a subsystem, component, or functional unit thereof, for example. The system may determine when a specified amount of power has been used, and a performance sampler may then temporarily stop execution of the code and sample state data. This sampled state data may be provided to a performance analyzer that determines performance of the executing code.

Description

FIELD OF THE DISCLOSURE [0001] The disclosure generally relates to power management in processor-based systems and, more particularly, to apparatuses and techniques for profiling power performance of code executed on such systems. BACKGROUND OF THE RELATED ART [0002] Power consumption of software applications is an essential performance characteristic in today's increasingly mobile computing market. Given the very limited advance in battery capacity in recent years, writing applications that are optimized for power is becoming ever more important. [0003] For traditional desktop applications various performance analysis tools are used to identify performance bottlenecks and optimize code that causes performance degradation. These tools, however, lack an efficient and accurate mechanism for measuring and profiling power consumption of applications running on battery powered devices. [0004] Performance analysis tools are an important component in a software development cycle, neverthel...

Claims


Application Information

Patent Timeline
IPC IPC(8): G06F1/32G06F19/00
CPCG06F1/3203
Inventor BANGINWAR, RAJESHGORBATOV, EUGENE
Owner INTEL CORP
Features
  • Generate Ideas
  • Intellectual Property
  • Life Sciences
  • Materials
  • Tech Scout
  • Unparalleled Data Quality
  • Higher Quality Content
  • 60% Fewer Hallucinations
Learn More