[0005] The invention is directed to a system and method of monitoring power quality in an electric power distribution system that generates a composite power quality indicator that is a function of a plurality of system parameters. Each component of the indicator is weighted by a user programmable factor to emphasize or de-emphasize its affect. The composite power quality indicator is updated from statistics generated during a sampling period. As part of each update, each component of the composite power quality indicator is normalized by a sensitivity to a preset threshold before multiplication by the user assigned weighting factor. After multiplication, the results accumulate until they are totaled at the end of the sampling period. During the update, the sensitivity is adjusted to maintain the user selected weighting of the components.
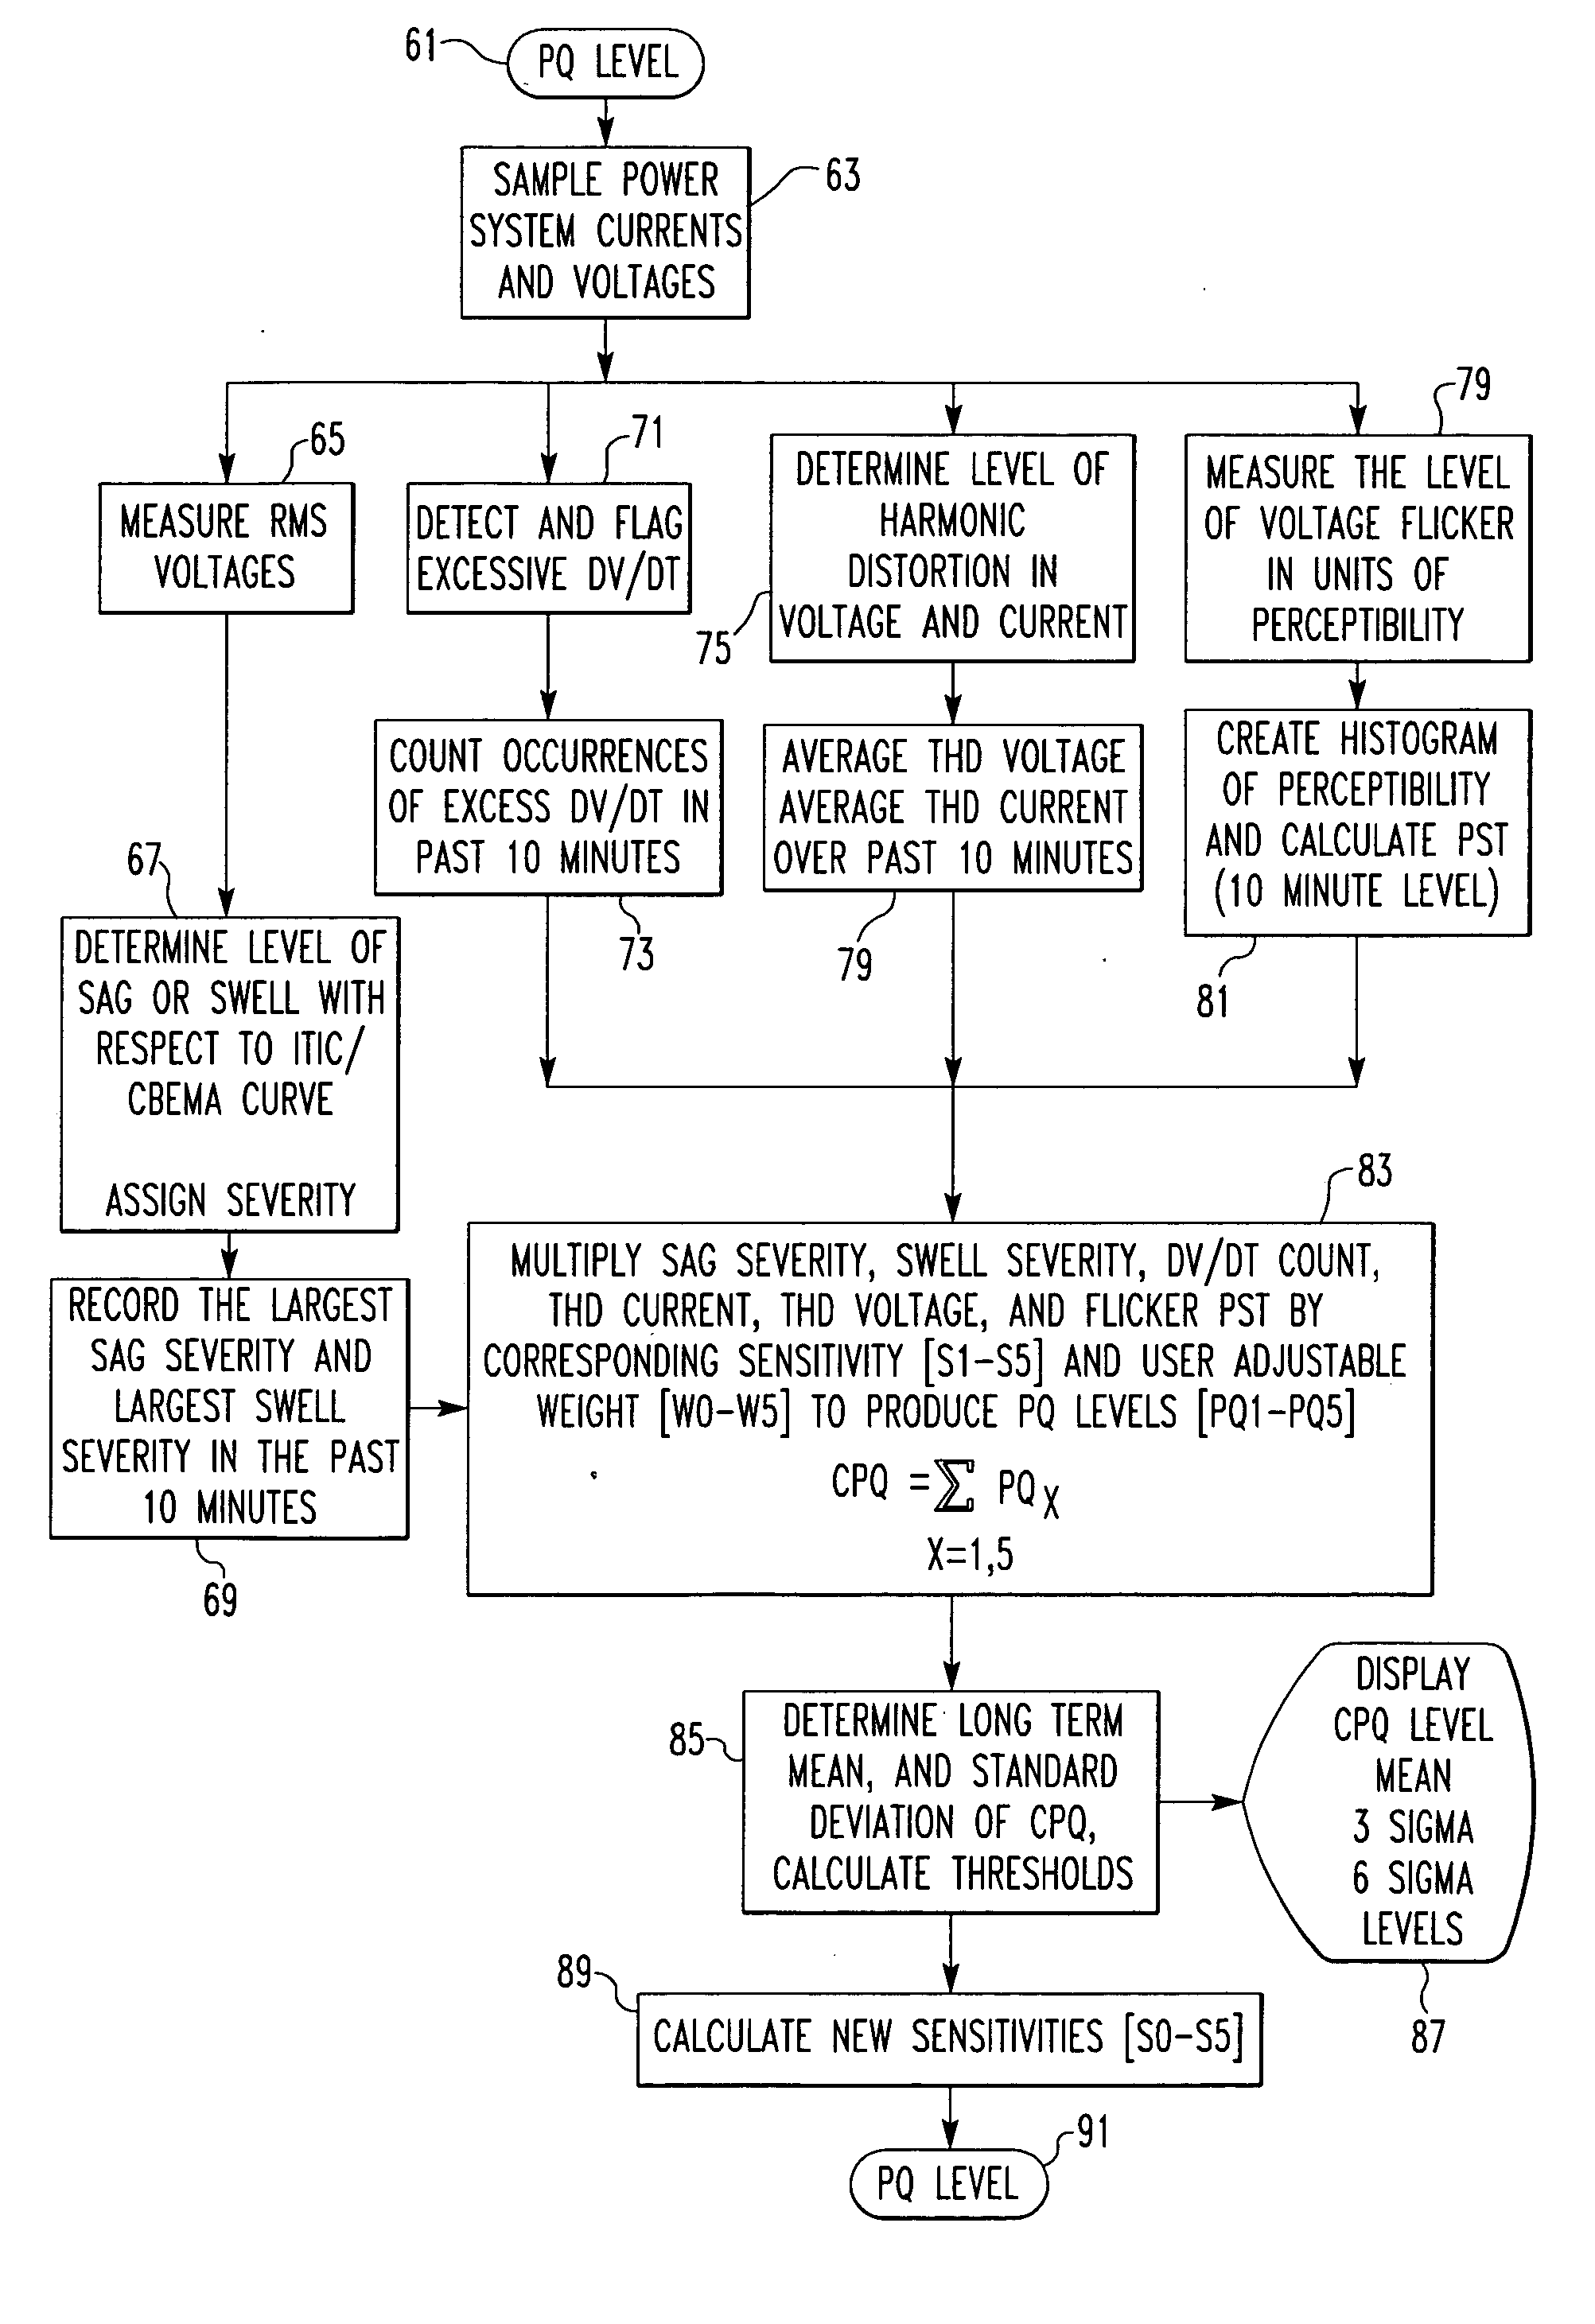
[0006] More particularly, the method in accordance with one aspect of the invention is directed to repetitively determining the values of a plurality of selected parameters of the electric power distribution system, generating a composite power quality indicator from the values of the plurality of selected parameters and generating an output representing the composite power quality indicator. Generation of the composite power quality indicator can comprise performing a statistical analysis of the values of the plurality of selected parameters. The values of the plurality of selected parameters can be determined by generating samples of each of the plurality of selected parameters over a sampling period and determining the values from the samples generated during the sampling period.
[0007] As another aspect of the invention, the composite power quality indicator is generated by generating a power quality component for each of the plurality of selected parameters and combining the power quality components to produce the composite power quality indicator. Combining the power quality components can comprise assigning an associated weighting factor to each power quality component selected to produce a selected weighting of that power quality component, multiplying each power quality component by its associated weighting factor to generate a weighted power quality component and adding the weighted power quality components to generate the composite power quality indicator. Preferably, the selected weighting of each of the power quality components is maintained by determining an associated power quality component sensitivity and multiplying the power quality component by its power quality component sensitivity as well as the associated weighting factor. Each power quality sensitivity can be determined by maintaining a long-term mean value for each power quality component and a long-term mean value for the composite power quality indicator and multiplying the associated weighting factor by a ratio of the composite power quality indicator long-term mean to the power quality component long-term mean. Each power quality component sensitivity can be updated by multiplying the most recent power quality component sensitivity by the associated weighting factor and a ratio of the composite power quality indicator long-term mean to the power quality component long-term mean.
[0008] In accordance with another aspect of the invention, the composite power quality indicator is further generated by generating at least one dynamic threshold for the composite power quality indicator and generating the output includes generating a representation of the composite power quality indicator relative to the at least one dynamic threshold. The at least one dynamic threshold can be generated by generating a long-term mean of the composite power quality indicator, generating a standard deviation of the long-term mean and generating the at least one dynamic threshold as a function of the standard deviation. In this case, the output step further comprises generating a representation of the composite power quality indicator relative to its long-term mean and to the at least one dynamic threshold. The long-term mean of the composite power quality indicator can be generated as a moving average over a selected time. The generation of the composite power quality indicator over the selected time period can comprise generating a first moving average over a first time period and generating a second moving average over a second time period which is a multiple of the first time period. The composite power quality indicator is generated using only the first moving average until the method has been used for at least the second time period and then the composite power quality indicator is generated using the second moving average. In the exemplary embodiments of the invention, the first time period is one week and the second time period is one year.
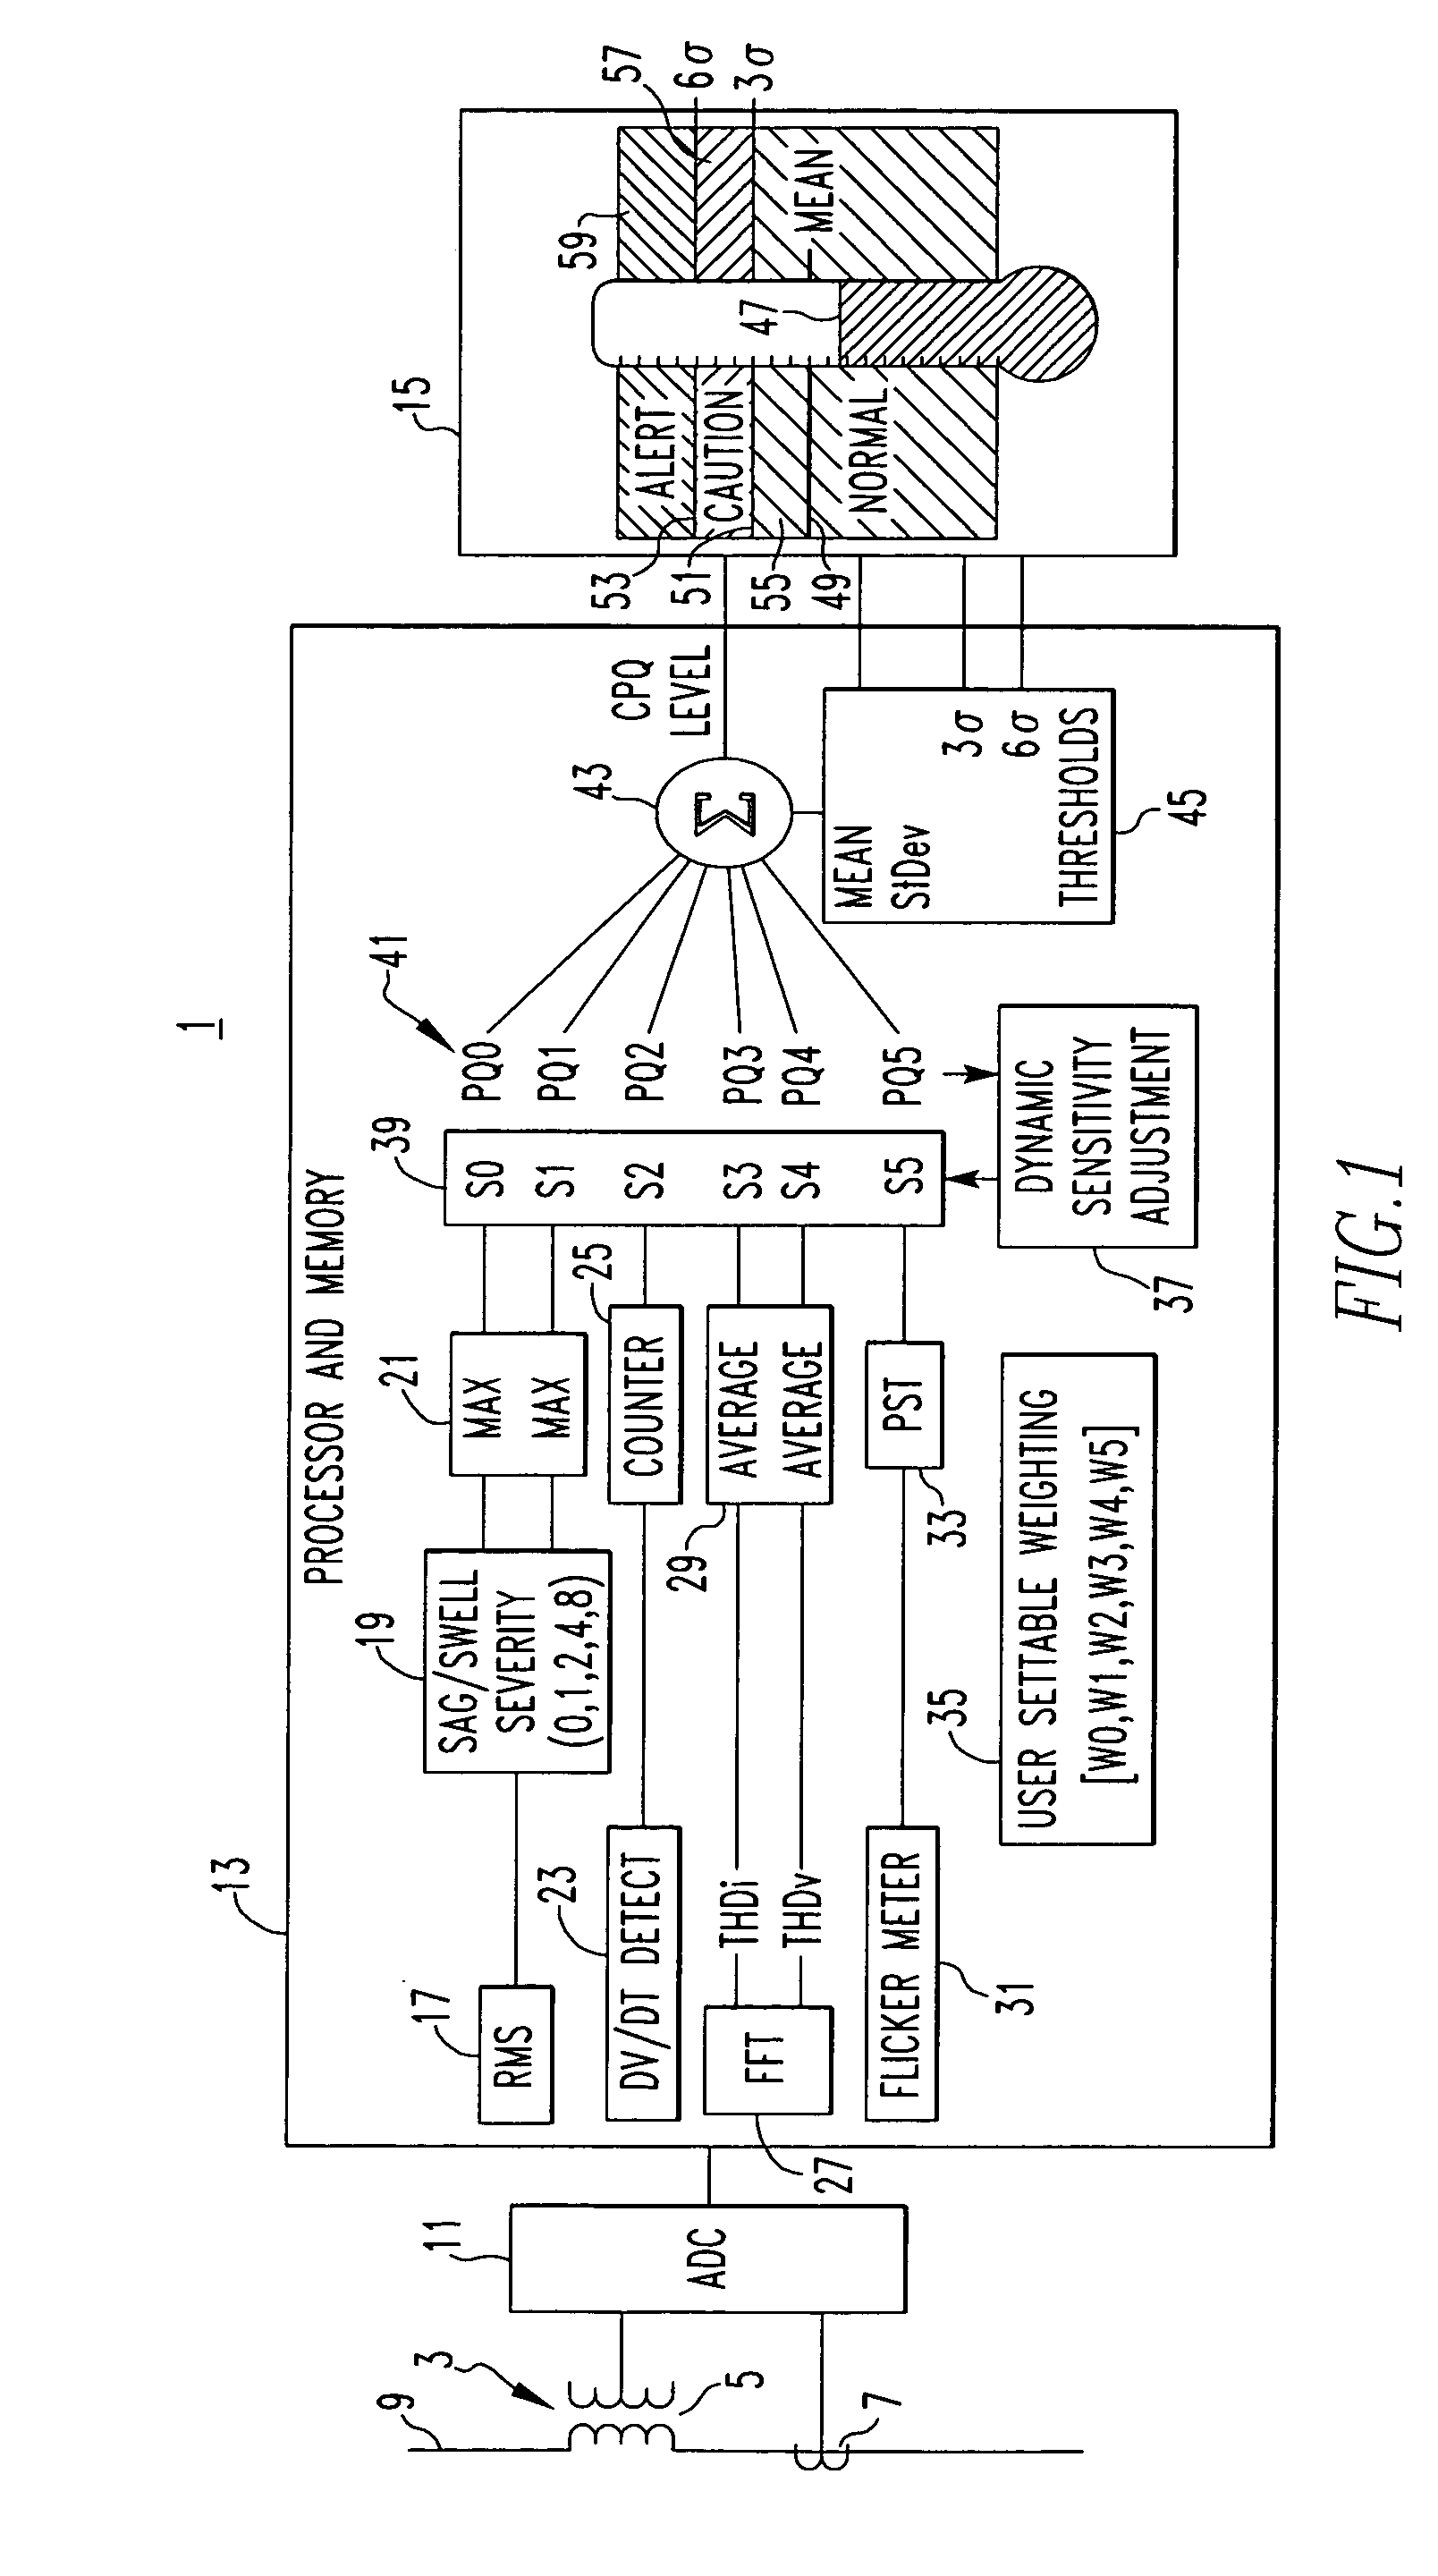
[0009] As another aspect of the invention, a power quality monitor for an electric power distribution system comprises sensors for sensing current and voltages in the electric power distribution system, processing means comprising means for repetitively determining values of selected parameters from the currents and voltages and for statistically generating a composite power quality indicator from the values of the selected parameters, and output means providing a representation of the composite power quality indicator. The processing means can comprise means generating power quality components from the values of the selected parameters and combining the power quality components to generate the composite power quality indicator. The processing means can also comprise means generating a long-term mean of the composite power quality indicator and the output means can comprise a display displaying the composite power quality indicator relative to the long-term mean of the composite power quality indicator.
[0010] In addition, the processing means can comprise means generating a long-term mean of the composite power quality indicator, a standard deviation of the long-term of the composite power quality indicator and at least one dynamic threshold as a function of the standard deviation, and the output means can comprise a display displaying the composite power quality indicator relative to the long-term mean of the composite power quality indicator and relative to the at least one dynamic threshold. In a preferred form, the process means can comprise means generating a first dynamic threshold as a first function of the standard deviation and a second dynamic threshold as a second function of the standard deviation greater than the first function of the standard deviation, and wherein the display displays the first and second dynamic thresholds relative to the long-term mean to define a safe zone for the composite power quality indicator between the long-term mean and the first dynamic threshold, a caution zone between the first and second dynamic threshold and an alert zone farther from the long-term mean than the second dynamic threshold. Also, the processing means can comprise means generating the power quality components from values of the selected parameters, means providing a selected weighting of each power quality component by applying a selected weighting factor to that power quality component to generate weighted power quality components and means combining the weighted power quality components to generate the composite power quality indicator. The processing means can further comprise means maintaining the weighting of each power quality component by applying a continually adjusted sensitivity to each weighed power quality component derived from the long-term mean of the composite power quality indicator and a long-term mean of the power quality component.

