Display method for signal analyzer

a signal analyzer and display method technology, applied in the field ofspectrum analysis, can solve the problems of reducing time resolution, unable to provide a display in the modulation domain, and display methods that do not provide effective analysis for complex signal multiplexing frequency and time dimensions

Active Publication Date: 2005-11-24
TEKTRONIX INC
View PDF24 Cites 55 Cited by
  • Summary
  • Abstract
  • Description
  • Claims
  • Application Information

AI Technical Summary

Benefits of technology

[0008] Accordingly the present invention provides a method for a signal analyzer of displaying a signal under test which presents data for the signal under test as a display having time and frequency axes as a function of a marker that indicates user definable time and frequency scales, and then displays sub-graphs relating to the data that are included in the desired time and frequency scales of the marker. This makes it possible to designate a desired portion of the signal under test from the viewpoints of both the time and frequency to measure the characteristics in comparison with the conventional display methods. This makes it easy to balance between both time and frequency resolutions.

Problems solved by technology

The display of FIG. 1 is suitable for analyzing a time variable signal like a burst signal, but not for analyzing each carrier in a multiple-carrier signal because there are no means to delimit an area, or band, in the frequency axis direction.
However, FIG. 3 does not present a display that designates time and frequency intervals that have desired widths.
Further the display of FIG. 3 cannot provide a display in the modulation domain.
The above conventional display methods do not provide an effective analysis for a complex signal multiplexing frequency and time dimensions.
In other words, the method of FIG. 1 divides time into desired intervals to obtain proper time resolution, but not proper frequency resolution in exchange for the time resolution.
The method of FIG. 2 extracts data on the frequency axis, but not on the time axis, i.e., too much time data decreases time resolution and it is difficult to set a proper time resolution according to the measurement.
The method of FIG. 3 displays cross-sections at a desired time and frequency, but is not suitable for analyzing a signal having some bandwidth, and does not handle modulation domain analysis.

Method used


Image

  • Display method for signal analyzer
  • Display method for signal analyzer
  • Display method for signal analyzer

Examples


Embodiment Construction

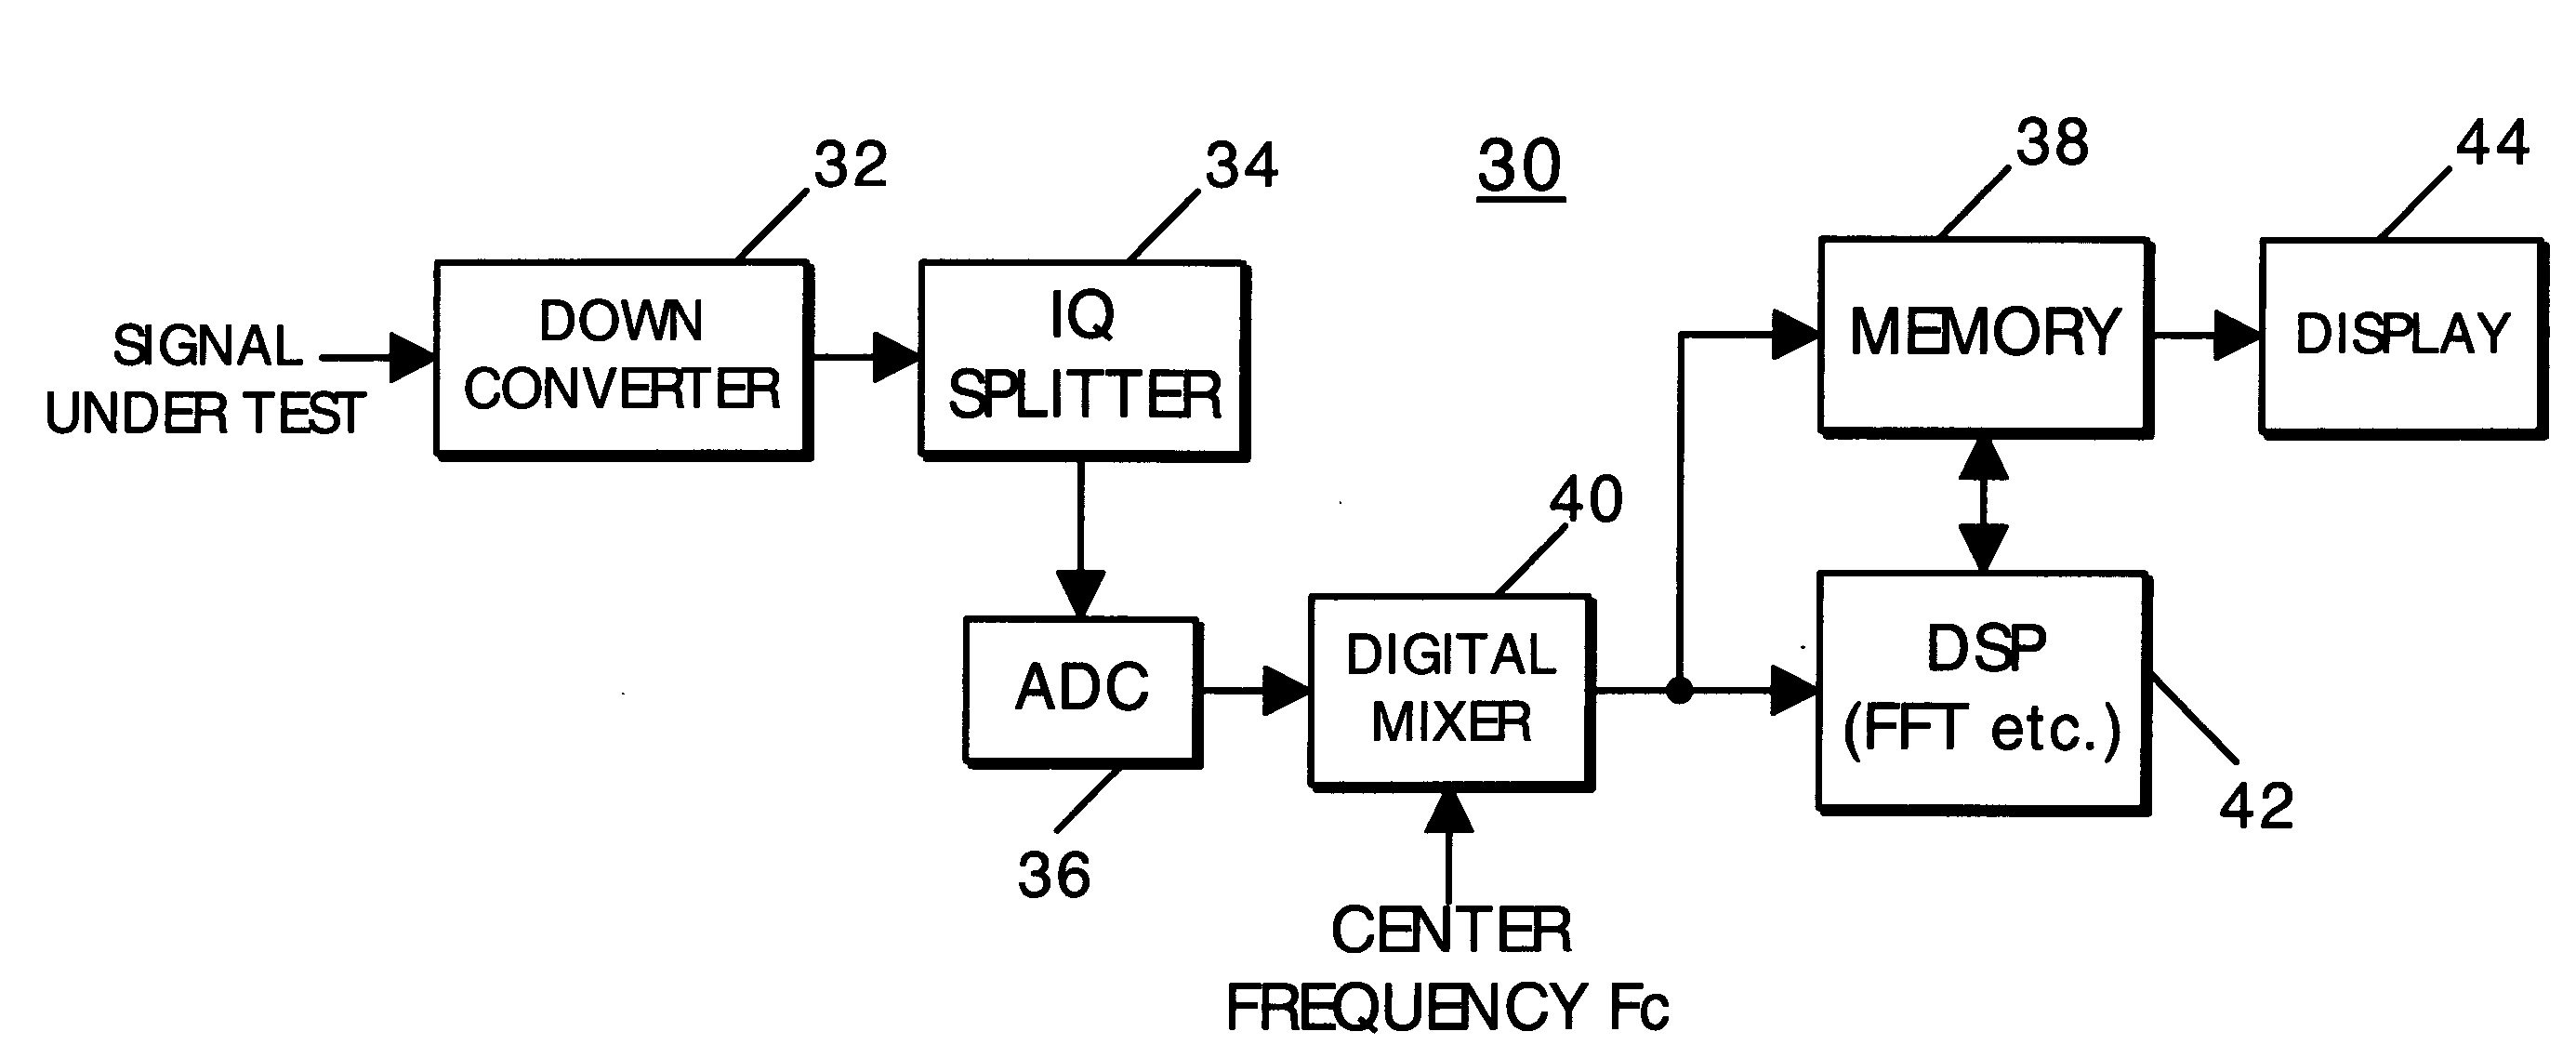
[0017] Referring now to FIG. 4 a signal analyzer 30 is shown that has a conventional microprocessor, mouse, keyboard, hard disk drive (HDD), etc. (not shown) and operates according to a program stored in the HDD under control of the microprocessor. A user sets up a center frequency Fc, position and size of a rectangle marker on the display conventionally, i.e., with the mouse, keyboard, etc. A frequency down converter 32 converts a signal under test, such as a digital modulation signal for a cell phone, to a signal having an intermediate frequency (IF) lower than a carrier frequency for the signal under test. An IQ separator 34 separates the intermediate frequency into I and Q components. An analog-to-digital converter (ADC) 36 converts the IQ components into digital time domain data respectively and provides them to a digital mixer 40. U.S. Pat. No. 6,340,883 (Akira Nara) discloses an accurate IQ separation technique. The digital mixer 40 further converts the digital IQ signals to ...


PUM


Abstract

A rectangle marker on a display of a signal analyzer simultaneously designates time and frequency intervals of data from a signal under test for analysis. The data of the signal under test is displayed as a graph having time and frequency axes. Sub-graphs show data designated by the rectangle marker as processed in the time domain, frequency domain and modulation domain. The resulting display provides an overview of the signal under test and simultaneously provides displays of measurements and analyses for a designated portion of the data.

Description

BACKGROUND OF THE INVENTION [0001] The present invention relates to spectrum analysis, and more particularly to a method of displaying a marker having variable time and frequency scales on a graph of a signal under test, and to displaying sub-graphs relating to data designated by the marker. [0002] In wireless communication using digital modulation, such as that represented by a cell phone or wireless LAN, wireless signals are complicated in that they limited to a finite frequency resource and therefore use either multiple-carriers or time division multiplexing with a burst signal. FIG. 1 shows an example of a display presented by a conventional spectrum analyzer used for analyzing these complex signals. The display is divided into three view areas—A, B and C. View area A shows a three-dimensional spectrogram display where the X or horizontal axis indicates frequency, the Y or vertical axis indicates time and a variation of color or brightness indicates magnitude of power. The spect...

Claims


Application Information

Patent Timeline
Patent Type & Authority Applications(United States)
IPC IPC(8): G01R13/02G01R23/16G01R23/173G01R23/18
CPCG01R13/029H04B17/23G01R23/18
Inventor NARA, AKIRA
Owner TEKTRONIX INC
Why Eureka
Try Eureka