System and method for evaluating exposure across a group of investment portfolios by category
- Summary
- Abstract
- Description
- Claims
- Application Information
AI Technical Summary
Benefits of technology
Problems solved by technology
Method used
Image
Examples
example 1
[0059] Screens 200a, 200b and 200c of FIGS. 4-6 are illustrative screens for displaying the results of an exemplary analysis in the form of interactive graphs, charts and tables, which was configured in screens 100a-b described above. The results are described as “Displaying % NAV for LEH Sector & Issuer by Portgroup Tree (Issuers Only)” in title bar 158 in screens 200a-c.
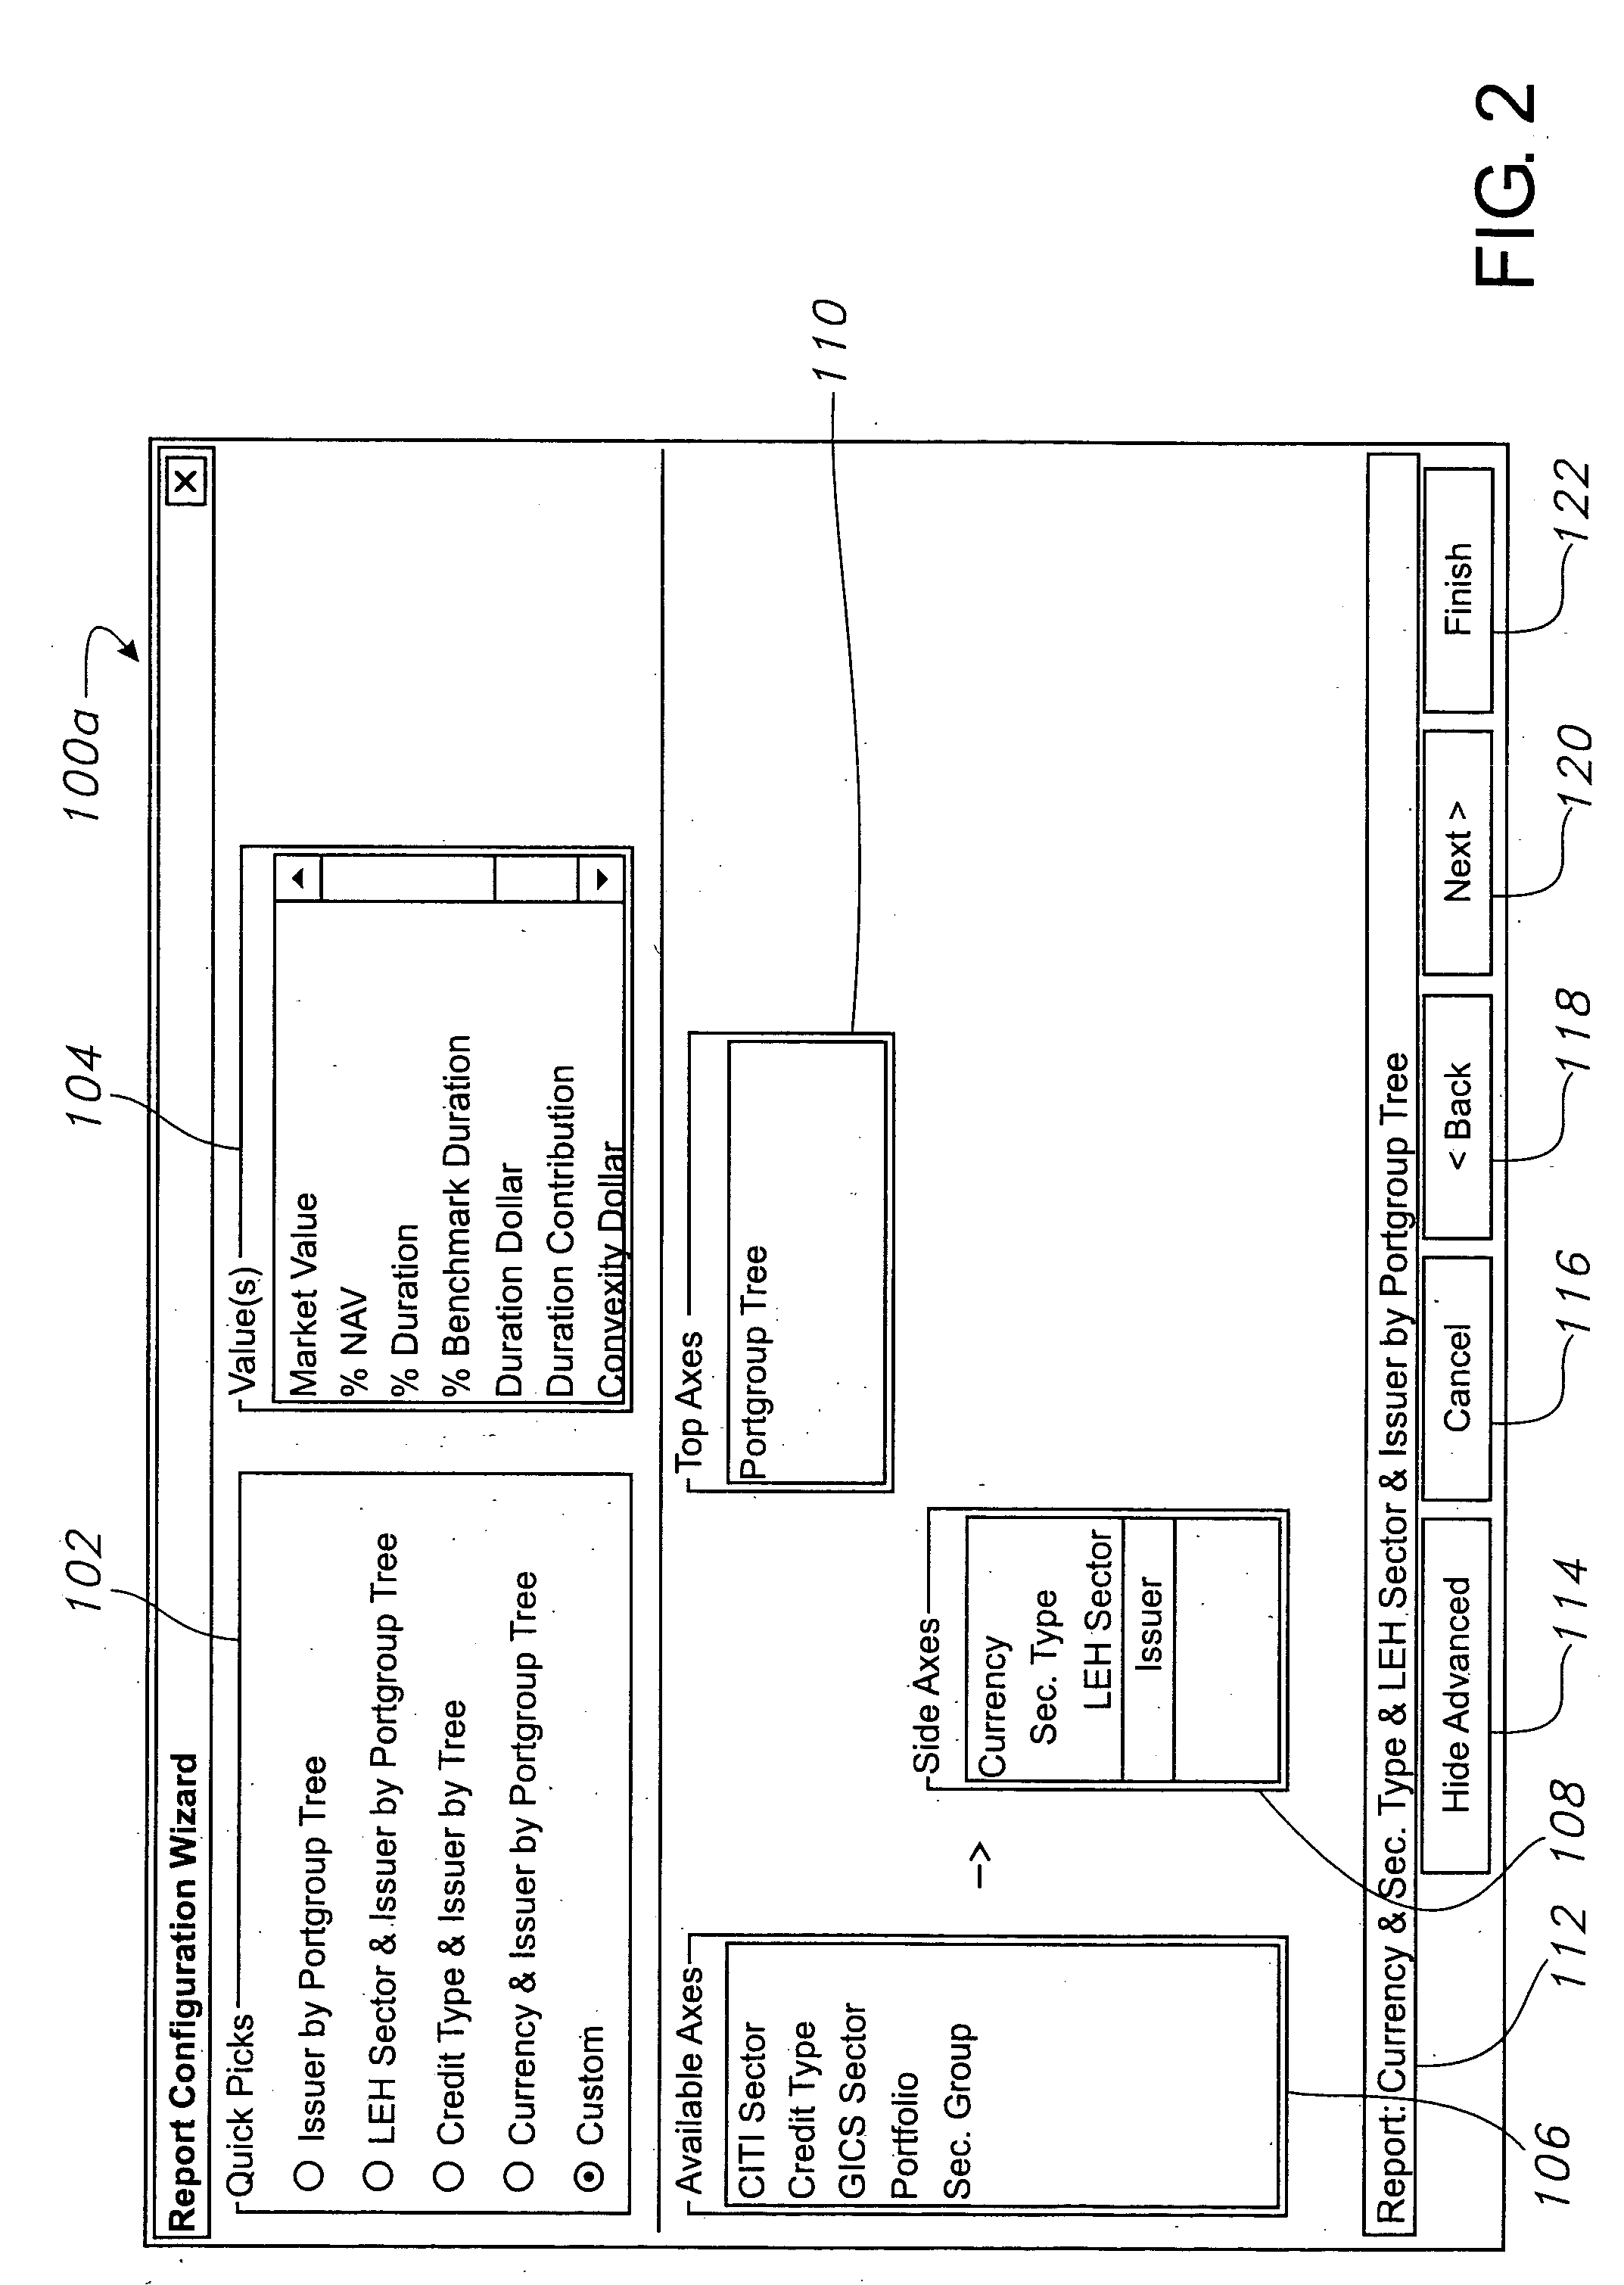
[0060] The rule for categorization which would be configured in screens 100a-b for this exemplary analysis is that system 10 is to categorize investments of issuers only within the ABC portfolio group stored in portfolio database 16 by LEH sector, and also, subcategorize these investments by issuer for each portfolio in the portfolio group, and the entire portfolio. The comparative parameter is % NAV, and therefore exposure is quantified by calculating the total % NAV values for the investments in each category and subcategory for each portfolio within the portfolio group. Further details regarding inputting this ...
example 2
[0077] Screens 300a, 300b, 300c and 300d of FIGS. 7-10 are illustrative screens for displaying the results of another exemplary analysis in the form of interactive graphs, charts and tables, which was configured in screens 100a-b. The results are described as “Displaying % NAV for Currency & Sec. Type & LEH Sector & Issuer by Portgroup Tree (Issuers Only)” in title bar 158 in screens 300a-d.
[0078] The rule for categorization which would be configured in screens 100a-b for this exemplary analysis is that system 10 is to categorize investments of issuers only within the EFG portfolio group stored in portfolio database 16 by currency, and also, subcategorize these investments by security type, subcategorize each of those categories by LEH sector, and subcategorize each of those categories by issuer for each portfolio in the portfolio group, and the entire portfolio. The comparative parameter is % NAV, and therefore exposure is quantified by calculating the total % NAV values for the i...
example 3
[0087] Screens 400a and 400b of FIGS. 11-12 are illustrative screens for displaying the results of another exemplary analysis in the form of interactive graphs, charts and tables, which was configured in screens 100a-b. The results are described as “Displaying Market Value for Issuer by Portgroup Tree (Issuers Only) (in USD)” in title bar 158 in screens 400a-b.
[0088] The rule for categorization that would be configured in screens 100a-b for this exemplary analysis is that system 10 is to categorize investments of issuers only within the ABC portfolio group stored in portfolio database 16 by issuer for each portfolio within the portfolio group and the entire portfolio. The comparative parameter is market value, and therefore exposure is quantified by calculating the total market value for investments in each category for each portfolio within the portfolio group, and for the entire portfolio group. Further details regarding inputting this rule and the output results are discussed be...
PUM
 Abstract
Description
Claims
Application Information
 - R&D
- Intellectual Property
- Life Sciences
- Materials
- Tech Scout
- Unparalleled Data Quality
- Higher Quality Content
- 60% Fewer Hallucinations
Browse by: Latest US Patents, China's latest patents, Technical Efficacy Thesaurus, Application Domain, Technology Topic, Popular Technical Reports.
© 2025 PatSnap. All rights reserved.Legal|Privacy policy|Modern Slavery Act Transparency Statement|Sitemap|About US| Contact US: help@patsnap.com


