
Methods and apparatus for visualizing relationships among triples of resource description framework (RDF) data sets

Inactive Publication Date: 2006-02-16
NUTTER MCCLENNEN & FISH
View PDF99 Cites 20 Cited by
  • Summary
  • Abstract
  • Description
  • Claims
  • Application Information

AI Technical Summary

Benefits of technology

[0015] Still yet further aspects of the invention provide as described above additionally including activating or deactivating displayed icons in response to user selection of an enumerated subject or

Problems solved by technology

Integration between these systems is difficult at best, consuming specialized programming skill and constant maintenance expenses.
A major impediment to enterprise business visibility is the consolidation of these disparate legacy databases with one another and with newer e-commerce databases.
For instance, inventory on-hand data gleaned from a legacy ERP system may be difficult to combine with customer order data gleaned from web servers that support e-commerce (and other web-based) transactions.
This is not to mention difficulties, for example, in consolidating resource scheduling data from the ERP system with the forecasting data from the marketing database system.
Even where data from disparate databases can be consolidated, e.g., through data mining, directed queries, brute-force conversion and combination, or otherwise, it may be difficult (if not impossible) to understand and use.
For example, the average user may be wholly unable to make sense of a listing of tens, hundreds or even thousands of pages of consolidated corporate ERP, e-commerce, marketing and other data.

Method used


Image

  • Methods and apparatus for visualizing relationships among triples of resource description framework (RDF) data sets
  • Methods and apparatus for visualizing relationships among triples of resource description framework (RDF) data sets
  • Methods and apparatus for visualizing relationships among triples of resource description framework (RDF) data sets

Examples


Embodiment Construction

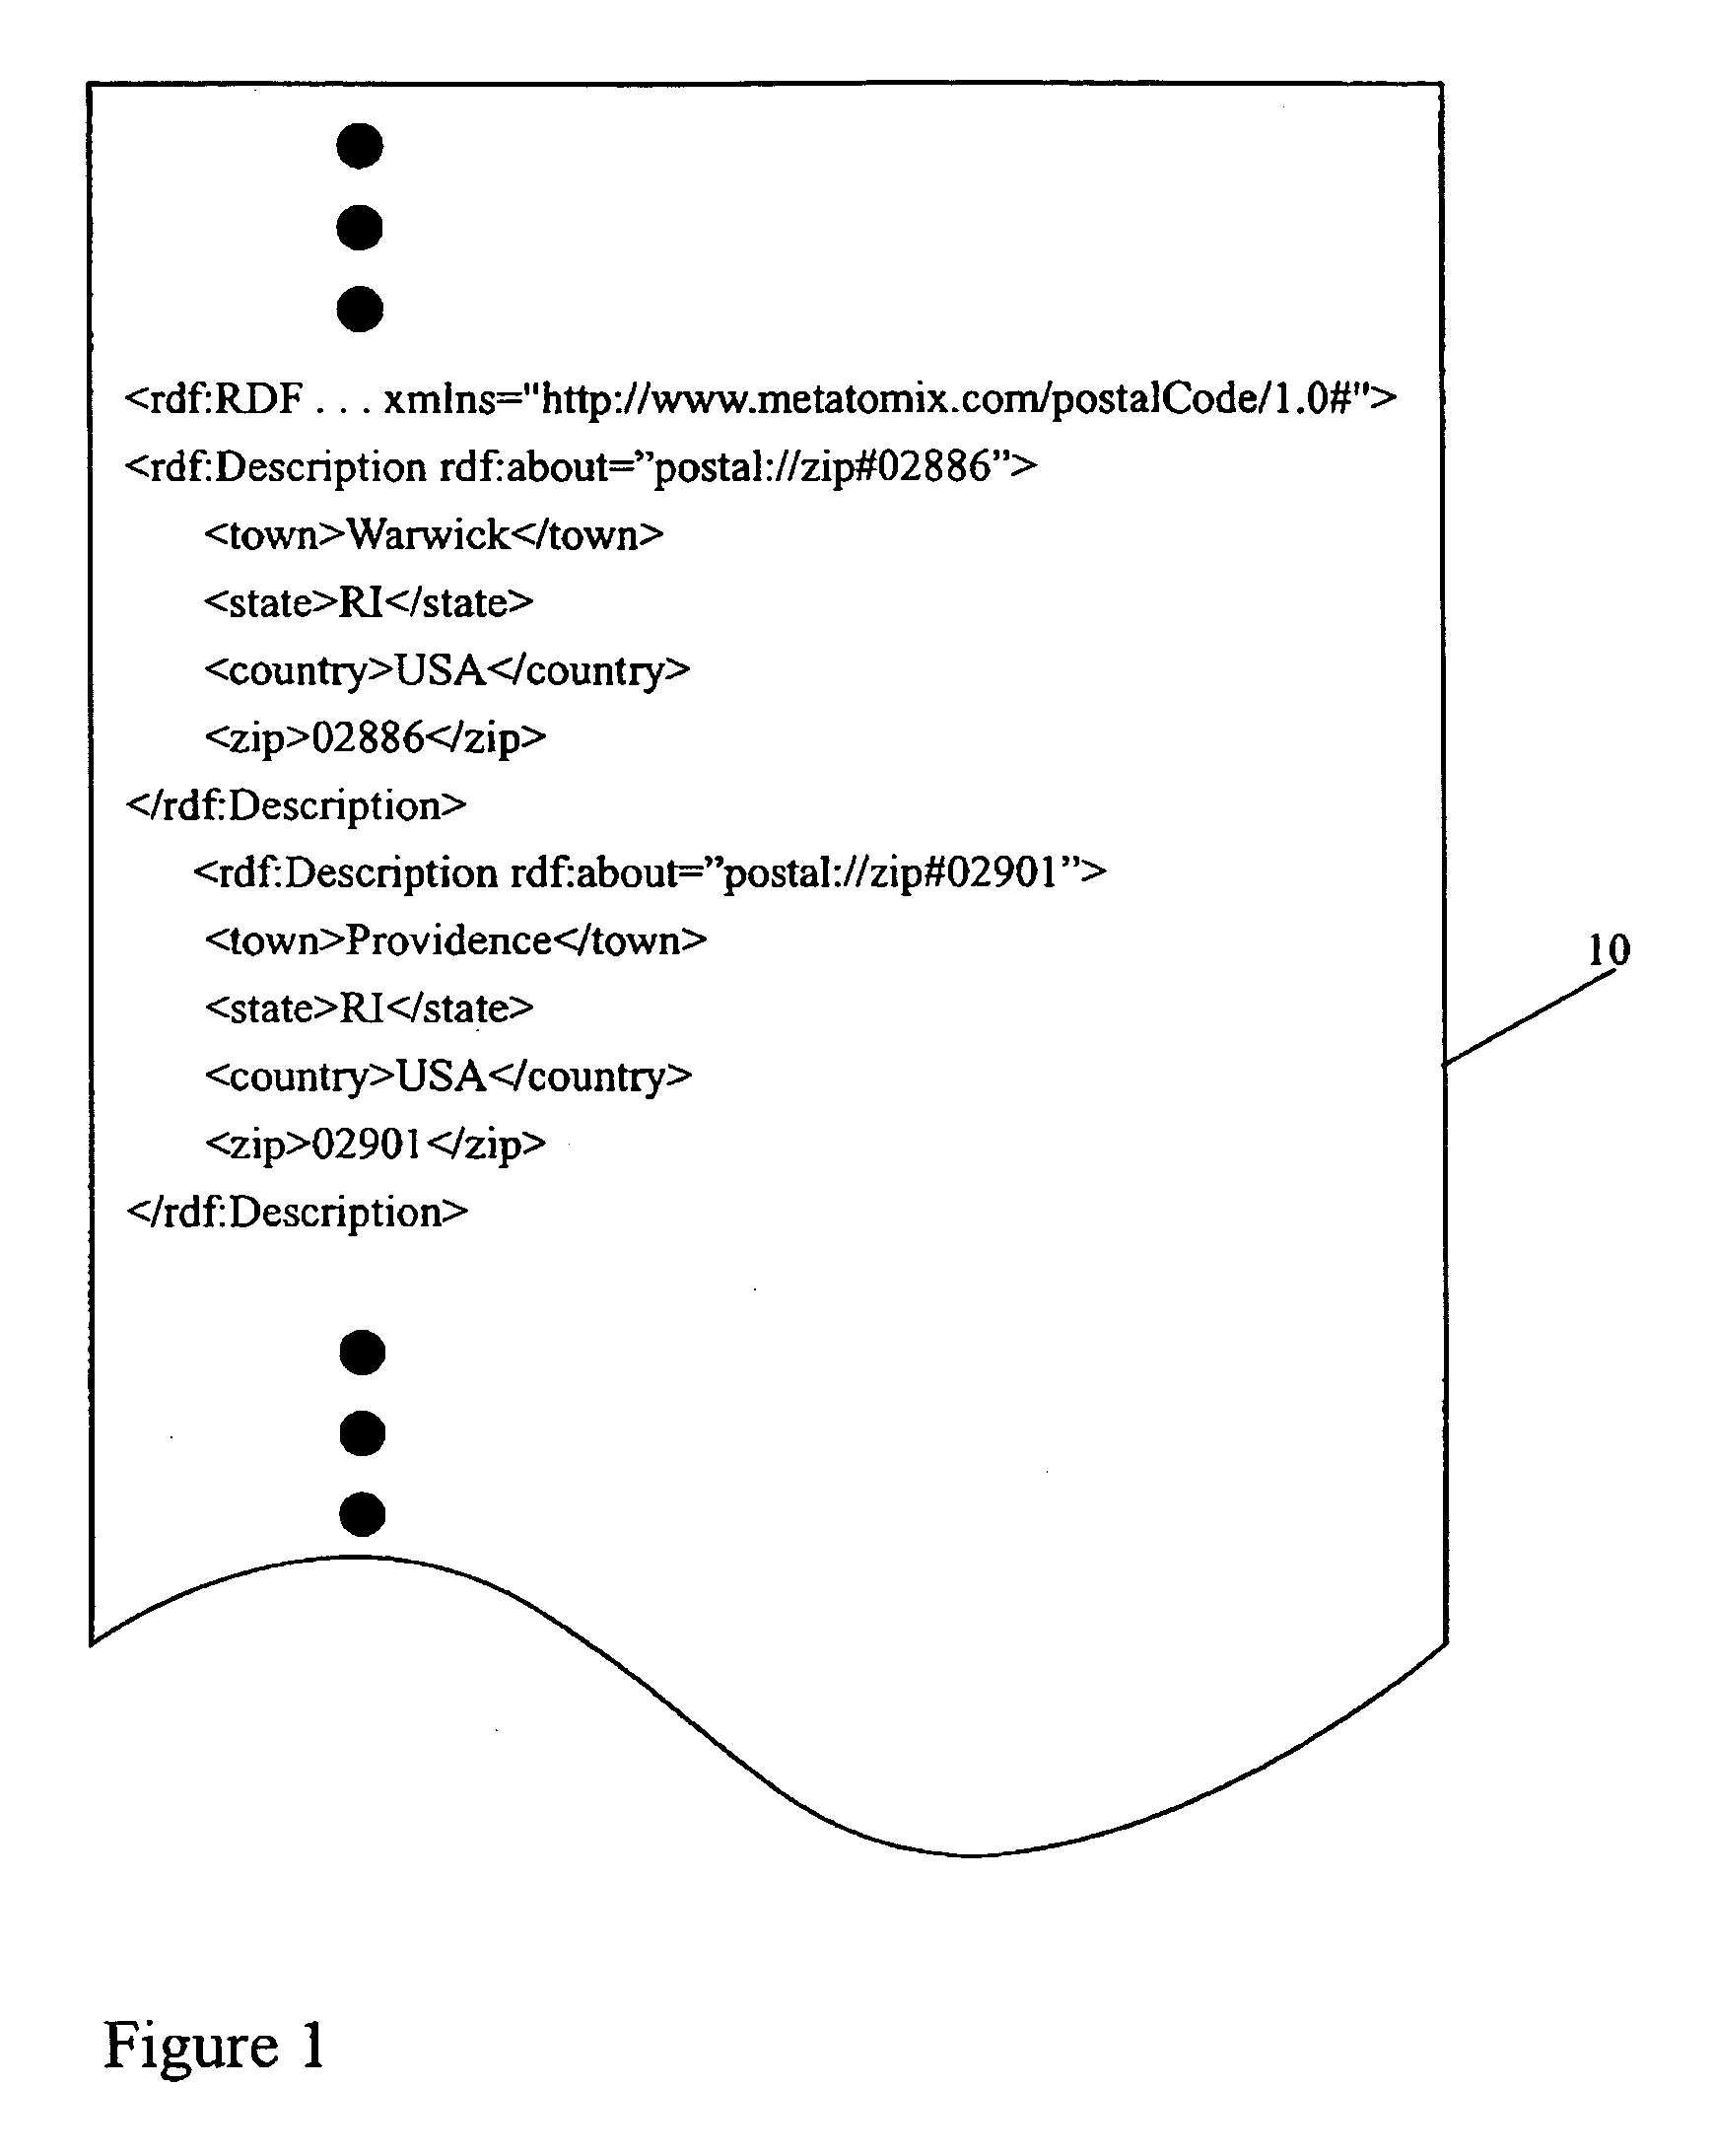
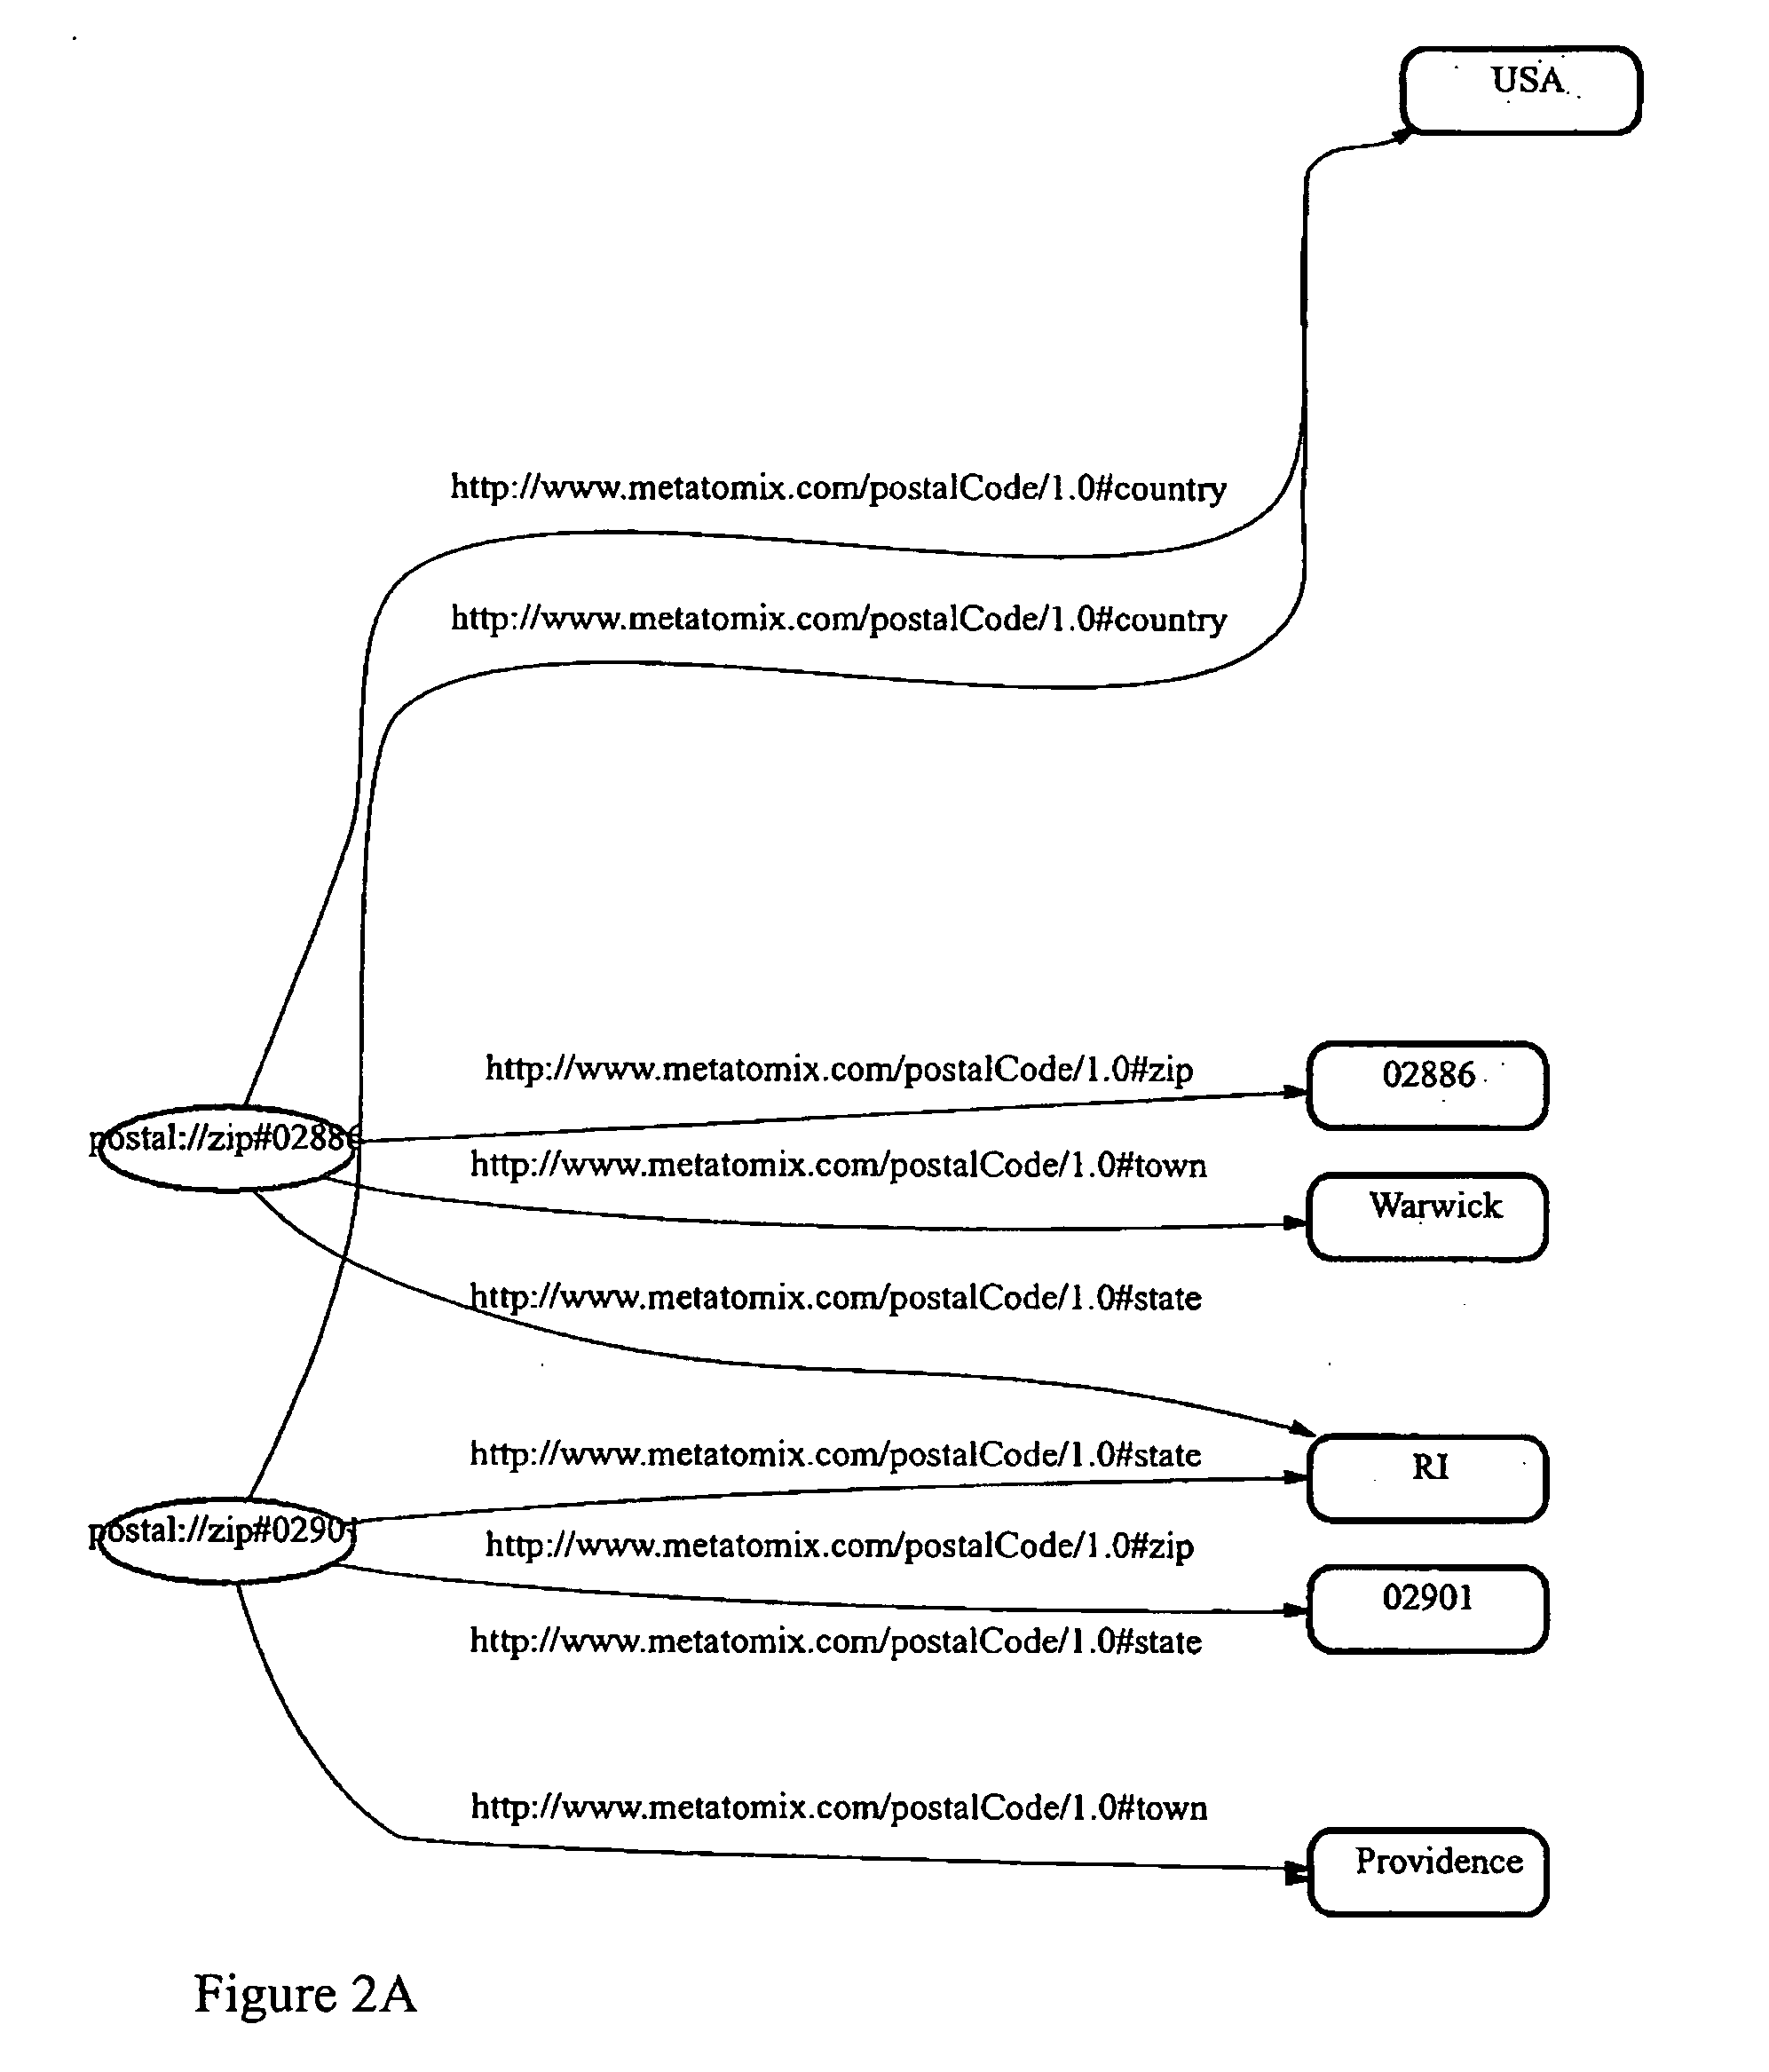
[0025] The invention provides methods and apparatus for visualizing relationships among data, e.g., of the type stored in one or more data sets. Though the illustrated embodiment is directed to providing such visualizations for data maintained as resource description framework (“RDF”) triples, it will be appreciated that the invention and the teachings hereof are applicable to data maintained in other representations (e.g., by way of conversion of that data to RDF triples and subsequent application of the techniques herein). The methods and apparatus presented here are appropriate for visualizing relationships not only among data in a single data set (e.g., database), but also among data maintained in multiple data sets. Thus, those methods and apparatus are well suited for use with data consolidated from multiple databases, e.g., in the manner described in the following copending, commonly assigned application, the teachings of which are incorporated herein by reference: [0026] U.S...


PUM


Abstract

The invention provides, in one aspect, a method for visualizing relationships among triples of an RDF data set. The method, which can be used with a data set already in RDF form or converted thereto (e.g., from relational, hierarchical or other form), includes the steps of grouping subjects of at least selected ones of the triples based on commonality of at least portions of the identifiers of those subjects. It further includes grouping, for at least a selected subject groups, objects based on commonality of at least portions of identifiers of the predicates of those triples. Icons representing the subject and object groups can be displayed, e.g., on a computer monitor, or otherwise. A related aspect of the invention provides the additional step of displaying icons, e.g., directed arrows, indicating relationships among icons that represent subject group and icons that represent object groups. A display so generated is reminiscent of a directed graph—albeit a novel such graph that represents relationships among groups of subjects and objects, rather than directly between individual subjects and objects.

Description

[0001] This application is a continuation of U.S. patent application Ser. No. 10 / 138,725, filed May 3, 2002, entitled “Methods and Apparatus for Visualizing Relationships Among Triples of Resource Description Framework (RDF) Data Sets,” the teachings of which are incorporated herein by reference.BACKGROUND OF THE INVENTION [0002] The invention pertains to digital data processing and, more particularly, to methods and apparatus for data visualization. The invention has application, for example, in enterprise business visibility and insight using real-time reporting tools. [0003] It is not uncommon for a single company to have several database systems—separate systems not interfaced—to track internal and external planning and transaction data. Such systems might have been developed at different times throughout the history of the company and are therefore of differing generations of computer technology. For example, a marketing database system tracking customers may be ten years old, ...

Claims


Application Information

Patent Timeline
IPC IPC(8): G06F7/00G06F17/30
CPCG06F17/30716G06F17/30572G06F16/26G06F16/34
Inventor BIGWOOD, DAVIDBRITTON, COLIN P.GREENBLATT, ALANGREENBLATT, HOWARD
Owner NUTTER MCCLENNEN & FISH
Learn More