
Binning system for data analysis

a data analysis and data technology, applied in the field of data analysis, can solve the problems of complex databases, loss of interpretation, and modem world seeming flood, and achieve the effect of changing the way a user sees distributions, quick and easy examination and discovery

Inactive Publication Date: 2006-02-16
SPOTFIRE
View PDF10 Cites 34 Cited by
  • Summary
  • Abstract
  • Description
  • Claims
  • Application Information

AI Technical Summary

Benefits of technology

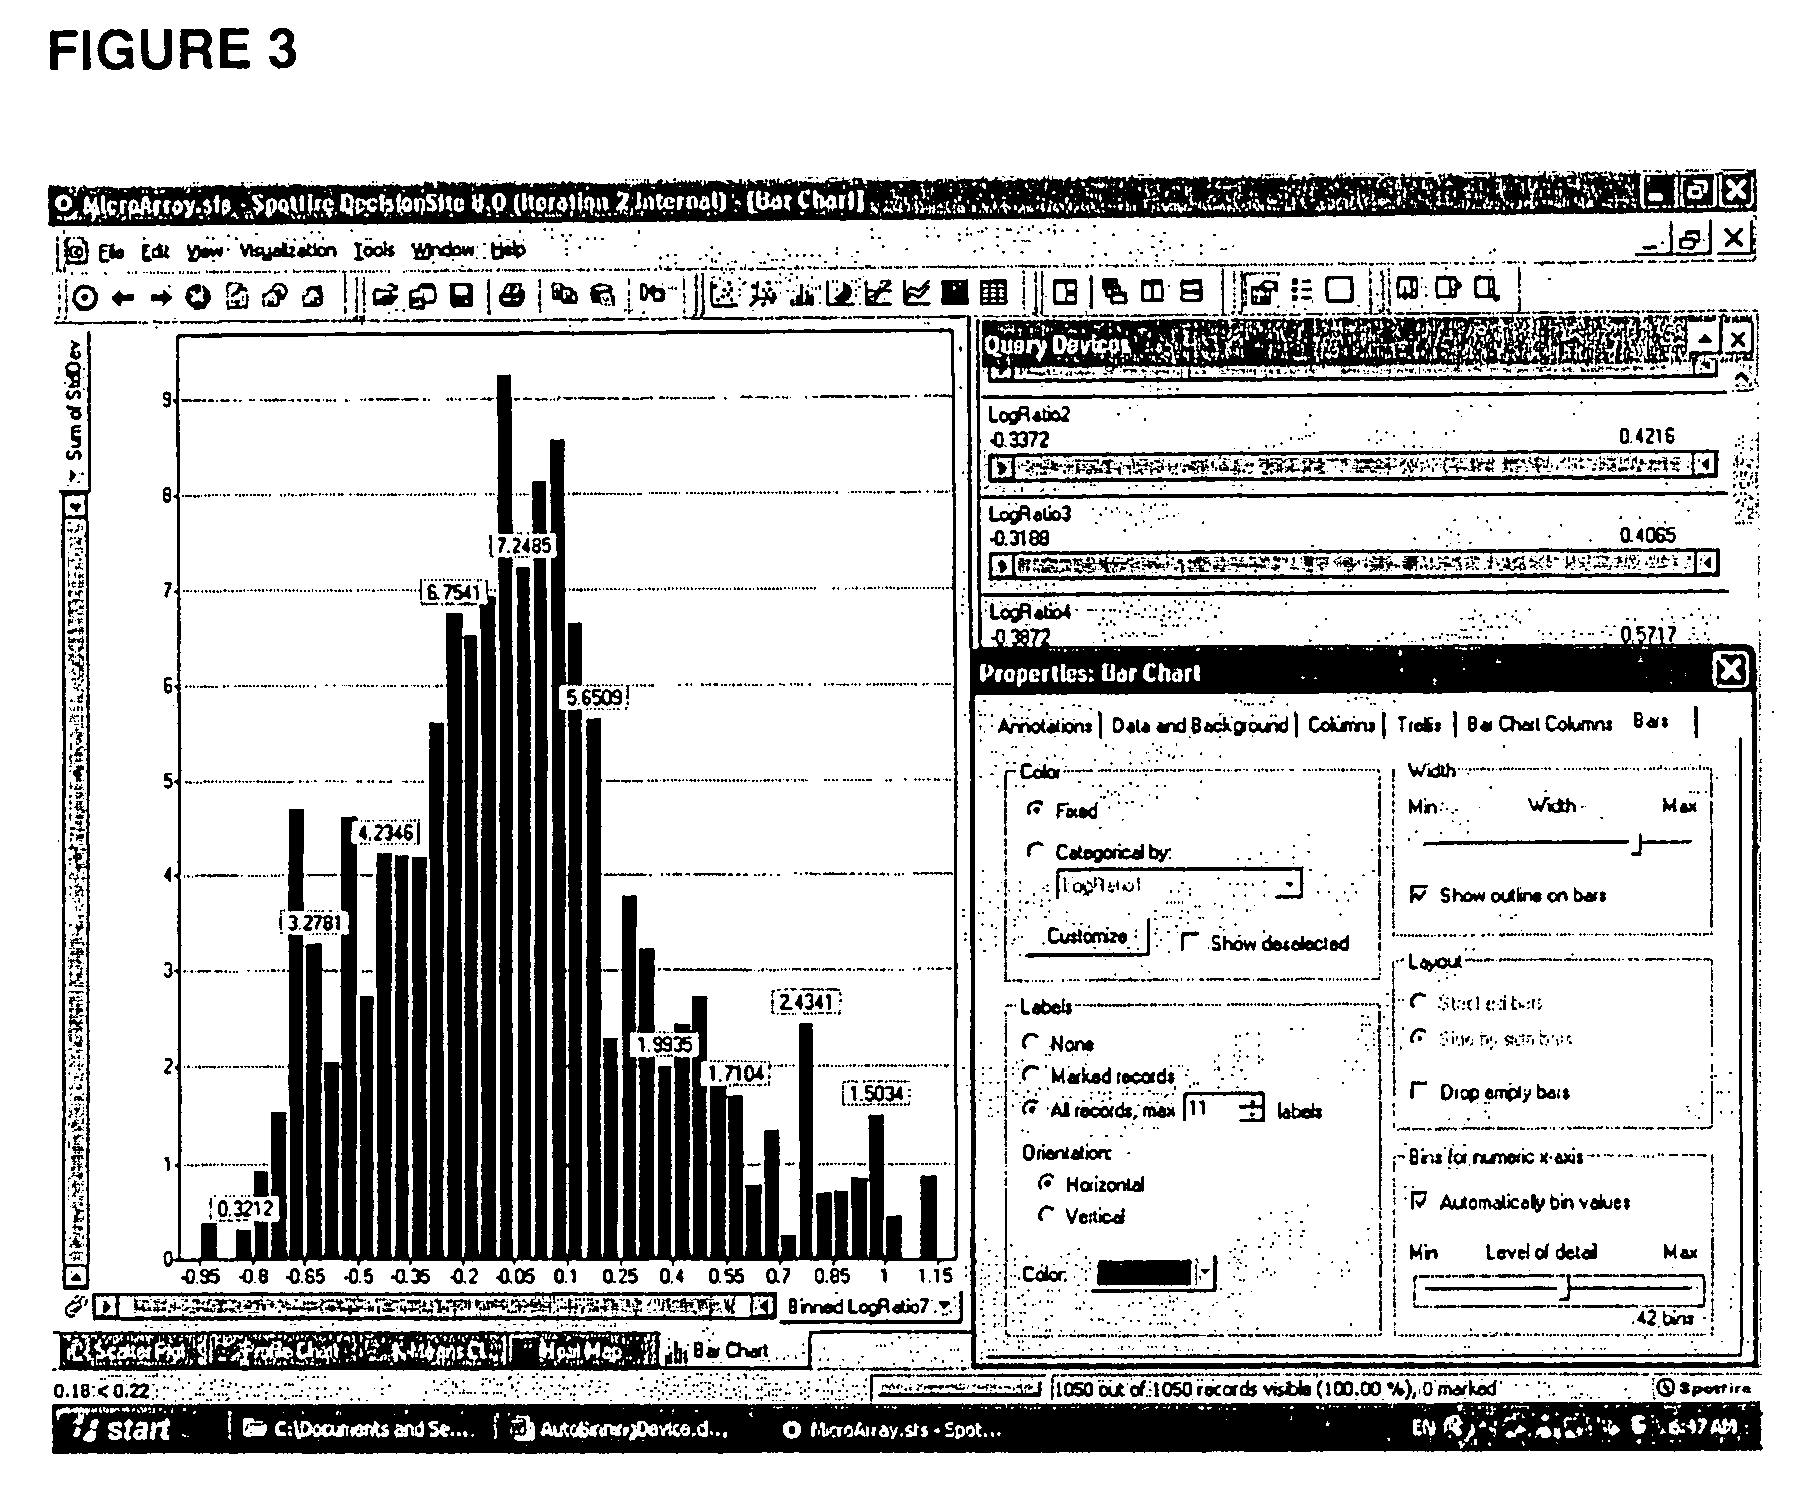
[0015] The inventor has discovered that rapidly adjusting the binning can dramatically change how a user sees distributions. This invention involves a mechanism that can allow a user to take advantage of this discovery.
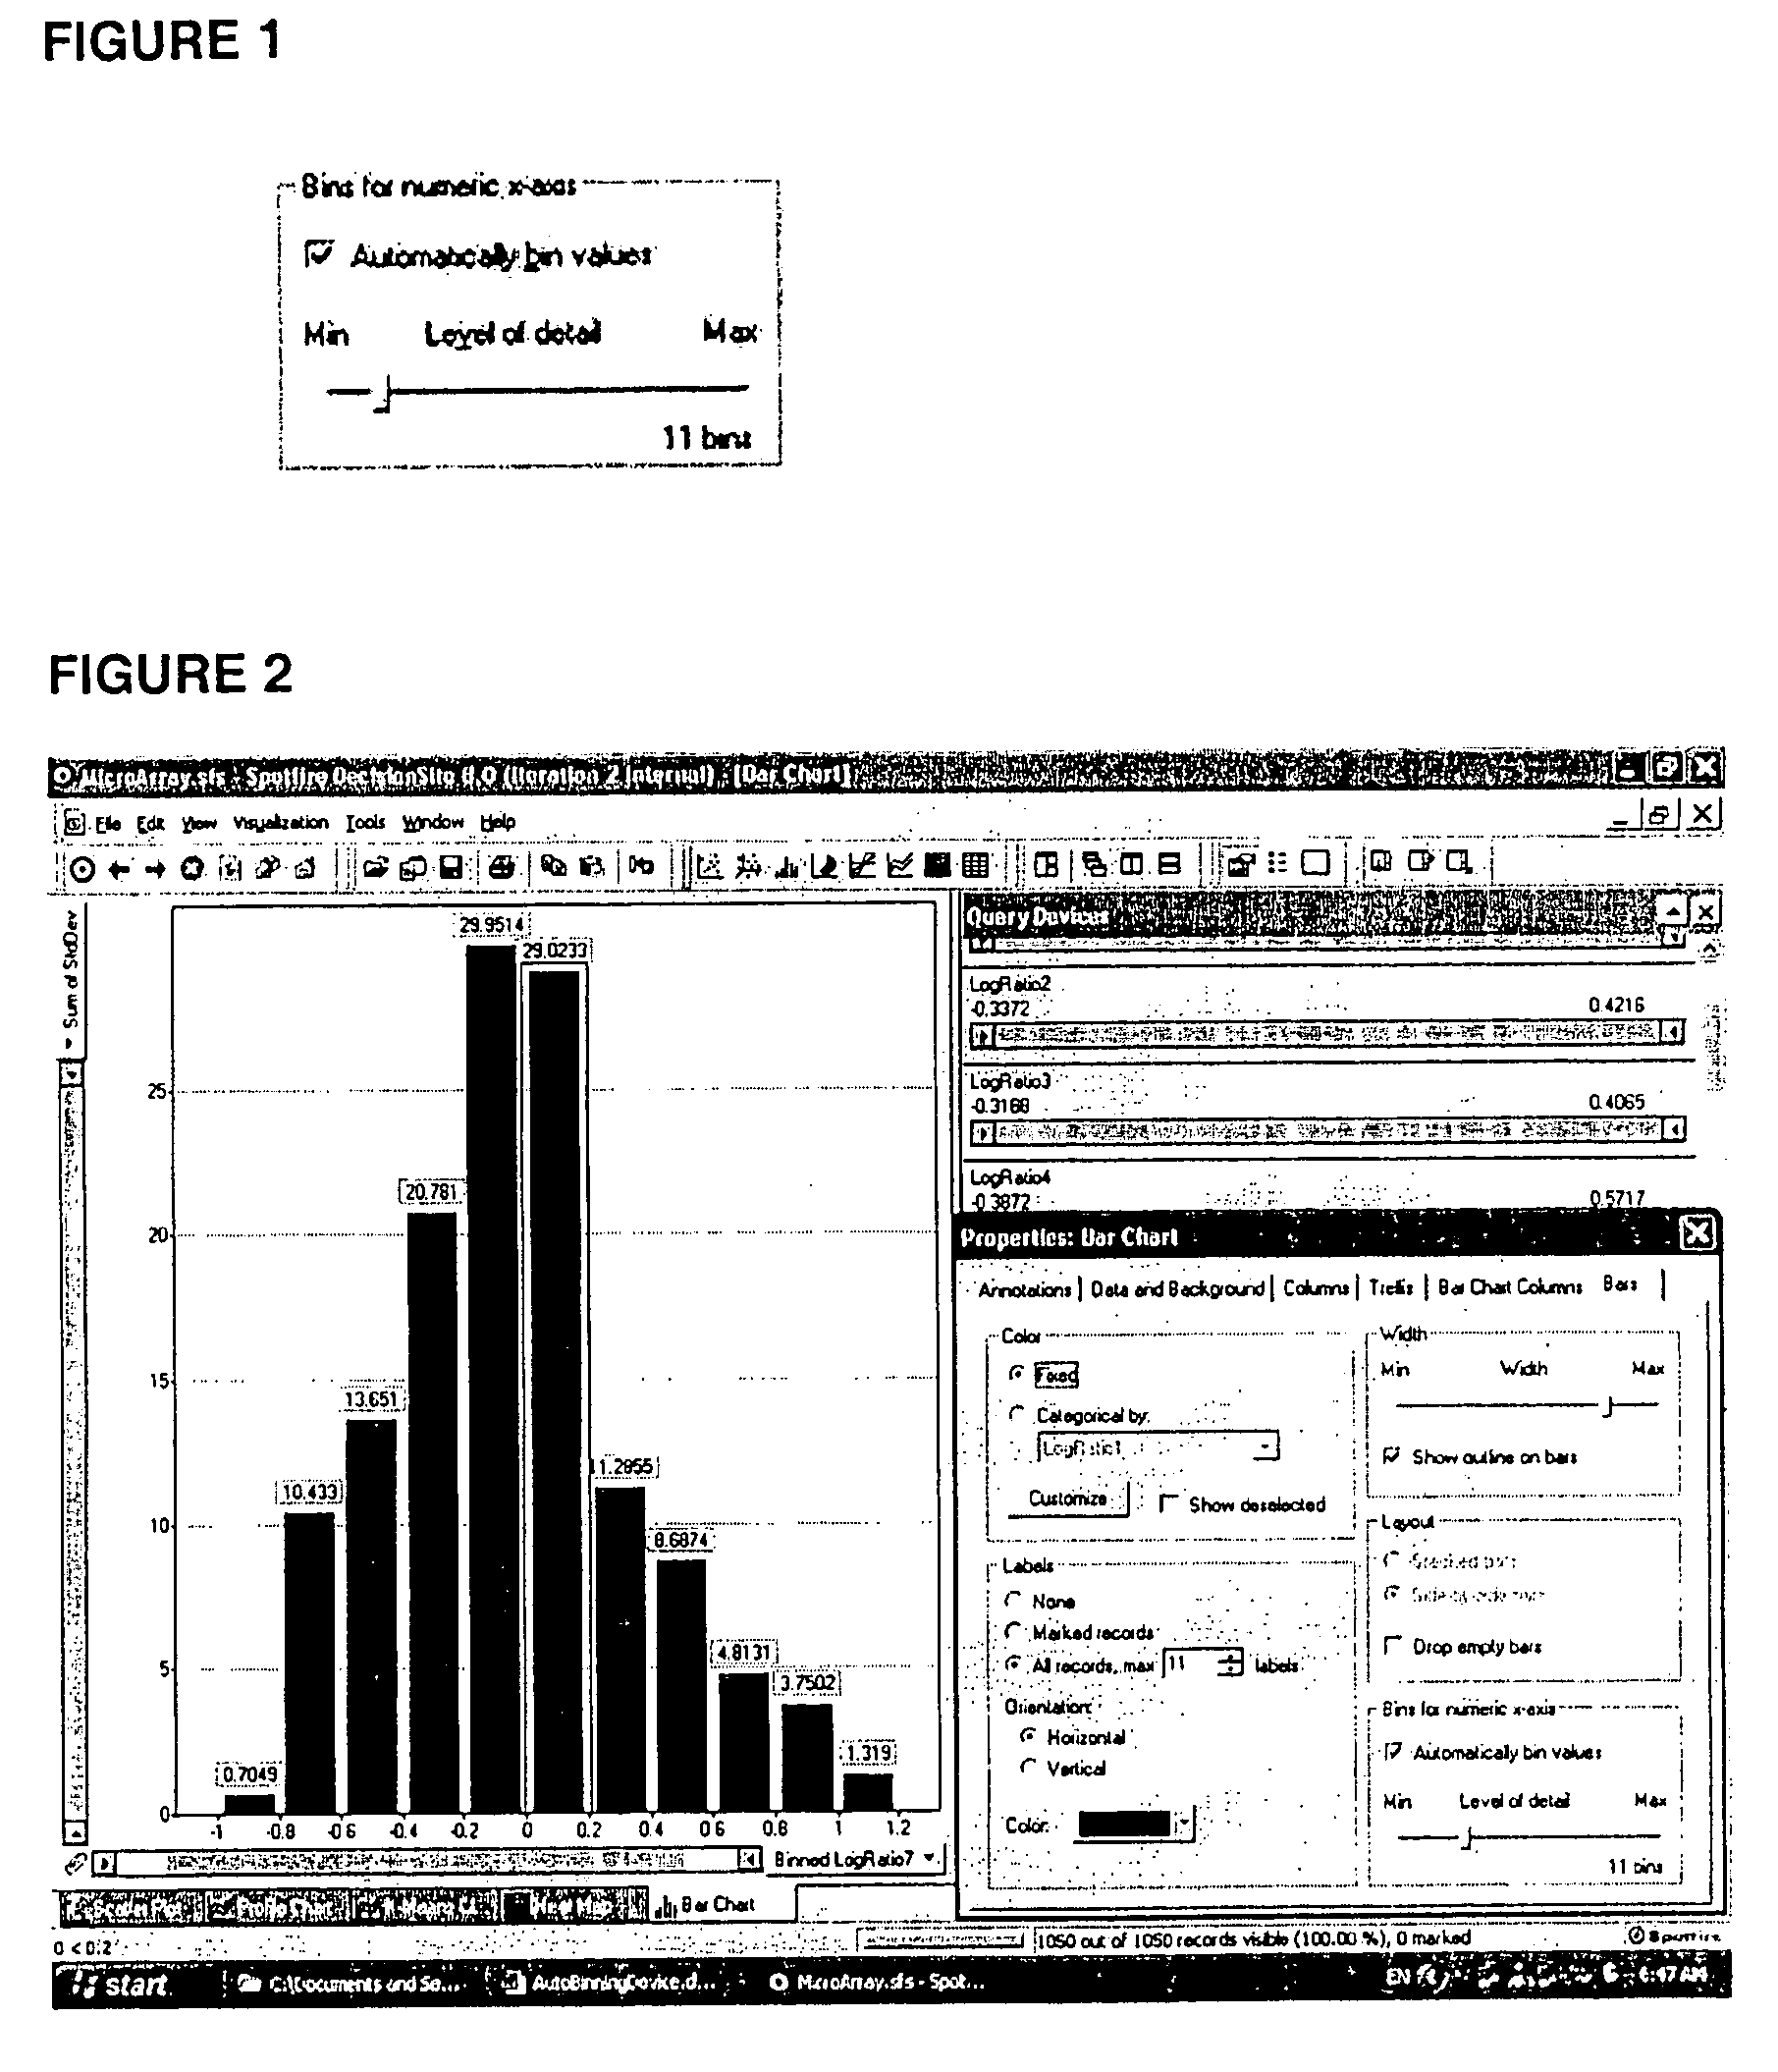
[0016] According to the invention, the number of bins (or, equivalently, bin width, level of detail, etc.) in a selected histogram can be made a user-adjustable parameter via a graphical query device such as a slider. This new approach can enable the user to quickly and easily examine and discover the constitution of the distribution represented by the histogram at multiple levels of detail and to locate local distribution maxima and minima that are hidden in views of fewer bins and higher level aggregations. Subtle patterns can thus be discovered in the data that traditional approaches tend not to reveal.

Problems solved by technology

The modem world is seemingly flooded with data but is often at a loss for interpreting it.
Using this software, often very complex databases can be queried.
But these individuals are typically highly trained and highly paid, and they can still spend long periods of time in their data analysis tasks.

Method used


Image

  • Binning system for data analysis
  • Binning system for data analysis
  • Binning system for data analysis

Examples


Embodiment Construction

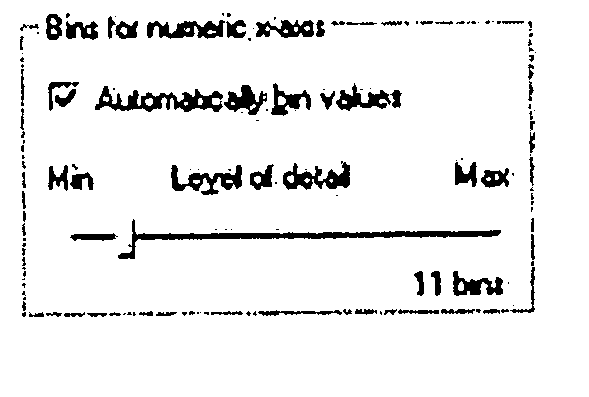
[0022] Referring to FIG. 1, an illustrative system according to the invention presents users with a window 10 that contains a slider 12, which allows a user to graphically adjust the number of bins in a given visualization. It also includes an “Automatically bin values” property checkbox 14. If this property is set, the values on the x-axis will be grouped together into bins of equal size. The bins will be generated so that they cover the values of the x-axis column and provide “nice” intervals, defined in any sense implemented by the system designer. In this embodiment, the number of bins generated will be less than a maximum number, which is set using the slider. If the “Automatically bin values” property is not set, the values on the x-axis will be interpreted as categorical values (i.e., just as if they were unique strings). The default behavior when creating bar charts or histograms using a numerical variable on the x-axis is preferably to automatically set up the bins and enab...


PUM


Abstract

A system for analyzing data from a database is disclosed. In one general aspect, a binned data representation window is operative to display a binned data representation including bin elements that each correspond to one or more values from the database. A binning control is responsive to user input to adjust the correspondence between bin elements and the values from the database. The binning control is available while the binned data representation window is displayed, and changes to the binning control cause corresponding changes to the binned data representation window.

Description

CROSS-REFERENCE TO RELATED APPLICATION [0001] This patent application claims the benefit under 35 U.S.C. § 119 (e) of U.S. provisional application No. 60 / 585,219, filed on Jul. 1, 2004, which is herein incorporated by reference.FIELD OF THE INVENTION [0002] This invention relates to the field of data analysis, including the design of data analysis and visualization systems. BACKGROUND OF THE INVENTION [0003] The modem world is seemingly flooded with data but is often at a loss for interpreting it. One exceptionally useful tool that has found wide acceptance is software that presents the data in some visual form, especially in a way that makes relationships noticeable. Using this software, often very complex databases can be queried. The results of the queries are then analyzed and displayed in some visual format, usually graphical, such as a bar or pie chart, scatter plot, or any of a large number of other well-known formats. Modem analysis tools then allow the user to dynamically a...

Claims


Application Information

Patent Timeline
Patent Type & Authority Applications(United States)
IPC IPC(8): G06F7/00
CPCG06F17/30554G06T11/206G06Q10/10G06F16/248
Inventor BAUERLE, LARSLUNDBERG, JOHANFORTES, TOMMYLUNDBERG, ANNA
Owner SPOTFIRE
Learn More