System and method for aggregation and analysis of information from multiple disparate sources while assuring source and record anonymity using an exchange hub

Active Publication Date: 2007-03-08
GRID ANALYTICS
View PDF30 Cites 51 Cited by
  • Summary
  • Abstract
  • Description
  • Claims
  • Application Information

AI Technical Summary

Benefits of technology

[0010] In response to these and other needs, the present invention provides a system and method for automated data analysis in which data agents are located and operate at each member site or data source (i.e., locally). These agents access stored data at the data source or member sites, process the data and also aggregate the results. The aggregated results from each of the member sites are then forwarded to and further aggregated at a central analytic hub. The central analytic hub contains a centralized application which can further aggregate each of the locally aggregated results and perform further analysis. These results are then deliver

Problems solved by technology

Although the issues are more perceived than real, since the beginning of electronic computing, organiza

Method used


Image

  • System and method for aggregation and analysis of information from multiple disparate sources while assuring source and record anonymity using an exchange hub
  • System and method for aggregation and analysis of information from multiple disparate sources while assuring source and record anonymity using an exchange hub
  • System and method for aggregation and analysis of information from multiple disparate sources while assuring source and record anonymity using an exchange hub

Examples


example 1

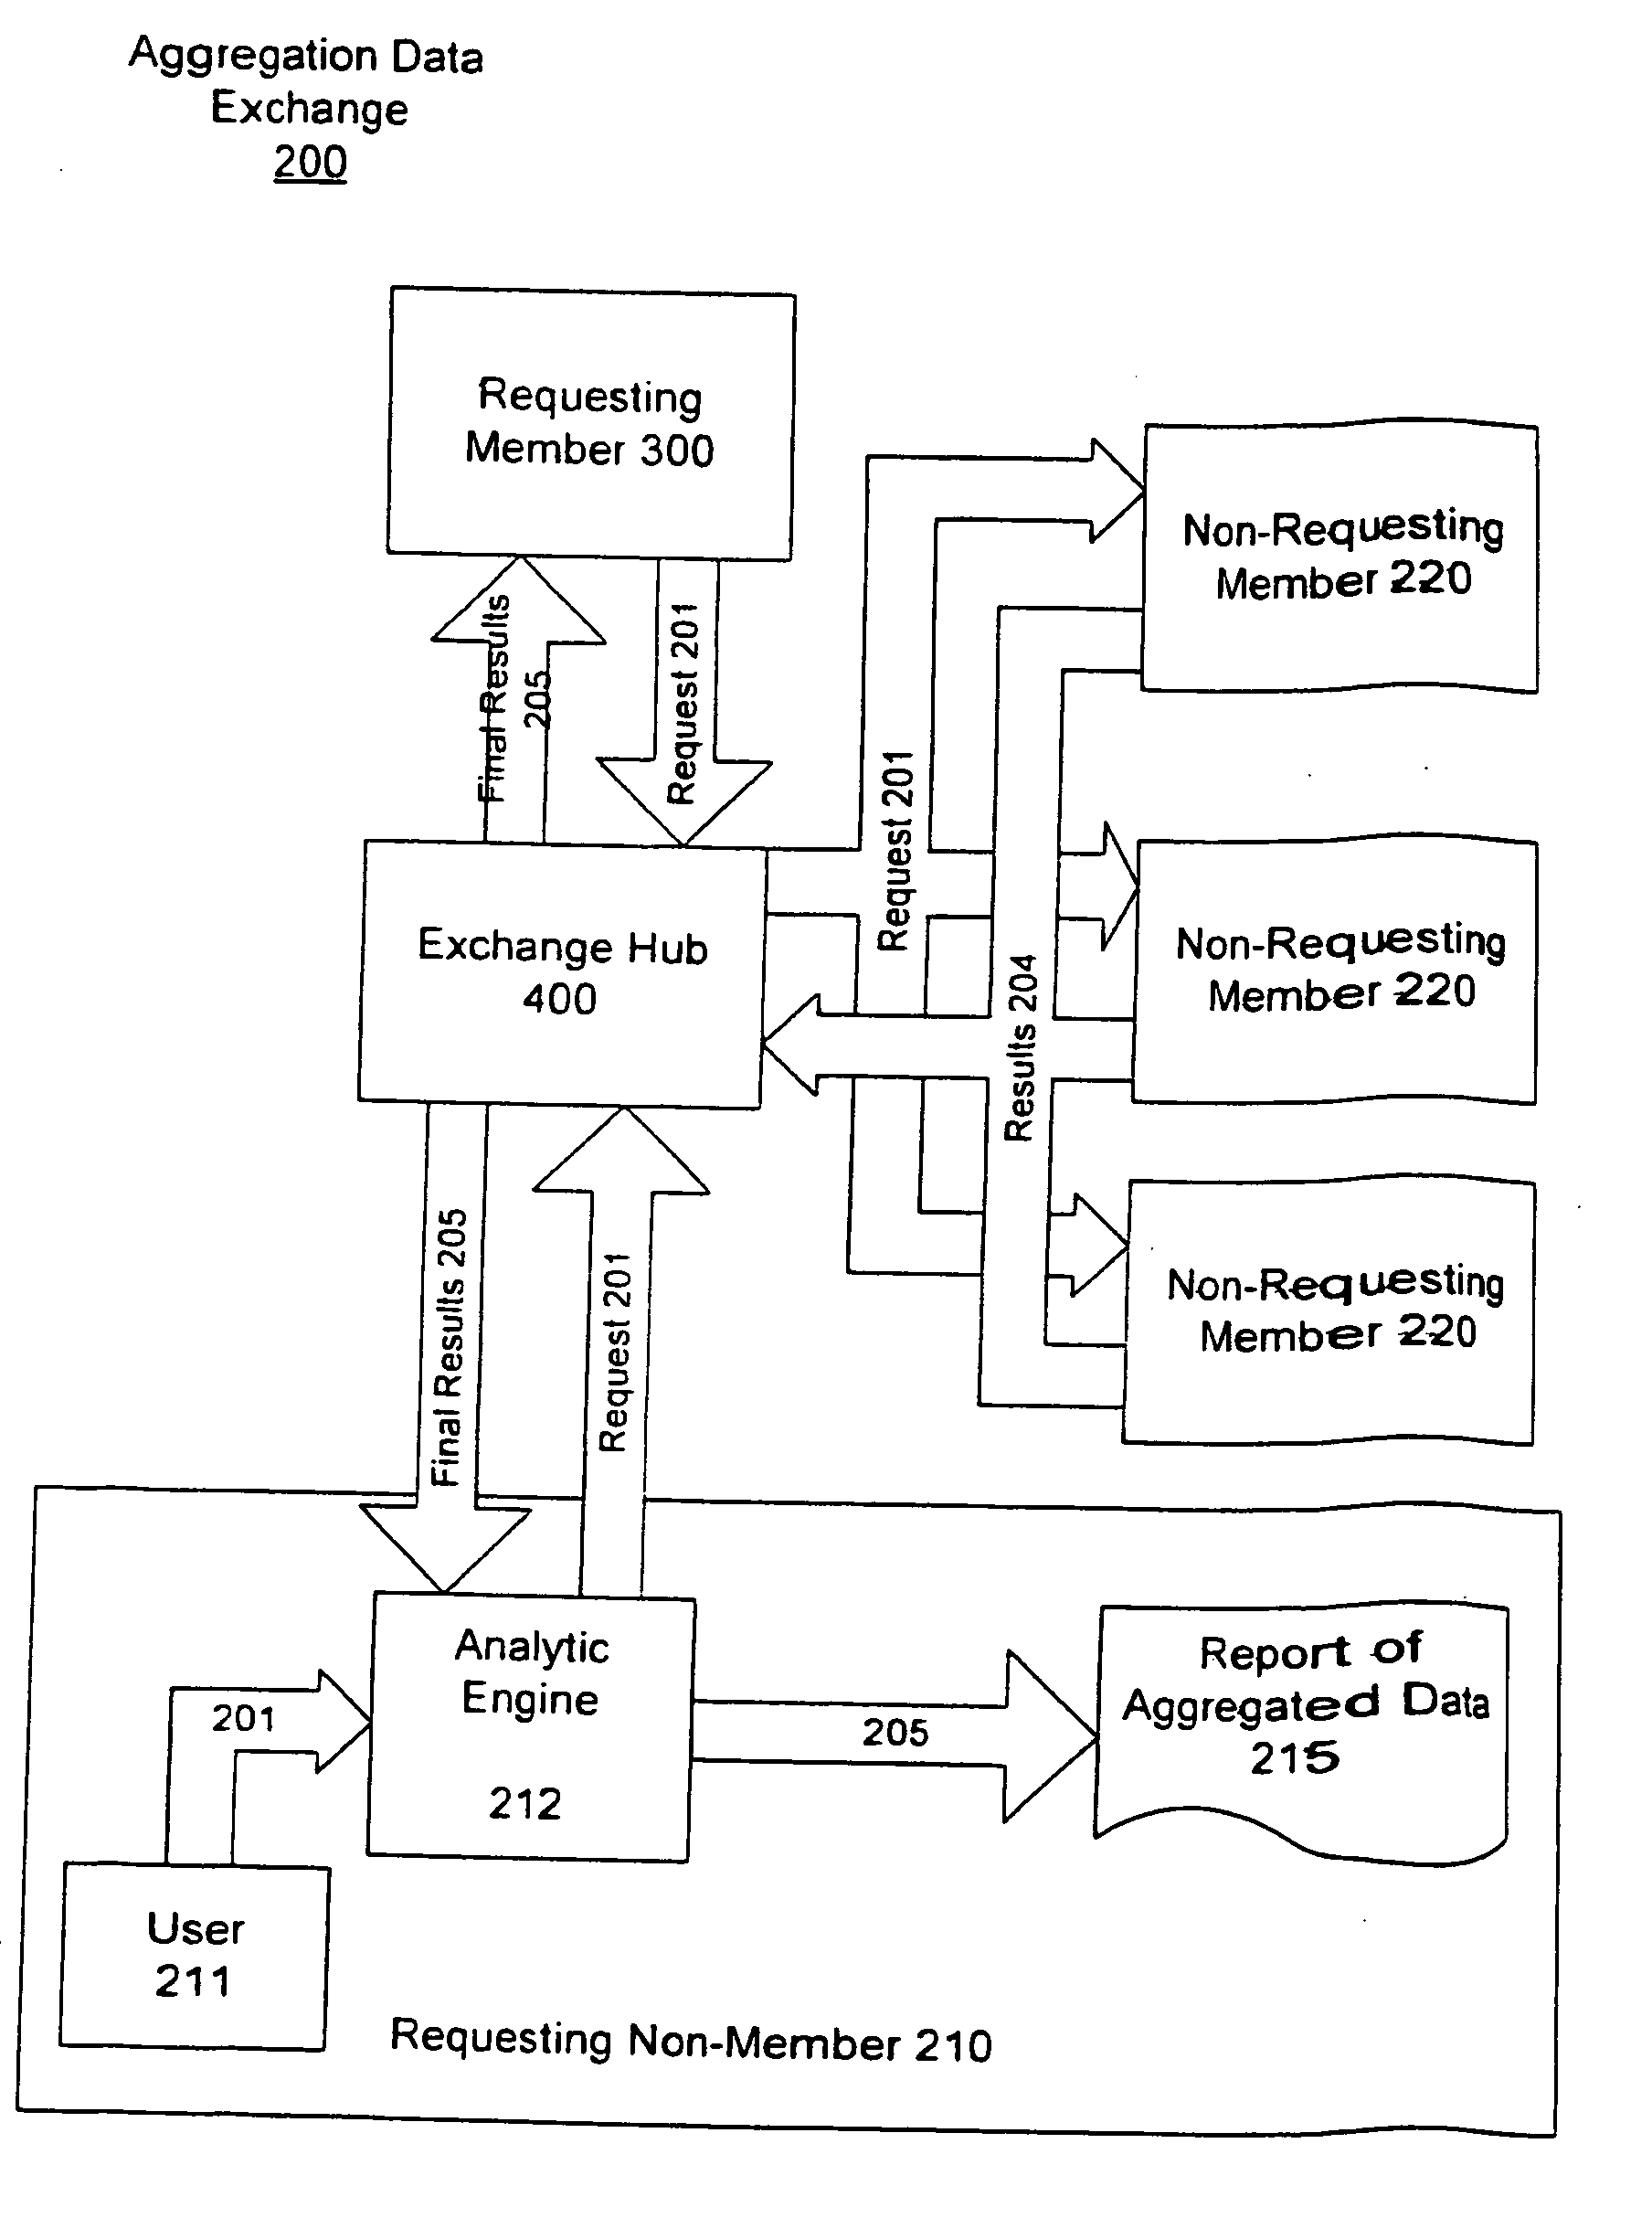
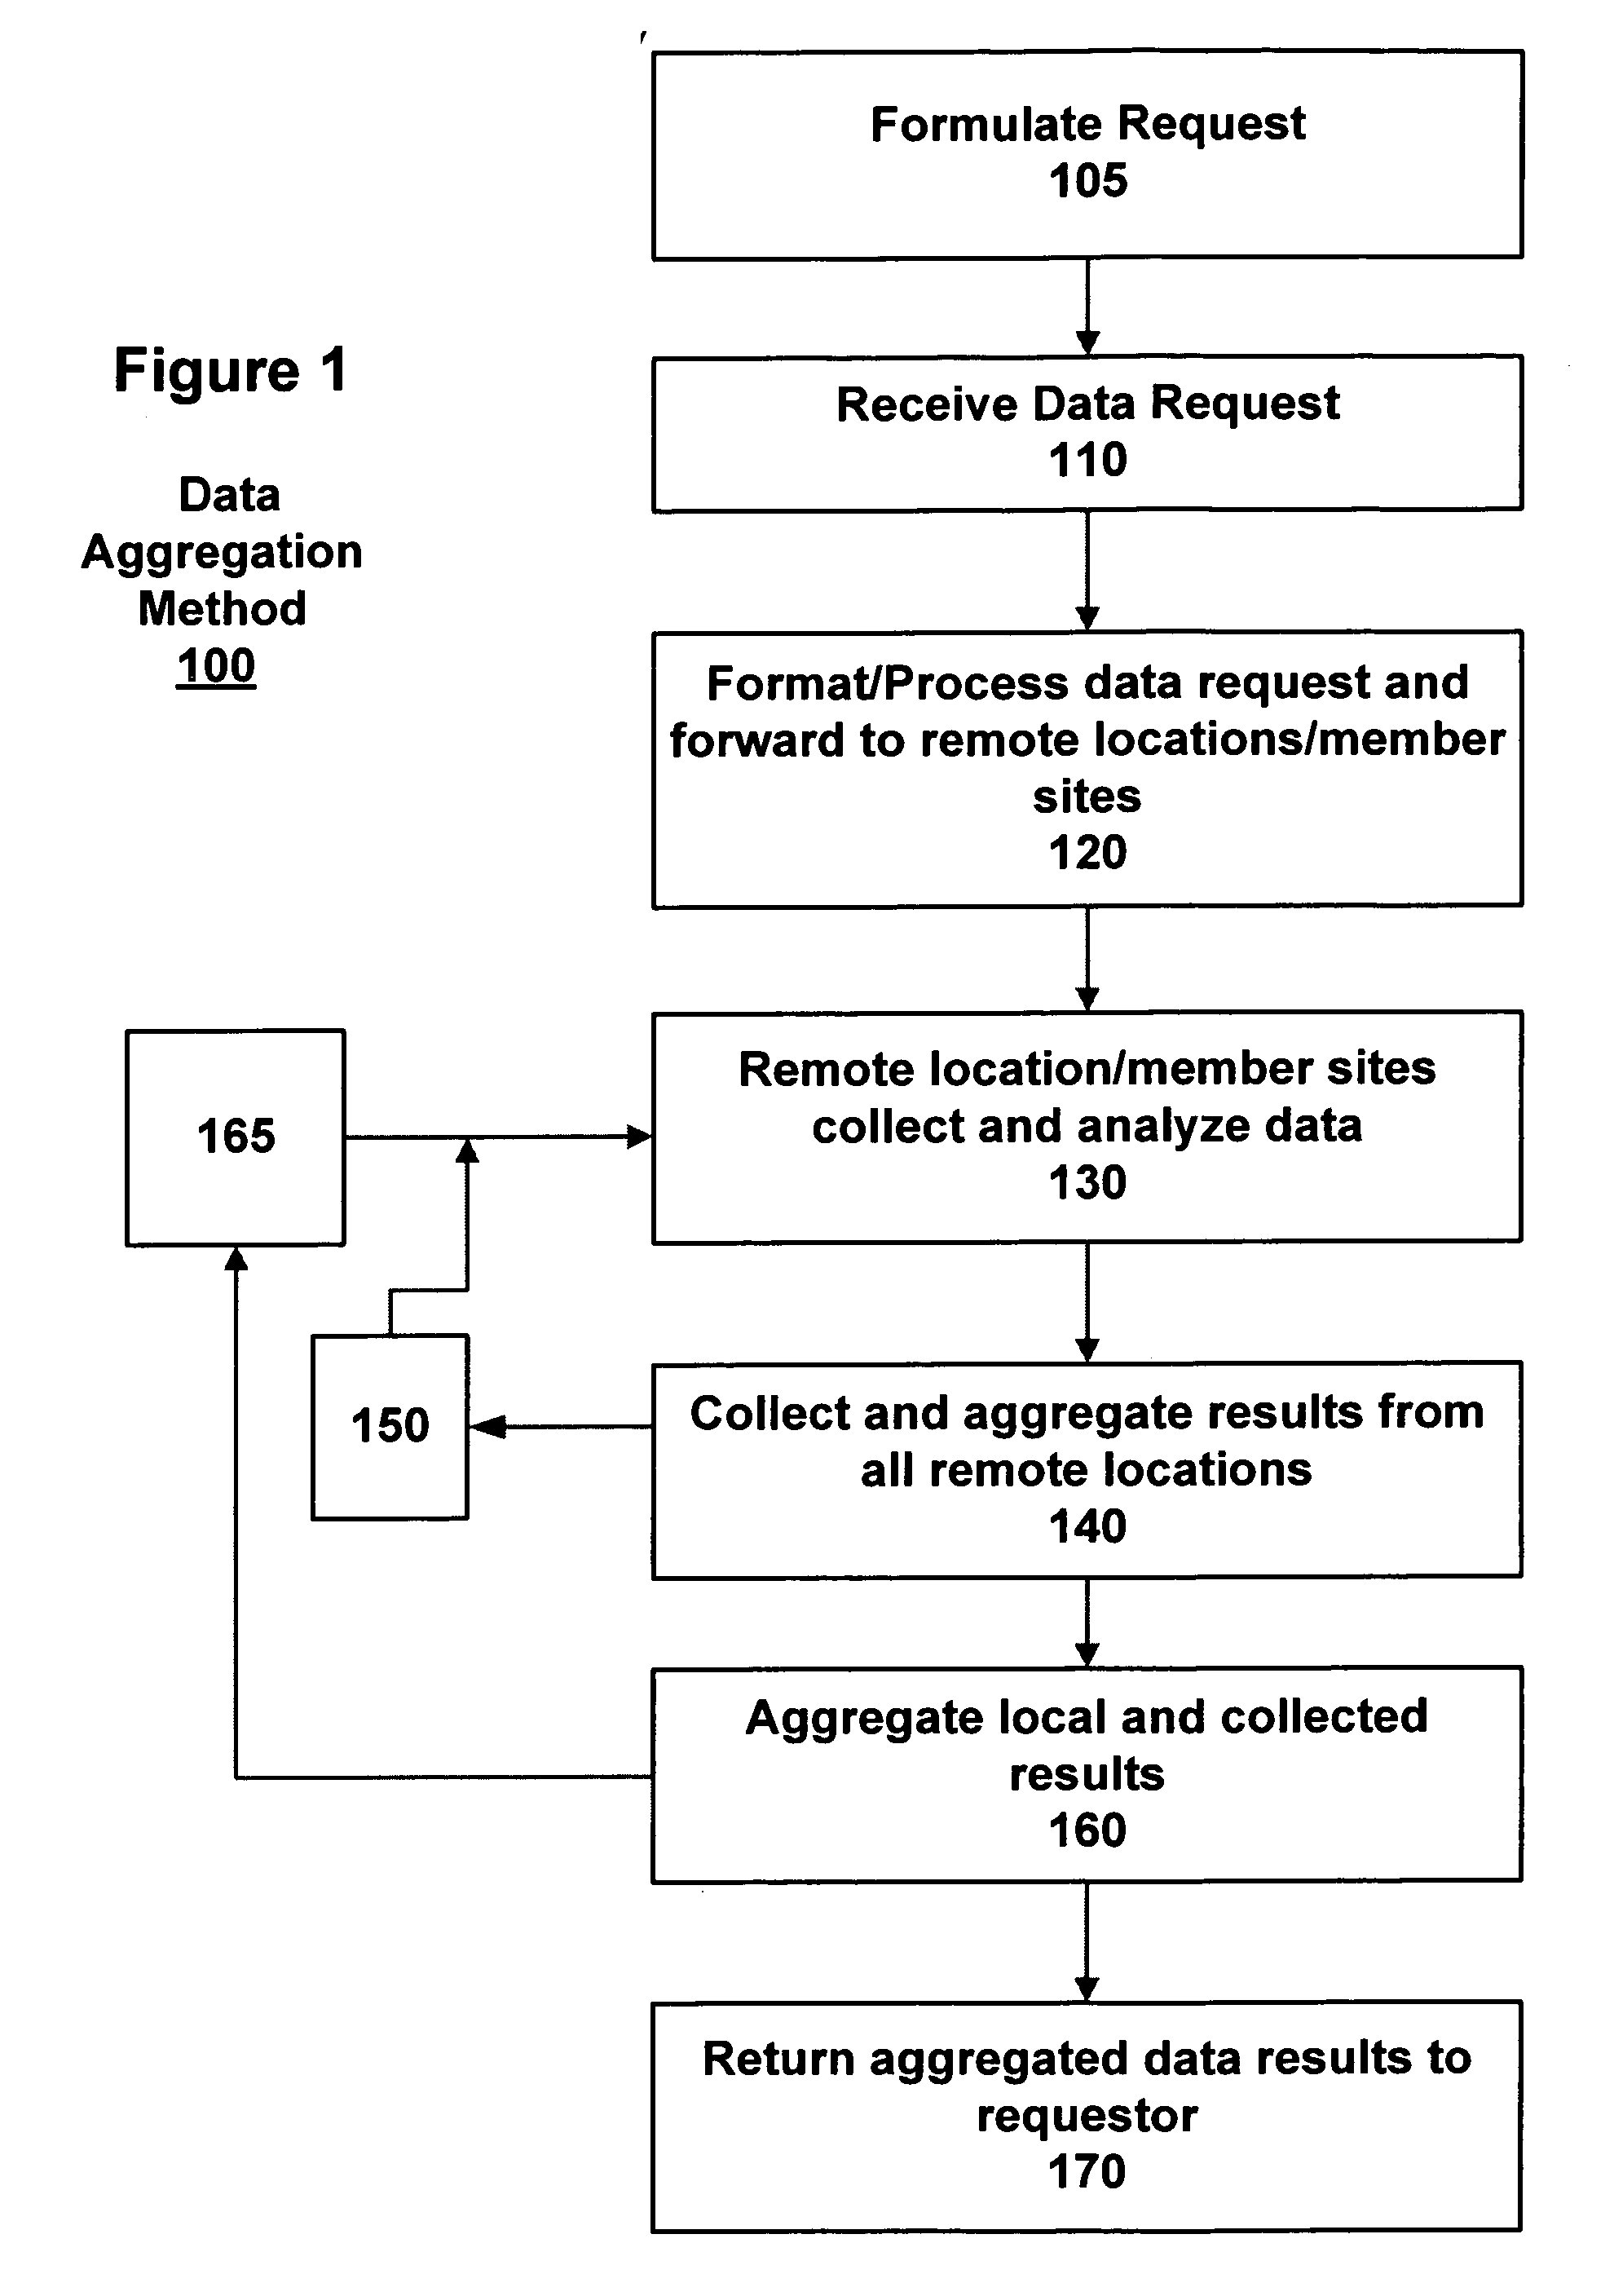
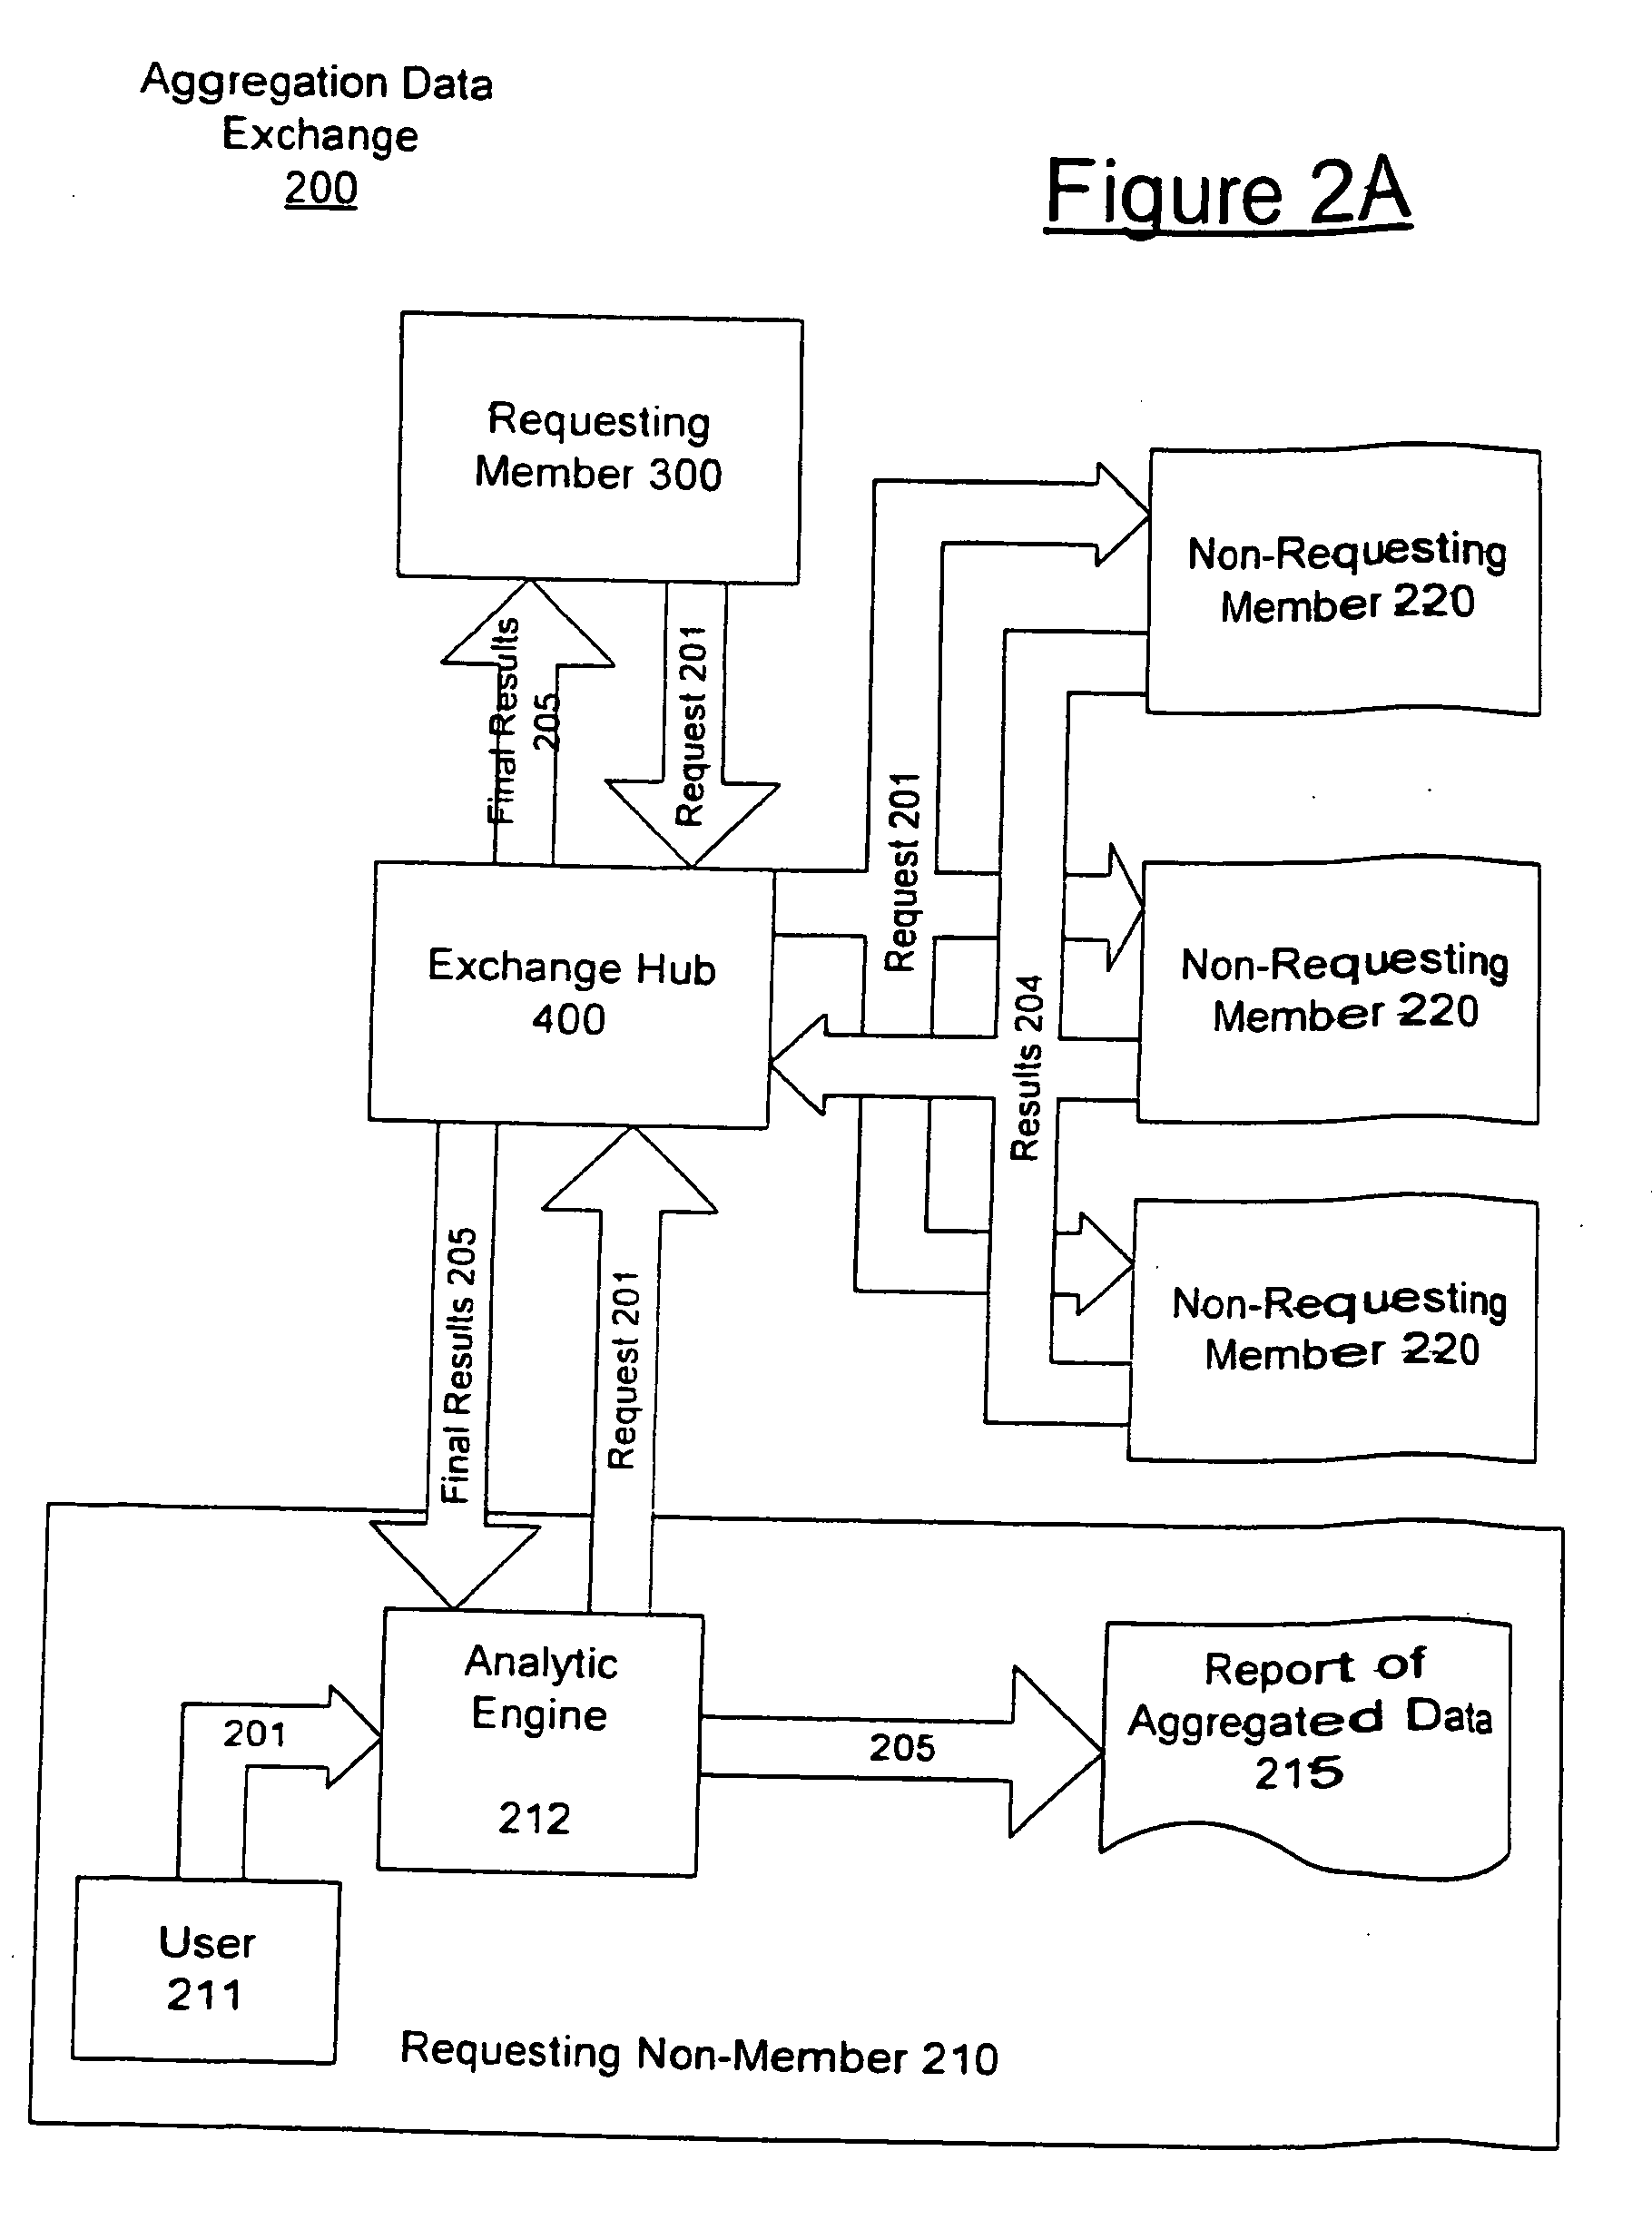
[0071] Which of the two competing brands of coronary stents (or other medical device) has the lowest complication rate? Typically, no hospital has enough data to answer the question definitively, but combining data from a number of hospitals could address. Accordingly, this type of question may be addressed using the data collection exchange 200 of the present invention. First, the question needs to be clarified and put in precise enough terms that the solution can be posed as a database query. This is a standard step, not related directly to the aggregation, but is more complicated, because the data can be represented differently at different sites. Types of questions to be defined in this example include: [0072] What events are considered complications? (e.g., consider thrombosis only) [0073] In what timeframe after implanting the stent must the event occur to be considered related? (e.g., 3 months). [0074] Are there other variables to be controlled for? (e.g., severity of illness...

example 2

[0084] The complication rates for two stents: In this case, the requester 210 / 300 wishes to know the relative complication rates of two stents, controlled for age and severity of disease. As in the previous example, the first step in the data collection and aggregation is to clarify the question. In this example, the question clarification requires specifying the strata to be used for age and severity. These criteria may differ for different requests and, consequently, may not be part of the common schema. For example, patients might be aggregated into the following age “bins” or categories: 30-40, 41-50, 51-60, 61-70, 71 and above. Similarly categories are then provided for severity of initial disease.

[0085] According to these questions at each data collection site 220, patients are counted by type of stent, age, and severity of disease. This stratification creates numerous subgroups. For example, if there are 5 age categories and three severity categories, then there are 15 subgr...


PUM


Abstract

The invention provides a system and method for automated data analysis in which data agents are located and operate at each member site or data source (i.e., locally). These agents access stored data at the data source or member sites, process the data and also aggregate the results. The aggregated results from each of the member sites are then forwarded to and further aggregated at a central analytic hub. The central analytic hub contains a centralized application which can further aggregate each of the aggregated results and perform a final analysis. These results are then delivered to the requester without any ability to identify individual data sources, or records from those sources.

Description

CROSS REFERENCE TO RELATED APPLICATIONS [0001] The present invention claims priority from co-pending U.S. Provisional Application No. 60 / 553,132 filed on Mar. 16, 2004, the subject matter of which is hereby incorporated by reference in full.STATEMENT REGARDING SPONSORED RESEARCH OR DEVELOPMENT [0002] Not Applicable. REFERENCE TO SEQUENCE LISTING [0003] Not Applicable. BACKGROUND OF THE INVENTION [0004] 1. Field of the Invention [0005] The present invention relates to a system and method for exchanging, integrating and analyzing information from multiple sources, without risking the divulging of potentially confidential information from any of those sources. Specifically, the present invention relates to the use of a data agent that collects, analyzes and aggregates information related to a data set of interest and forwards the results in a form that can be combined with like data from other sites, and without divulging confidential information contained in the data set. [0006] 2. Di...

Claims


Application Information

Patent Timeline
IPC IPC(8): G21C17/00G06F21/00
CPCG06Q30/04G06F21/6245
Inventor GOODERMOTE, DEANBLOOM, TOBYMILLER, DONALD R.
Owner GRID ANALYTICS
Why Eureka
Try Eureka