Capacity management index system and method

a capacity management index and index system technology, applied in the field of computing infrastructure index generation on a computer network, can solve the problems of undetermined relationship between business volume and actual infrastructure demand, unrigid methods, and inaccurate business volume forecasts

Active Publication Date: 2007-07-05
WELLS FARGO BANK NA
View PDF40 Cites 19 Cited by
  • Summary
  • Abstract
  • Description
  • Claims
  • Application Information

AI Technical Summary

Benefits of technology

[0010] A system and method that generates an index that provides predictive and actionable intelligence to ensure that a Technology Infrastructure Group can make tactical and strategic decisions in support of the needs of customers is provided. In particular, the invention measures the overall health of the infrastructure provided by the Technology Infrastructure Group, specifically with respect to how efficiently the Technology Infrastructure Group's various services meet the demand placed upon their capacity by various Lines of Business. The invention provides an overall assessment of infrastructure capacity management and can then drill

Problems solved by technology

Business volume forecasts have been historically inaccurate for a number of reasons.
Relationships of business volumes to actual demand on infrastructure have not been determined to a fine enough aspect to make strategic decisions on capacity management.
Business volume is currently predicted using methods that are not rigorous.
As corporation's technology infrast

Method used


Image

  • Capacity management index system and method
  • Capacity management index system and method
  • Capacity management index system and method

Examples


example expanded

Equation

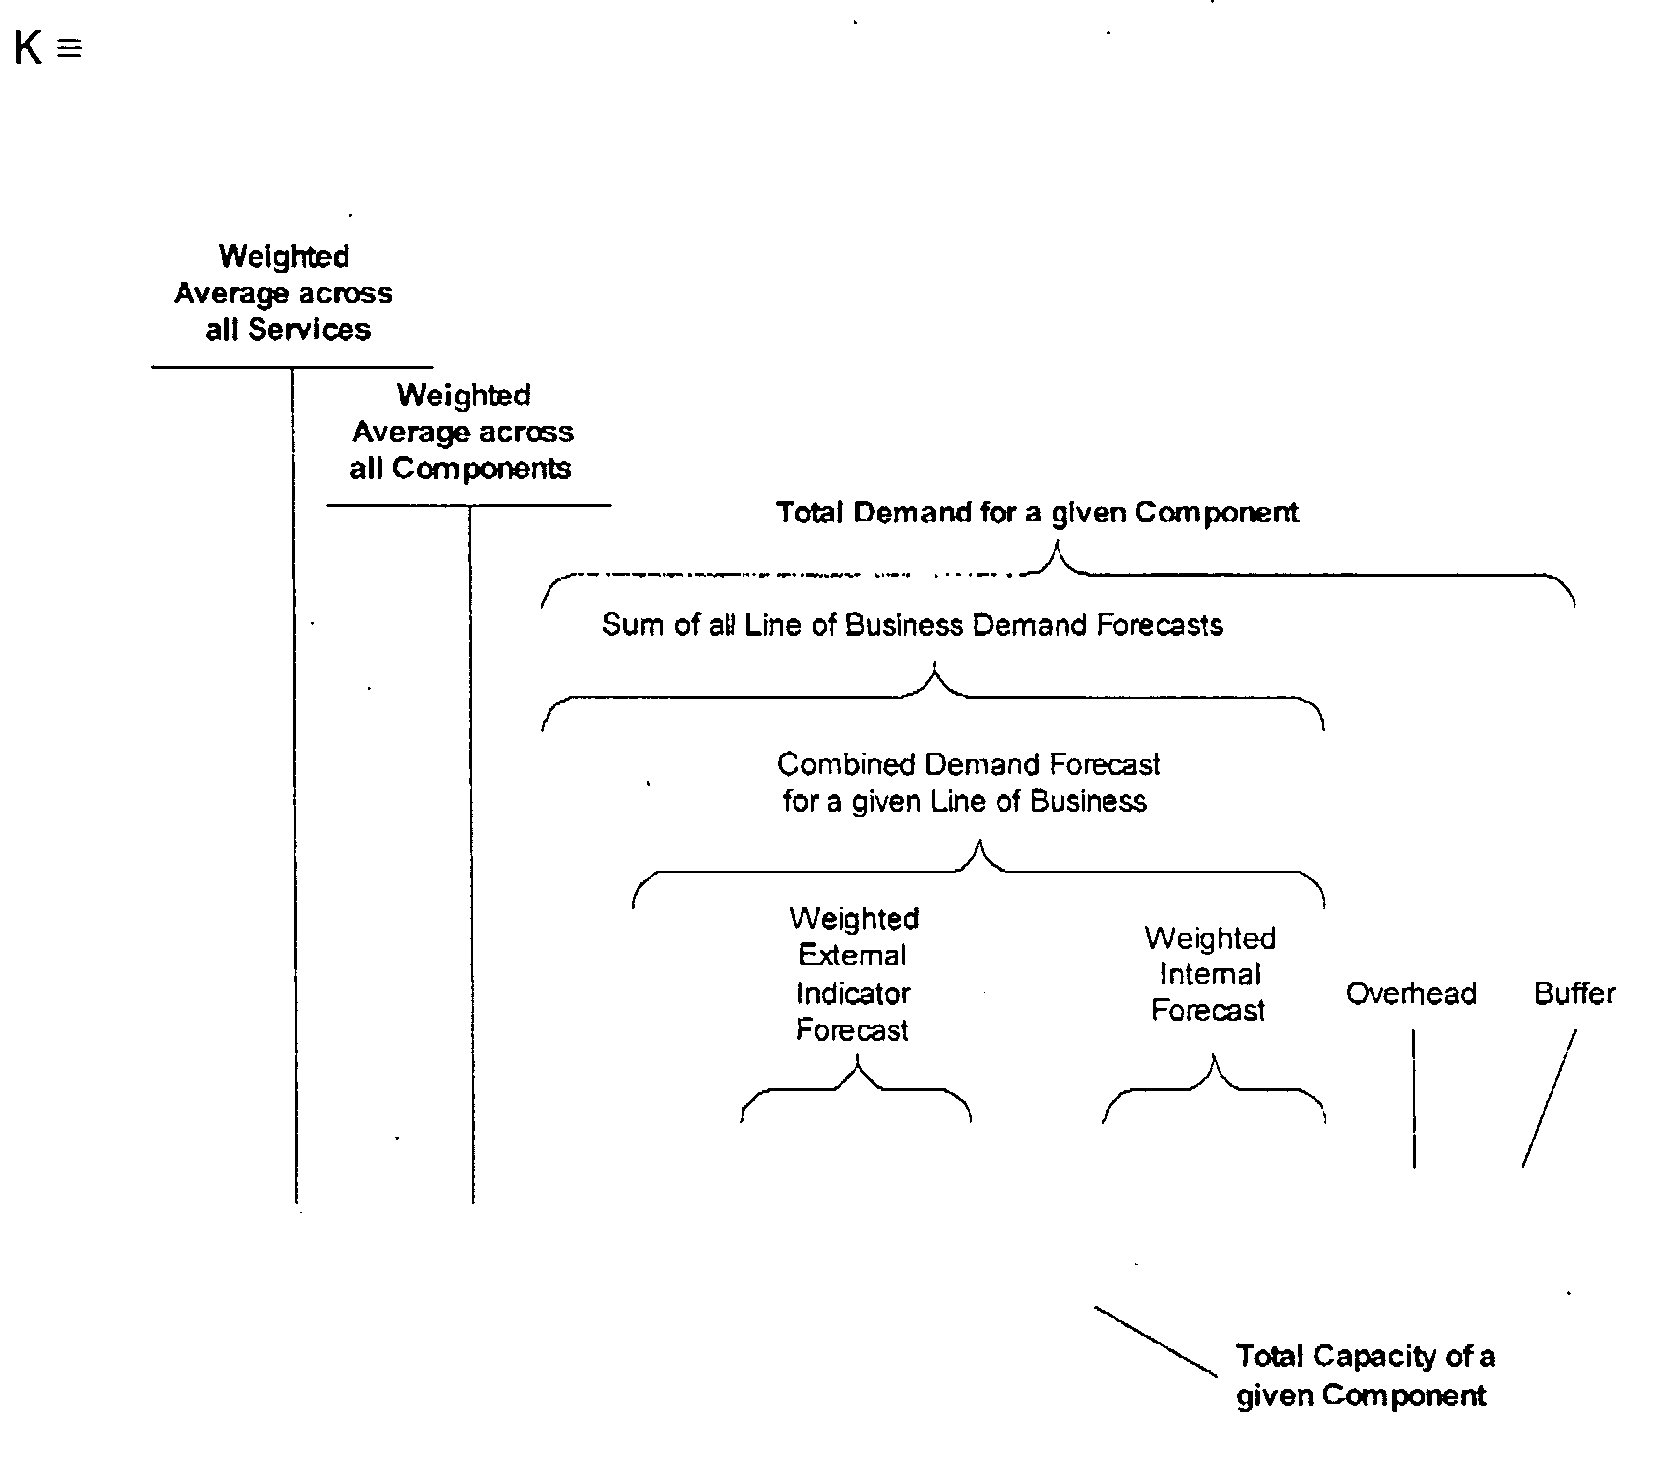
[0156] Hereinbelow is an example of an expanded equation for each Component Index, CI. This example shows the LOB demand upon specific components of one of Wells Fargo's infrastructure groups: Hardware Capacity & Storage Management. This equation can be applied to all of the infrastructure groups.

[0157] At the highest level, the index can be shown as: CMI=∑1i⁢Wi⁢CIi=f⁡(Dlob,Dolh,Dbfr,CCtot,Fqual)f=<tbd>⁢CIi=Wi⁡[ComponentDemand / ComponentCapacity]=Wi⁢∑i1⁢SCIi

where: [0158] CMI=Capacity Management Index; [0159] CI=Infrastructure Component Capacity Index; [0160] SCI=Subcomponent Capacity Index; [0161] Wi=Weighting factor; and [0162] Fqual=Qualitative Factors, i.e. management of component, changes to infrastructure, etc.

[0163] An expanded equation for each CI (Hardware Capacity and Storage as an example) is as follows:

CIhc=Whc[AVERAGE{[WMainframe CPU(CFISG(Dext+Dint)ISG+CFWS(Dext+Dint)WS+CFPCS(Dext+Dint)PCS+CFMG(Dext+Dint)MG+Do / h+Dbfr) / (CCtot)Mainframe CPU], [WMidframe(C...

an example implementation

OF AN EMBODIMENT OF THE INVENTION

[0249] The section provides the specific results obtained during a limited scope of a Proof of Concept example implementation of an embodiment of the invention. The analysis of these results, issues encountered in the development of the model, and general conclusions about the model are discussed hereinbelow. In particular, the following sections discuss a spreadsheet model developed during the Proof of Concept, including: [0250] Scope of the spreadsheet model in terms of Lines of Business and infrastructure Services; [0251] Facts regarding various aspects of the spreadsheet model; [0252] Assumptions made to demonstrate the function of the spreadsheet model; [0253] Results obtained with the spreadsheet model; [0254] Analysis of the results obtained with the spreadsheet model; [0255] Issues encountered in developing the spreadsheet model; and [0256] Conclusions drawn about the spreadsheet model.

Scope

[0257] This section defines the scope of a spread...


PUM


Abstract

A system and method is provided that generates an index, providing predictive and actionable intelligence to ensure that a Technology Infrastructure Group (TIG) makes tactical and strategic decisions in support of needs of customers. The invention measures overall health of an infrastructure, specifically with respect to how efficiently various services meet demand placed upon capacity by various Lines of Business. The invention provides an overall assessment of infrastructure capacity management and drills down to various services, components, subcomponents, etc. The invention provides a forecasting tool in which estimates made are not based only upon business forecasts provided by each Line of Business, but also upon forecasts developed by correlating external indicators with historical business volumes. Historical forecasts are compared to actual values to derive a confidence factor used for weighting future Line of Business forecasts. The combined, weighted forecasts obtained are more robust than any individual forecasts on their own.

Description

BACKGROUND OF THE INVENTION [0001] 1. Technical Field [0002] The invention relates to generating on a computer network an infrastructure index. More particularly, the invention relates to a system and method on a computer network for generating an index that provides predictive and actionable intelligence to a technology infrastructure group to make tactical and strategic decisions. [0003] 2. Description of the Prior Art [0004] Business volume forecasts have been historically inaccurate for a number of reasons. Relationships of business volumes to actual demand on infrastructure have not been determined to a fine enough aspect to make strategic decisions on capacity management. Business volume is currently predicted using methods that are not rigorous. Therefore, demand on infrastructure is subsequently predicted using these forecasts and straight line trending. [0005] As corporation's technology infrastructure becomes larger and more complex, the ability to match demand with capaci...

Claims


Application Information

Patent Timeline
IPC IPC(8): G06F17/30
CPCG06Q10/0637G06Q30/0202G06Q10/10
Inventor GILPIN, BRIAN M.REBER, GREGORY ALAN
Owner WELLS FARGO BANK NA
Why Eureka
Try Eureka