Method of tracing back the execution path in a debugger

a debugger and execution path technology, applied in the field of debugging software, can solve problems such as the possibility of introducing “bugs”, the program entering an unexpected state, and the user often finding that the program has entered an unexpected sta

Inactive Publication Date: 2007-07-19
IBM CORP
View PDF3 Cites 31 Cited by
  • Summary
  • Abstract
  • Description
  • Claims
  • Application Information

AI Technical Summary

Problems solved by technology

Inherent in any software development technique is the potential for introducing “bugs”.
A bug will typically cause unexpected results during the execution of the program.
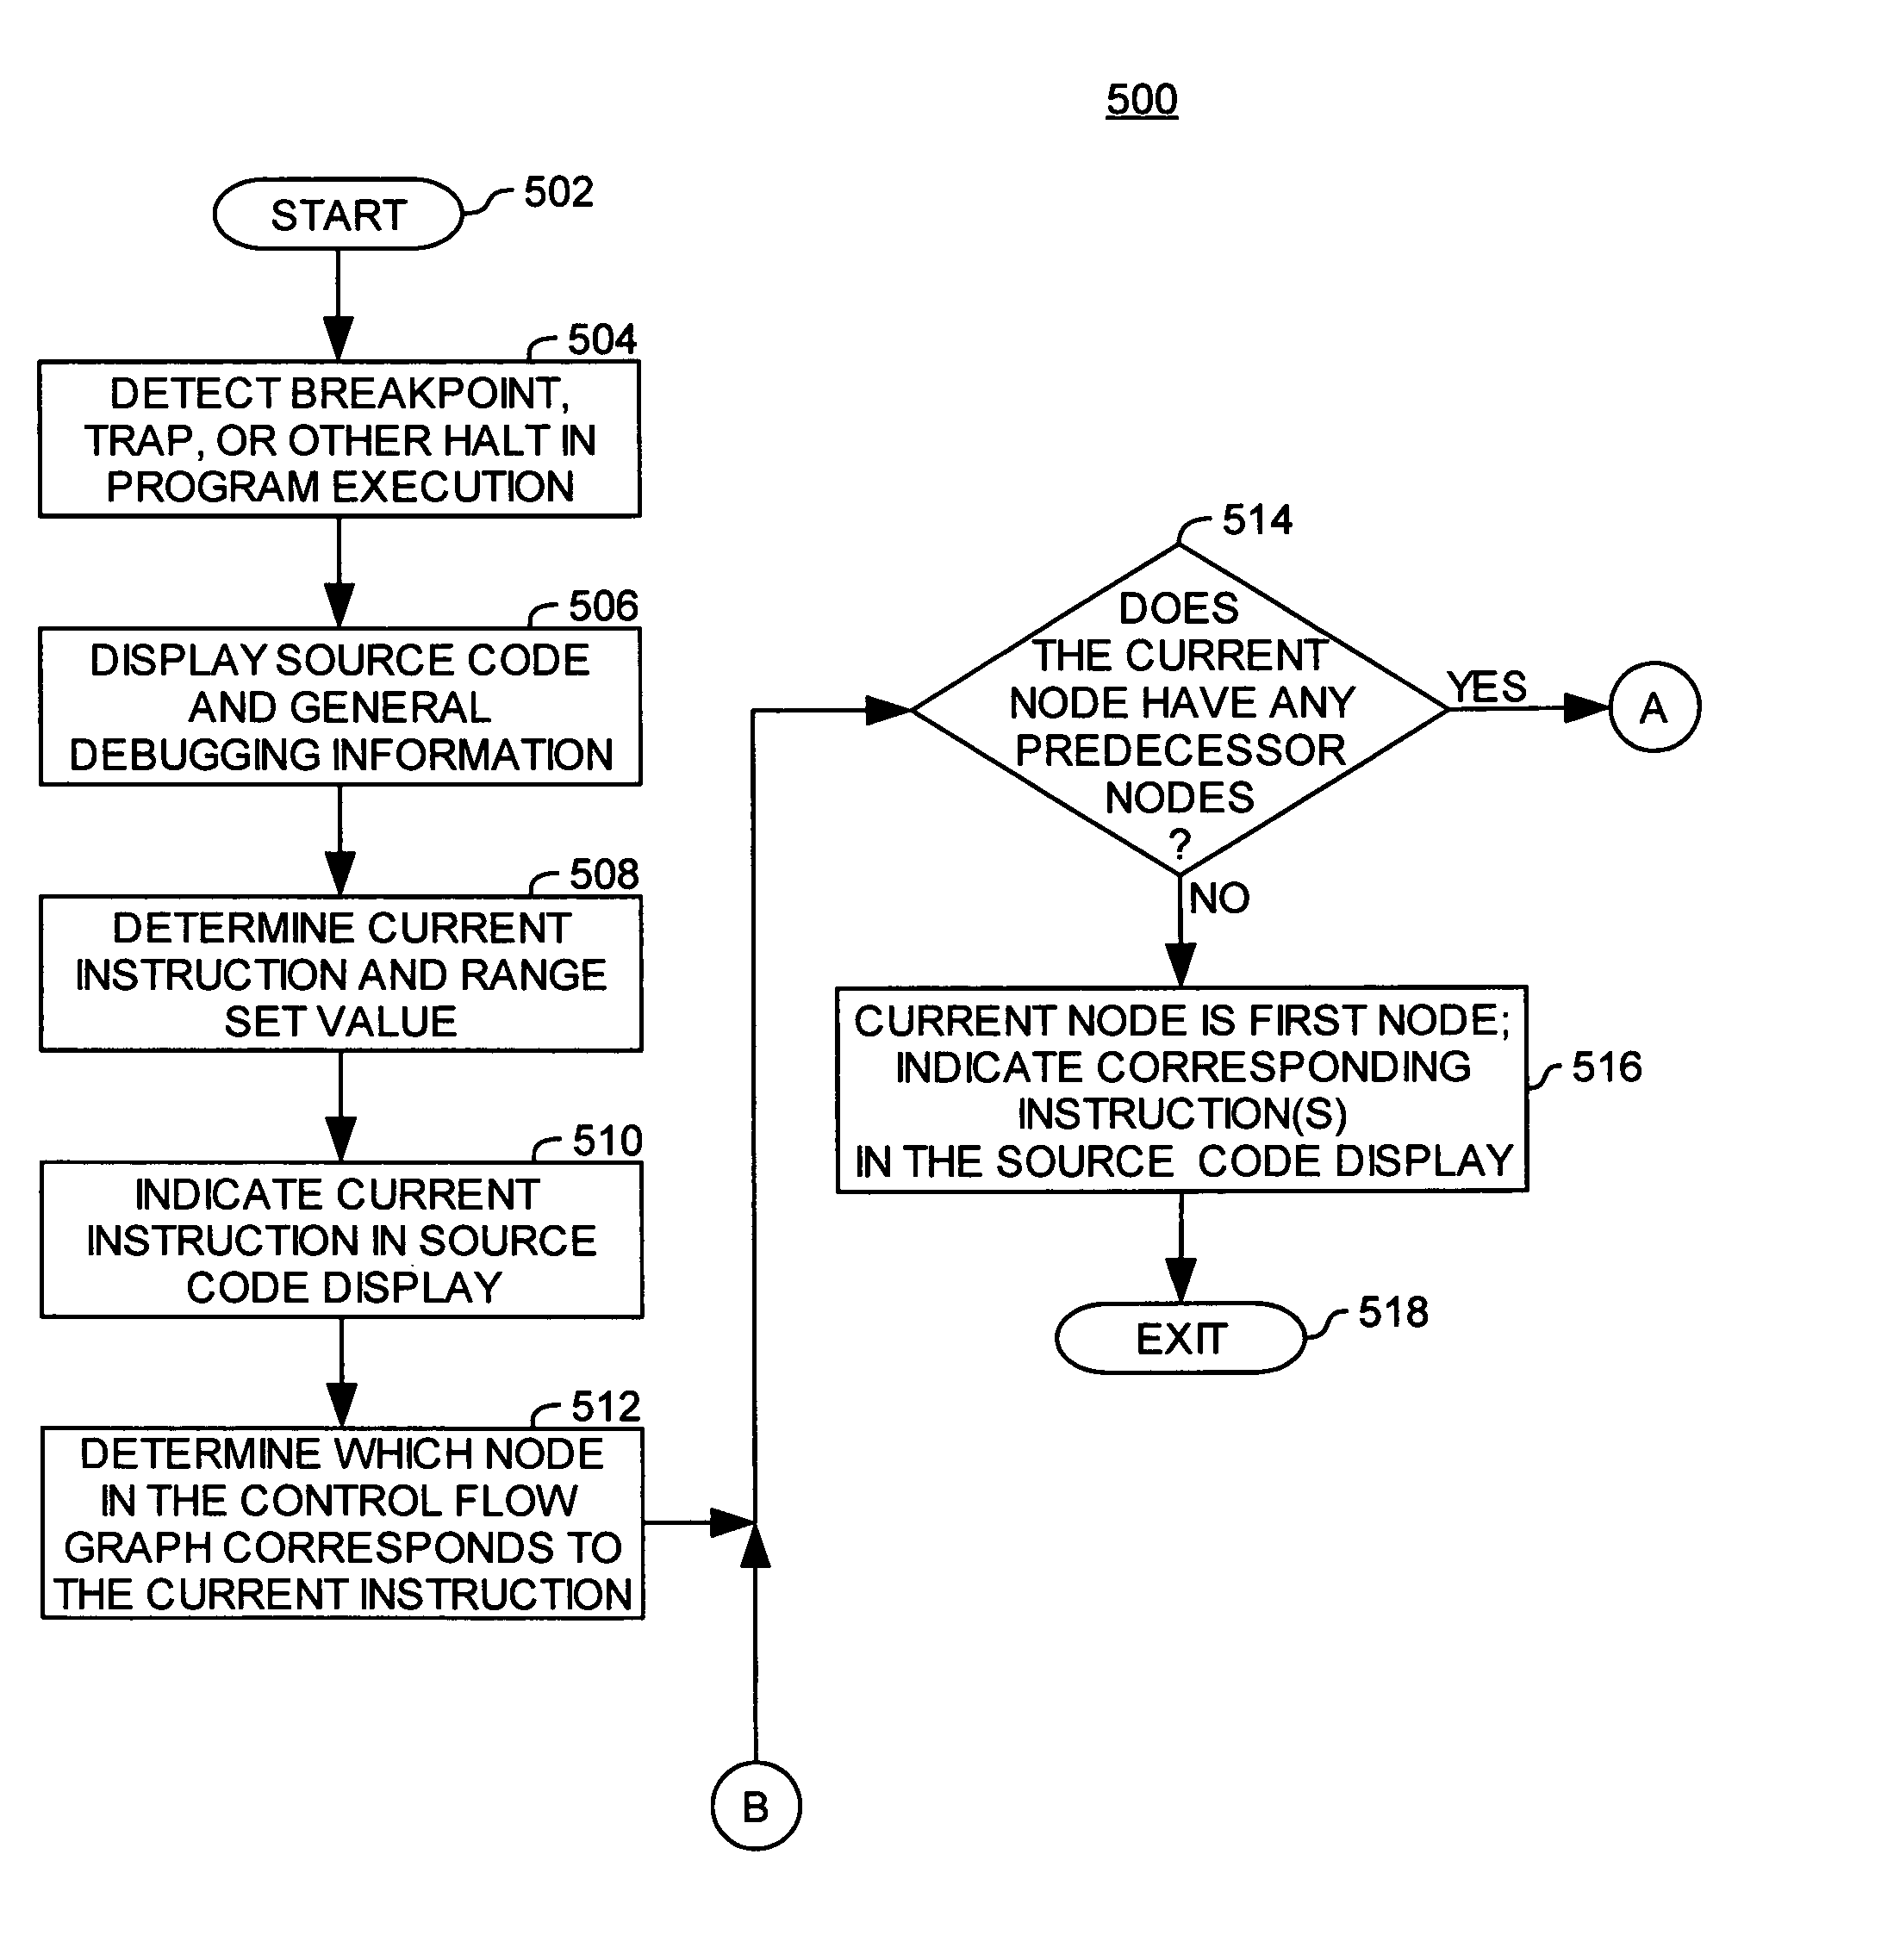
When debugging a program by tracing through program statements, the user often finds that the program has entered an unexpected state.
For the user, using breakpoints or a “run to cursor” function may incur costly overhead as the user determines where to insert the breakpoint or place the cursor in order to ensure that execution of the program stops at a point which is useful to the user.
However, executing a trace may require extra overhead (e.g., execution time) to allow the trace to gather information about the program.
For example, some traces may write a list of instructions to a file, causing a severe impact on performance of the program.
Thus, the extra inserted instructions may result in extra overhead (the time spent executing the inserted instructions) during execution of the program.
For some programs, executing such a trace may be too invasive from a performance and memory perspective to use such a trace to debug the program.

Method used


Image

  • Method of tracing back the execution path in a debugger
  • Method of tracing back the execution path in a debugger
  • Method of tracing back the execution path in a debugger

Examples


further embodiments and examples

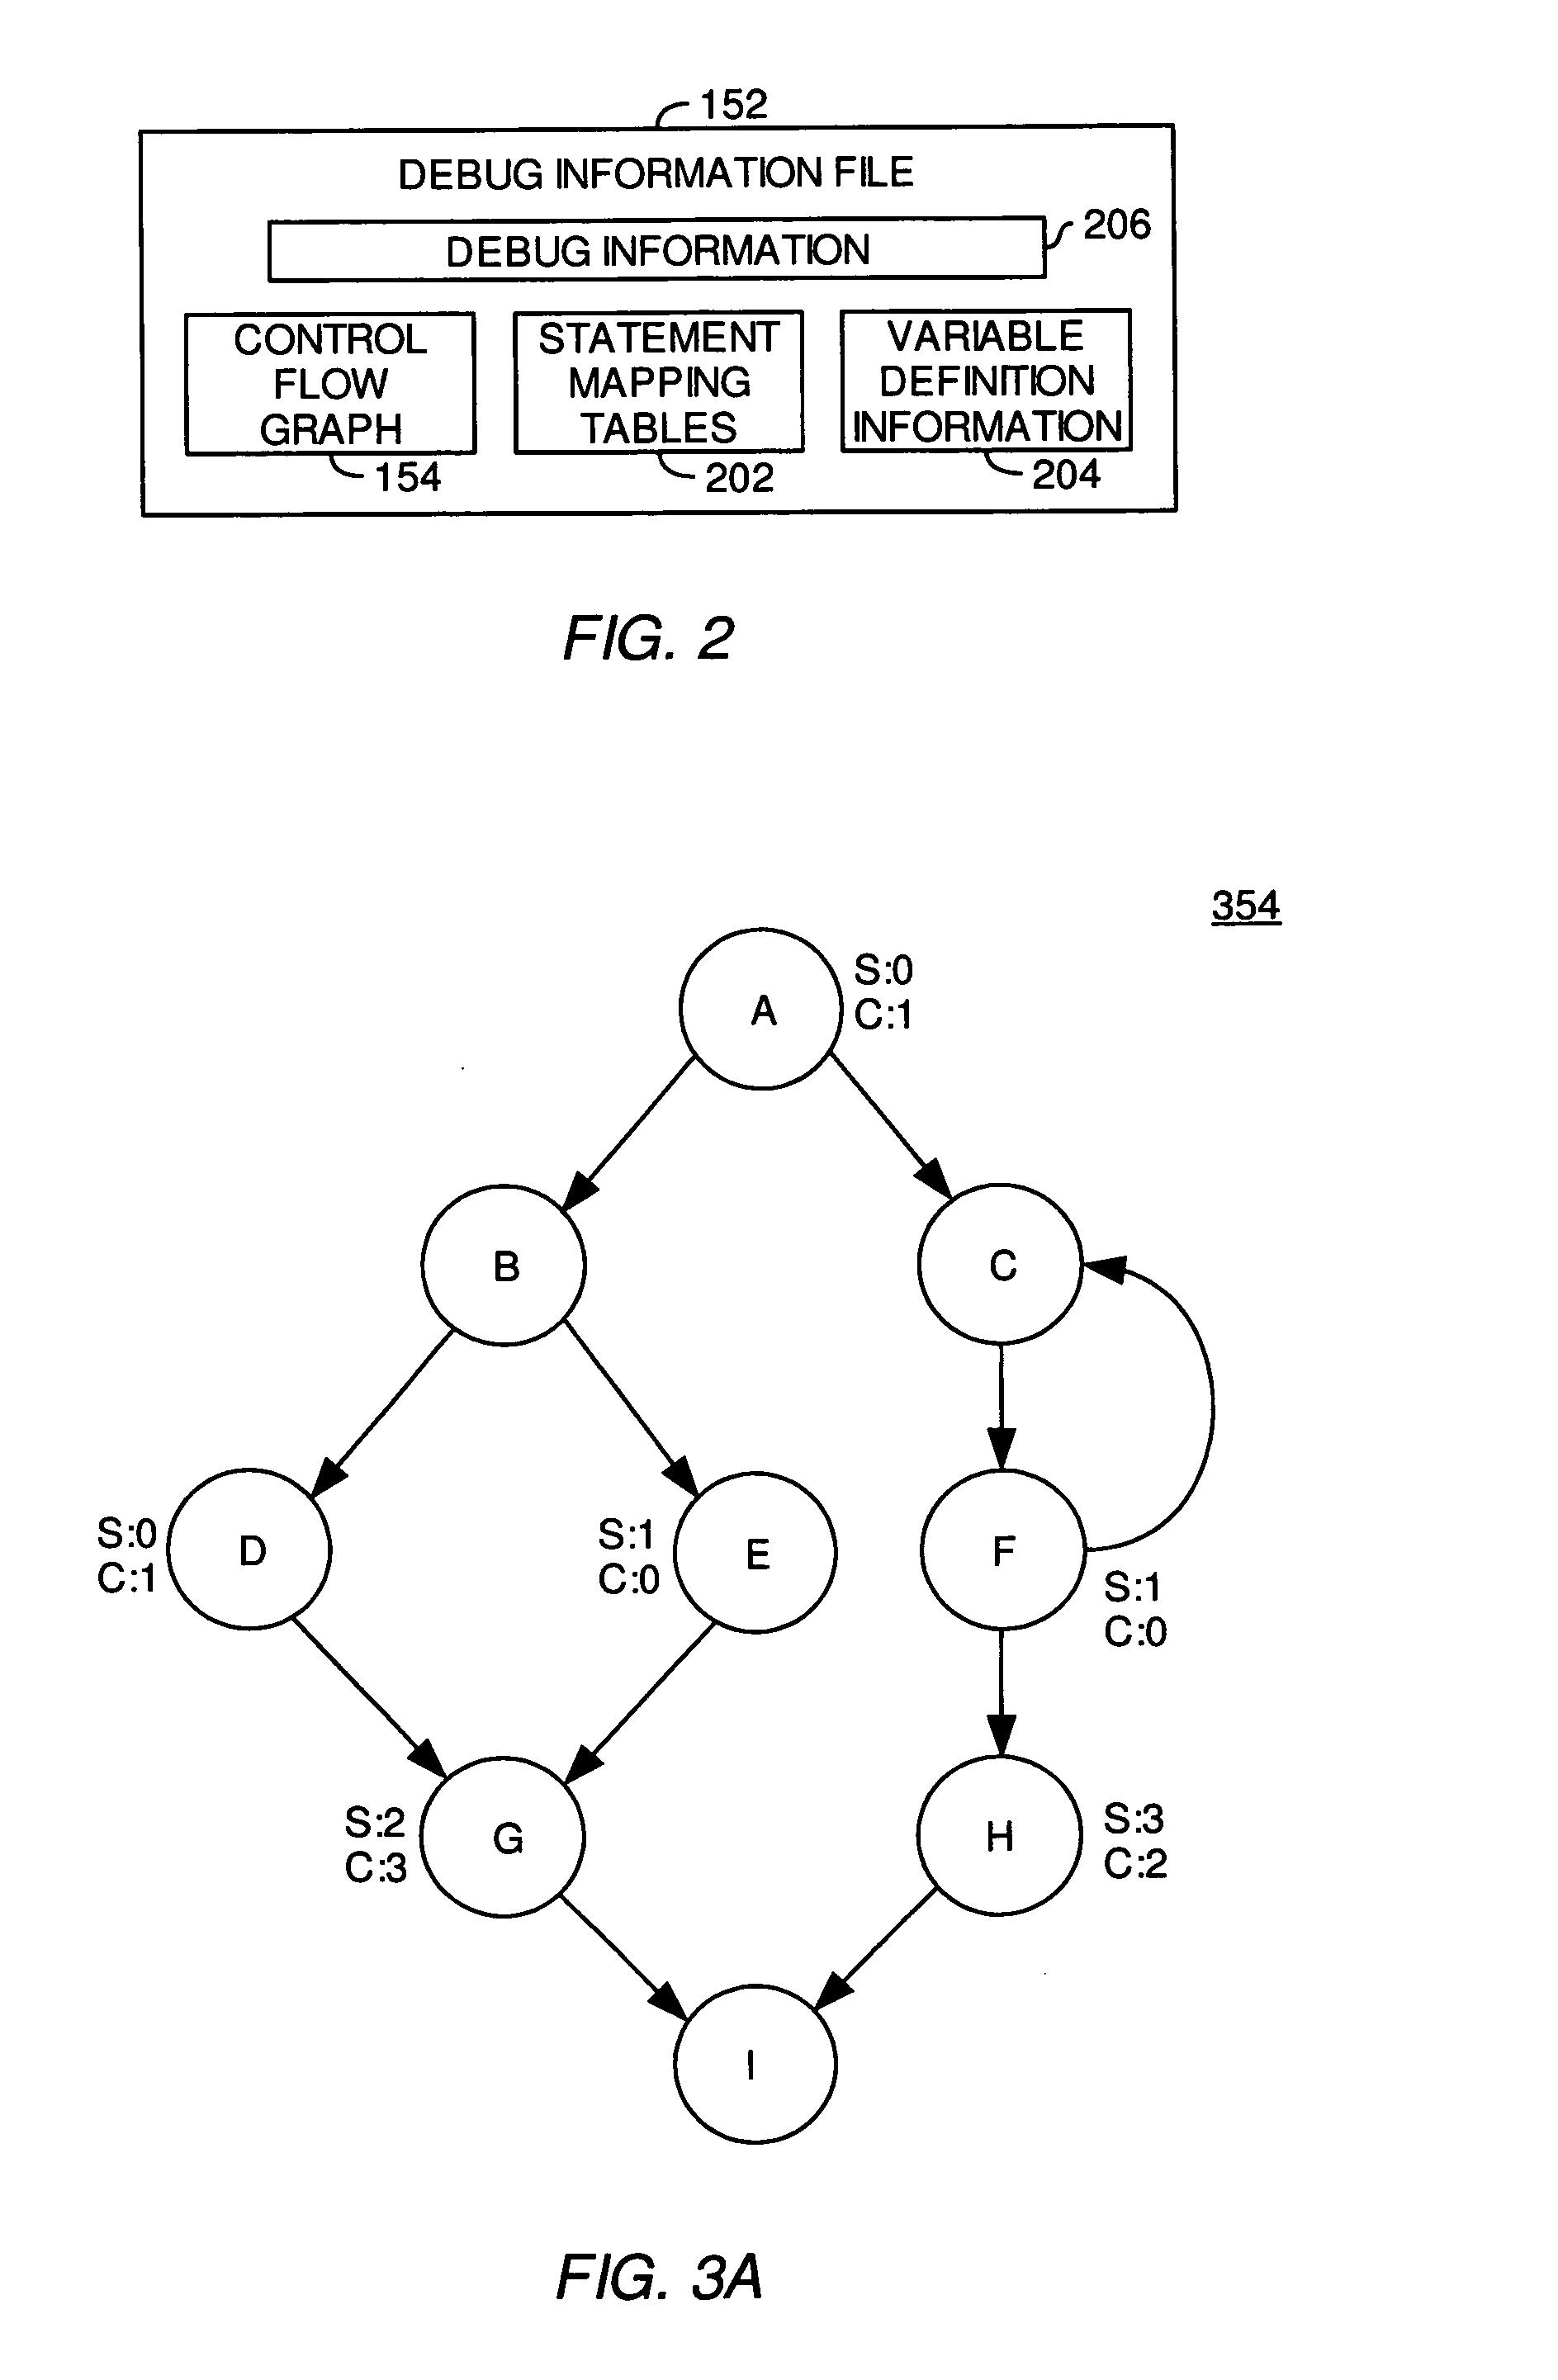
[0079] In one embodiment of the invention, an instruction may be inserted into a node which clears multiple bits in the variable which tracks the execution path of the program 120. For example, with respect to the CFG 754 depicted in FIG. 7, the instructions in Node B may include a statement which branches to an instruction in Node D1, D2, or E. The assigned range set for Node G may be R={0, 1, 2} with bit 0 in the variable corresponding to Node D1, bit 1 corresponding to Node D2, and bit 2 corresponding to Node E. As depicted, an instruction may also be inserted for Node D1 which clears bits 1 and 2 for Nodes D2 and E. By clearing bits 1 and 2, Node D1 may be identified as the most recently executed predecessor node for Node G. Similarly, instructions may be inserted for Node D2 clearing bits 0 and 2 and for Node E clearing bits 0 and 1, thereby ensuring that the most recently executed predecessor node for Node G may determined by examining the path variable.

[0080] Furthermore, wi...


PUM


Abstract

A method, computer-readable medium, and system for tracing the execution path of a program are provided. In one embodiment, a control flow graph is created for the program. For each node in the control flow graph, a determination is made of whether the node has two or more predecessor nodes. For each node determined to have two or more predecessor nodes, a set instruction is inserted into program code corresponding to the predecessor node which sets a corresponding value of a variable. The corresponding value of the variable indicates that one or more instructions in the predecessor node were executed during an execution of the program.

Description

BACKGROUND OF THE INVENTION [0001] 1. Field of the Invention [0002] The present invention generally relates to computers and computer software. More specifically, the invention is generally related to debugging software. [0003] 2. Description of the Related Art [0004] Inherent in any software development technique is the potential for introducing “bugs”. A bug will typically cause unexpected results during the execution of the program. Locating, analyzing, and correcting bugs in a computer program is a process known as “debugging”. Debugging of programs may be either done manually or interactively by a debugging system mediated by a computer system. Manual debugging of a program requires a programmer to manually trace the logic flow of the program and the contents of memory elements, e.g., registers and variables. In the interactive debugging of programs, the program is executed under the control of a monitor program (known as a “debugger”), commonly located on and executed by the s...

Claims


Application Information

Patent Timeline
Patent Type & Authority Applications(United States)
IPC IPC(8): G06F9/44
CPCG06F11/3644G06F11/3636
Inventor BATES, CARY L.
Owner IBM CORP
Why Eureka
Try Eureka