Electrical profile monitoring system for detection of atypical consumption

a technology of atypical consumption and a monitoring system, which is applied in the direction of transmission systems, electric vehicles, vehicle components, etc., can solve the problems of electrical theft, little monetary recovery through court actions, and millions of dollars of loss per year

Active Publication Date: 2007-08-30
DTECHS EPM
View PDF13 Cites 23 Cited by
  • Summary
  • Abstract
  • Description
  • Claims
  • Application Information

AI Technical Summary

Benefits of technology

[0021] Embodiments of the invention provide a method of detecting atypical consumption patterns which when compared to known patterns of consumption are useful in identifying electrical losses or theft, such as by marijuana grow-ops. Use of a meter having a reso

Problems solved by technology

It is estimated that electrical theft alone results in millions of dollars of loss per year.
It is believed that the most significant contributor to electrical theft is the indoor cultivation of marijuana known as grow operations or “grow-ops”.
While recent case law has made the recovery of lost energy revenue possible, the reality is that very little monetary recovery is made through court actions.
Along with the staggering costs related to the electrical theft, there are additional costs to the communit

Method used


Image

  • Electrical profile monitoring system for detection of atypical consumption
  • Electrical profile monitoring system for detection of atypical consumption
  • Electrical profile monitoring system for detection of atypical consumption

Examples


example 1

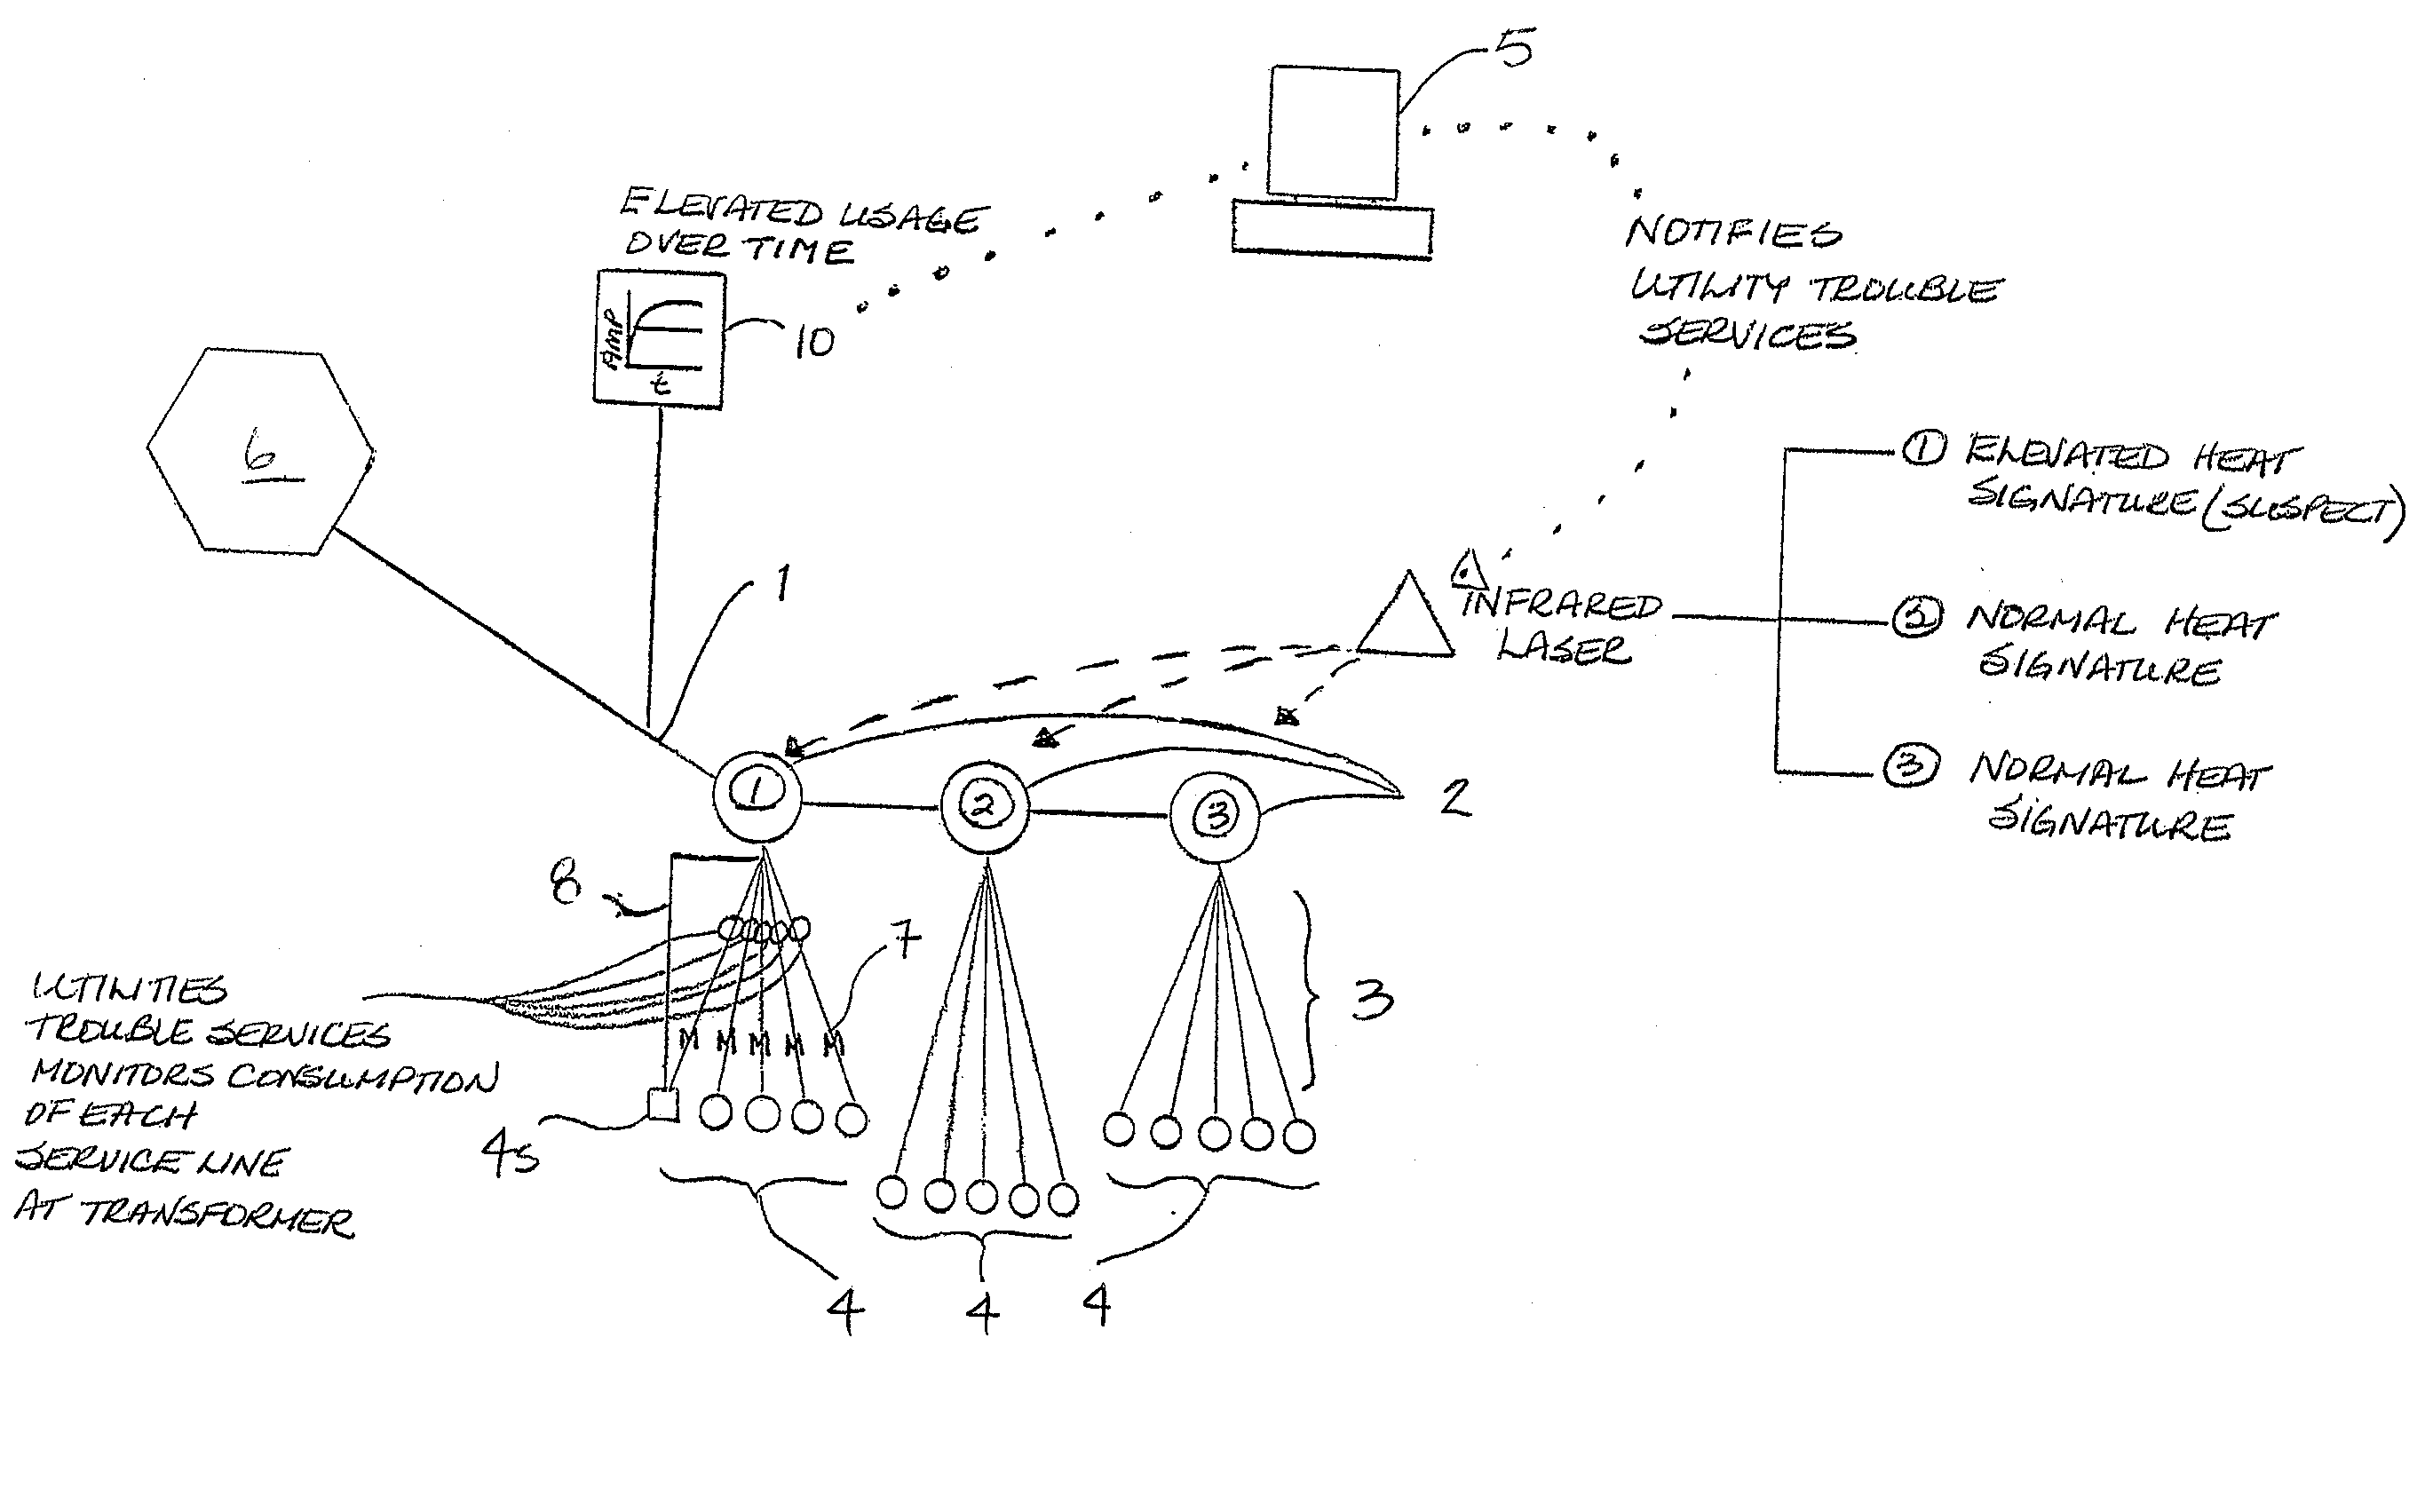
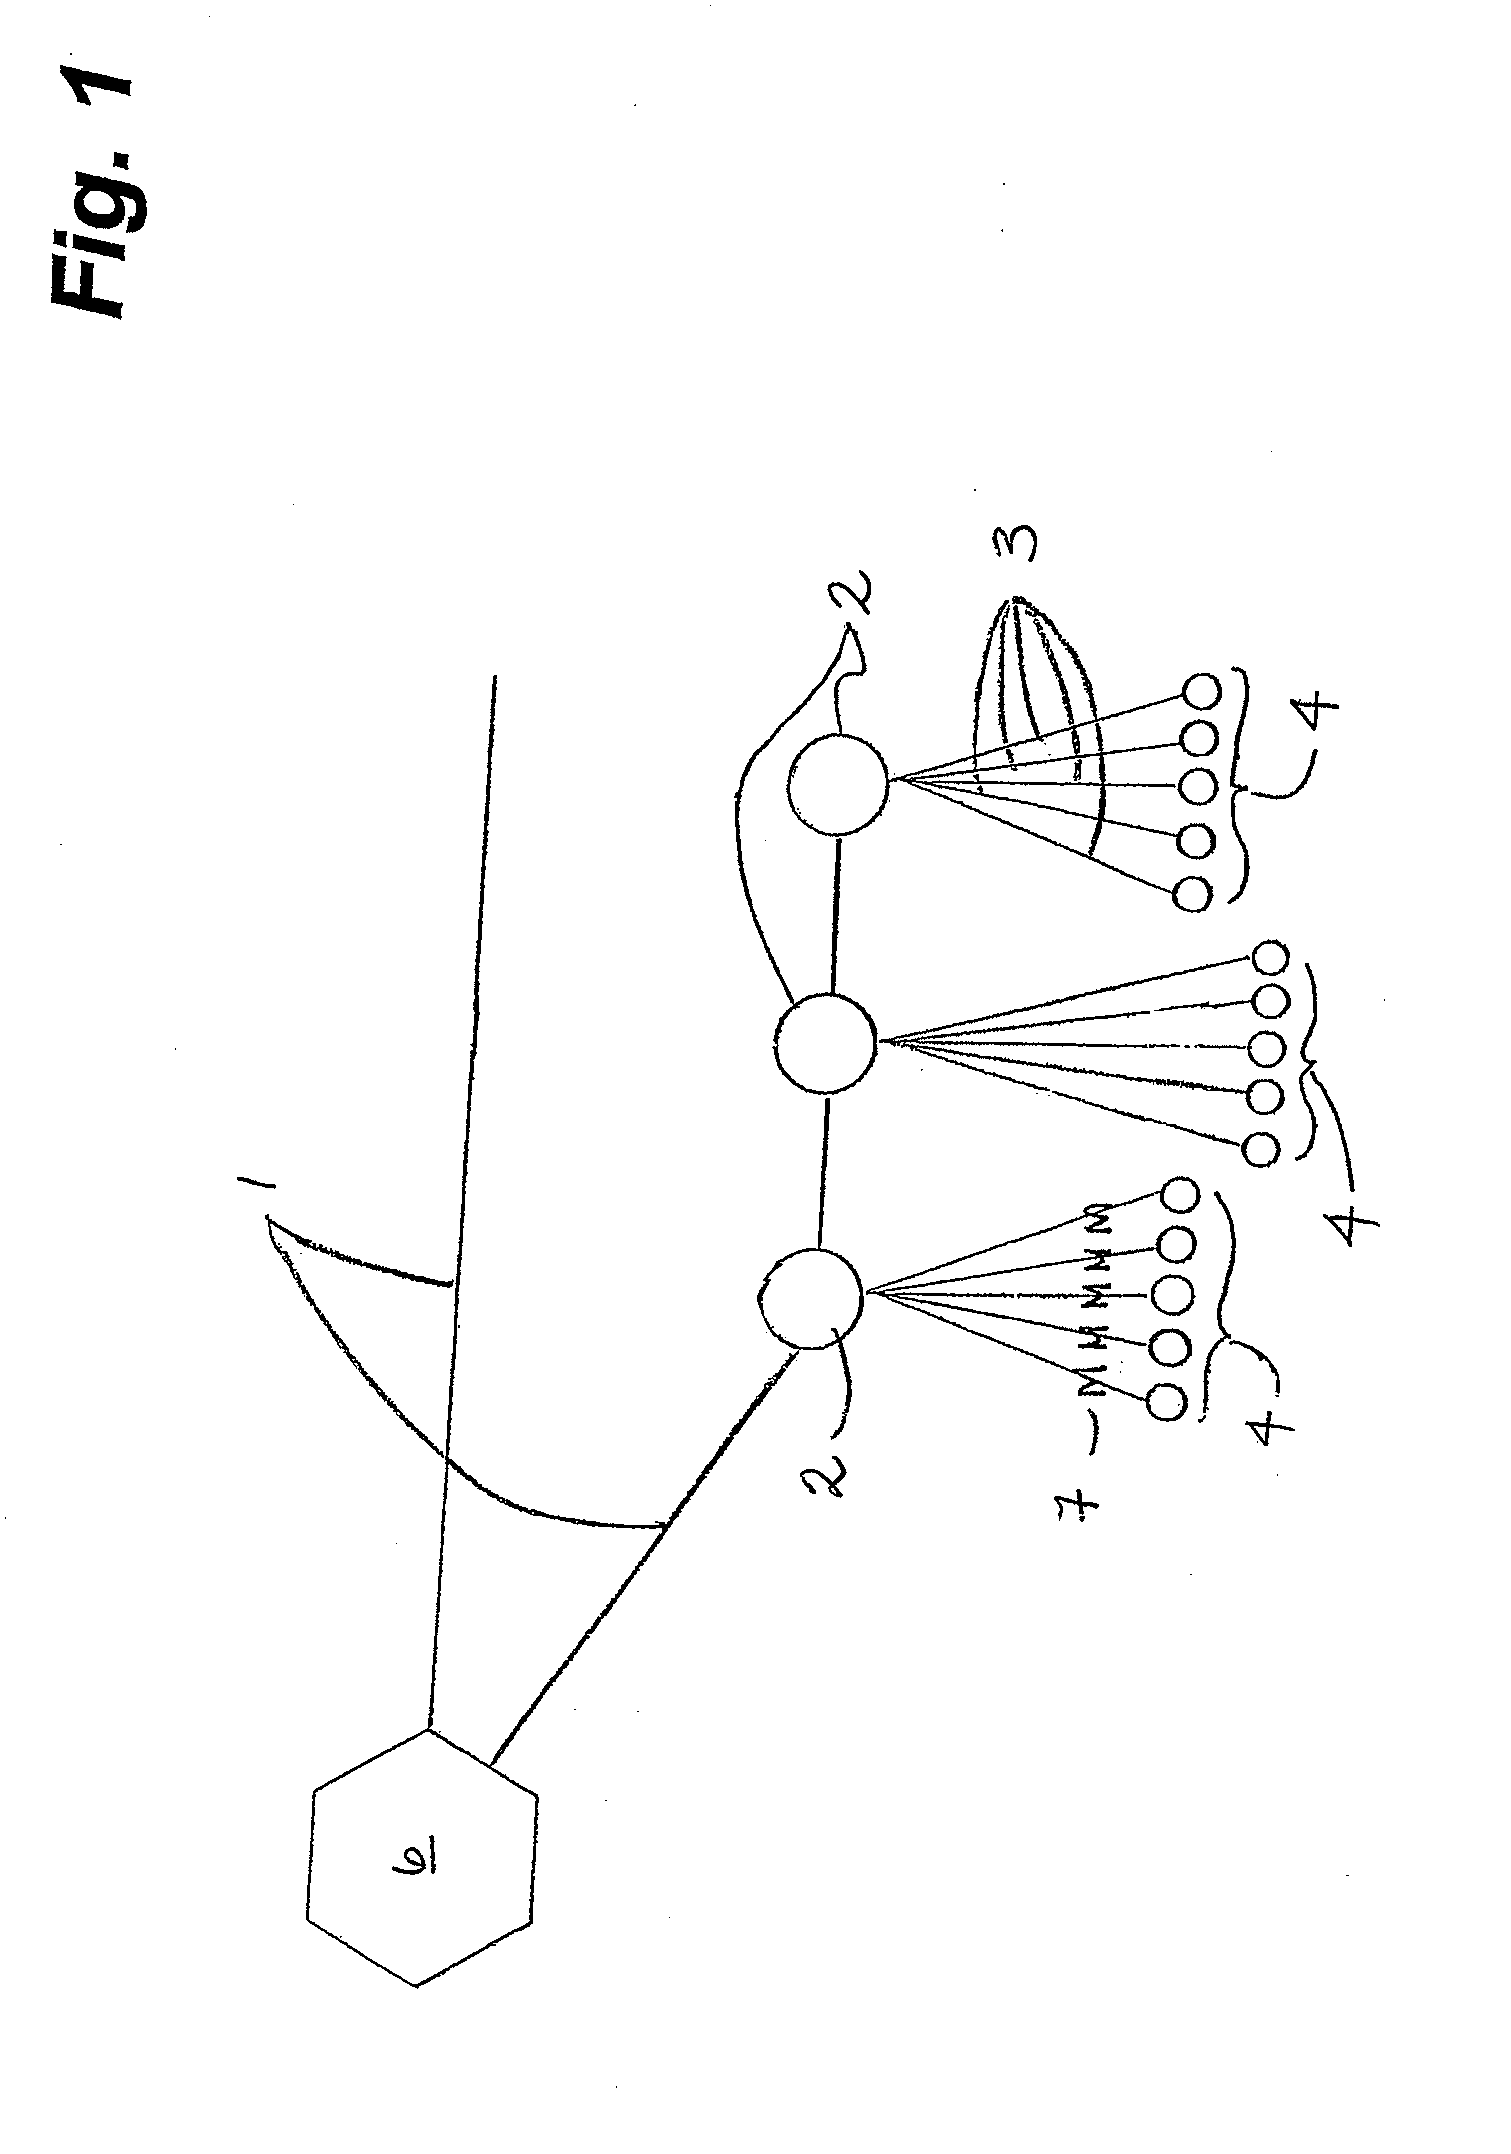
[0042] Following identification of a suspect primary line 1, heat signature comparisons of the transformers 2 were made using a 3M Scotchtrak Infrared IR-60L2 Series infrared laser, available from 3M Canada, London Ontario, Canada. The results are shown in Table B. The emissivity values of the unit was operated at 0.92 (unit preset) and 0.80 (value for steel) without appreciable difference. The comparisons were performed on a sunny day (not preferred) at 10:30 am at an ambient temperature of 8.4° C. (47.1° F.).

[0043] A digital recording ammeter placed on one of two incoming services lines from a suspect transformer 2 gave a reading of 31 amps over a predetermined period of time. Without load testing, a presumption was made that the amperage load for both lines was approximately double or 62 amps. Three additional transformers 2 in the grid of ten transformers 2 being fed from the primary line 1 were measured for comparison. The three additional transformers 2 were selected to have ...

example 2

[0044] Following identification of a suspect primary line 1, heat comparisons were made using the same equipment identified in the first example and are shown in Table C. The comparisons were performed at dawn at an ambient temperature of 8.9° C. (48.0° F.). Approximately three hours later, a load test was performed on both secondary lines 3 feeding into the now-identified grow operation. The results were 60.3 amps and 71.8 amps. Once inside the residence 4s, it was confirmed from the timers that the amperage readings at the time the heat comparisons were performed were the same as when the load testing was done. Seven additional transformers 2 in the grid of ten transformers 2 being fed from the primary line 1 were measured for comparison. Of note, all dwellings 4 in the residential area were of approximately the same size.

TABLE CHeat readingHeat readingTransformer# of services(Celsius)(Fahrenheit)Suspect1016.862.21910.651.121010.550.931110.651.141110.550.951110.550.9698.547.3788...

example 3

[0045] As shown in FIG. 11, a residential community having 37 active residences was monitored using an embodiment of the invention for the presence of a grow-op. A meter 10 was placed on the primary line 1 feeding transformers 2 (31W-3 to 31W-7). As shown in FIG. 12, a reading of 2.6 amps was initially obtained at 1315 hours on Day 1. Subsequently, an atypical consumption pattern was observed over a predetermined time period.

[0046] Heat signatures of the transformers 2 (31W-3 to 31W-7) were measured, as shown in Table D, and it was noted that one transformer 2 (31W-4) had a heat signature which exceeded that of the other transformers 2 fed by the primary line 1.

TABLE DHeat readingHeat readingTransformer# of services(Celsius)(Fahrenheit)31W-768.747.731W-689.048.231W-588.847.831W-4 (suspect)812.955.231W-378.847.8Margin from highest3.97.0to second highest

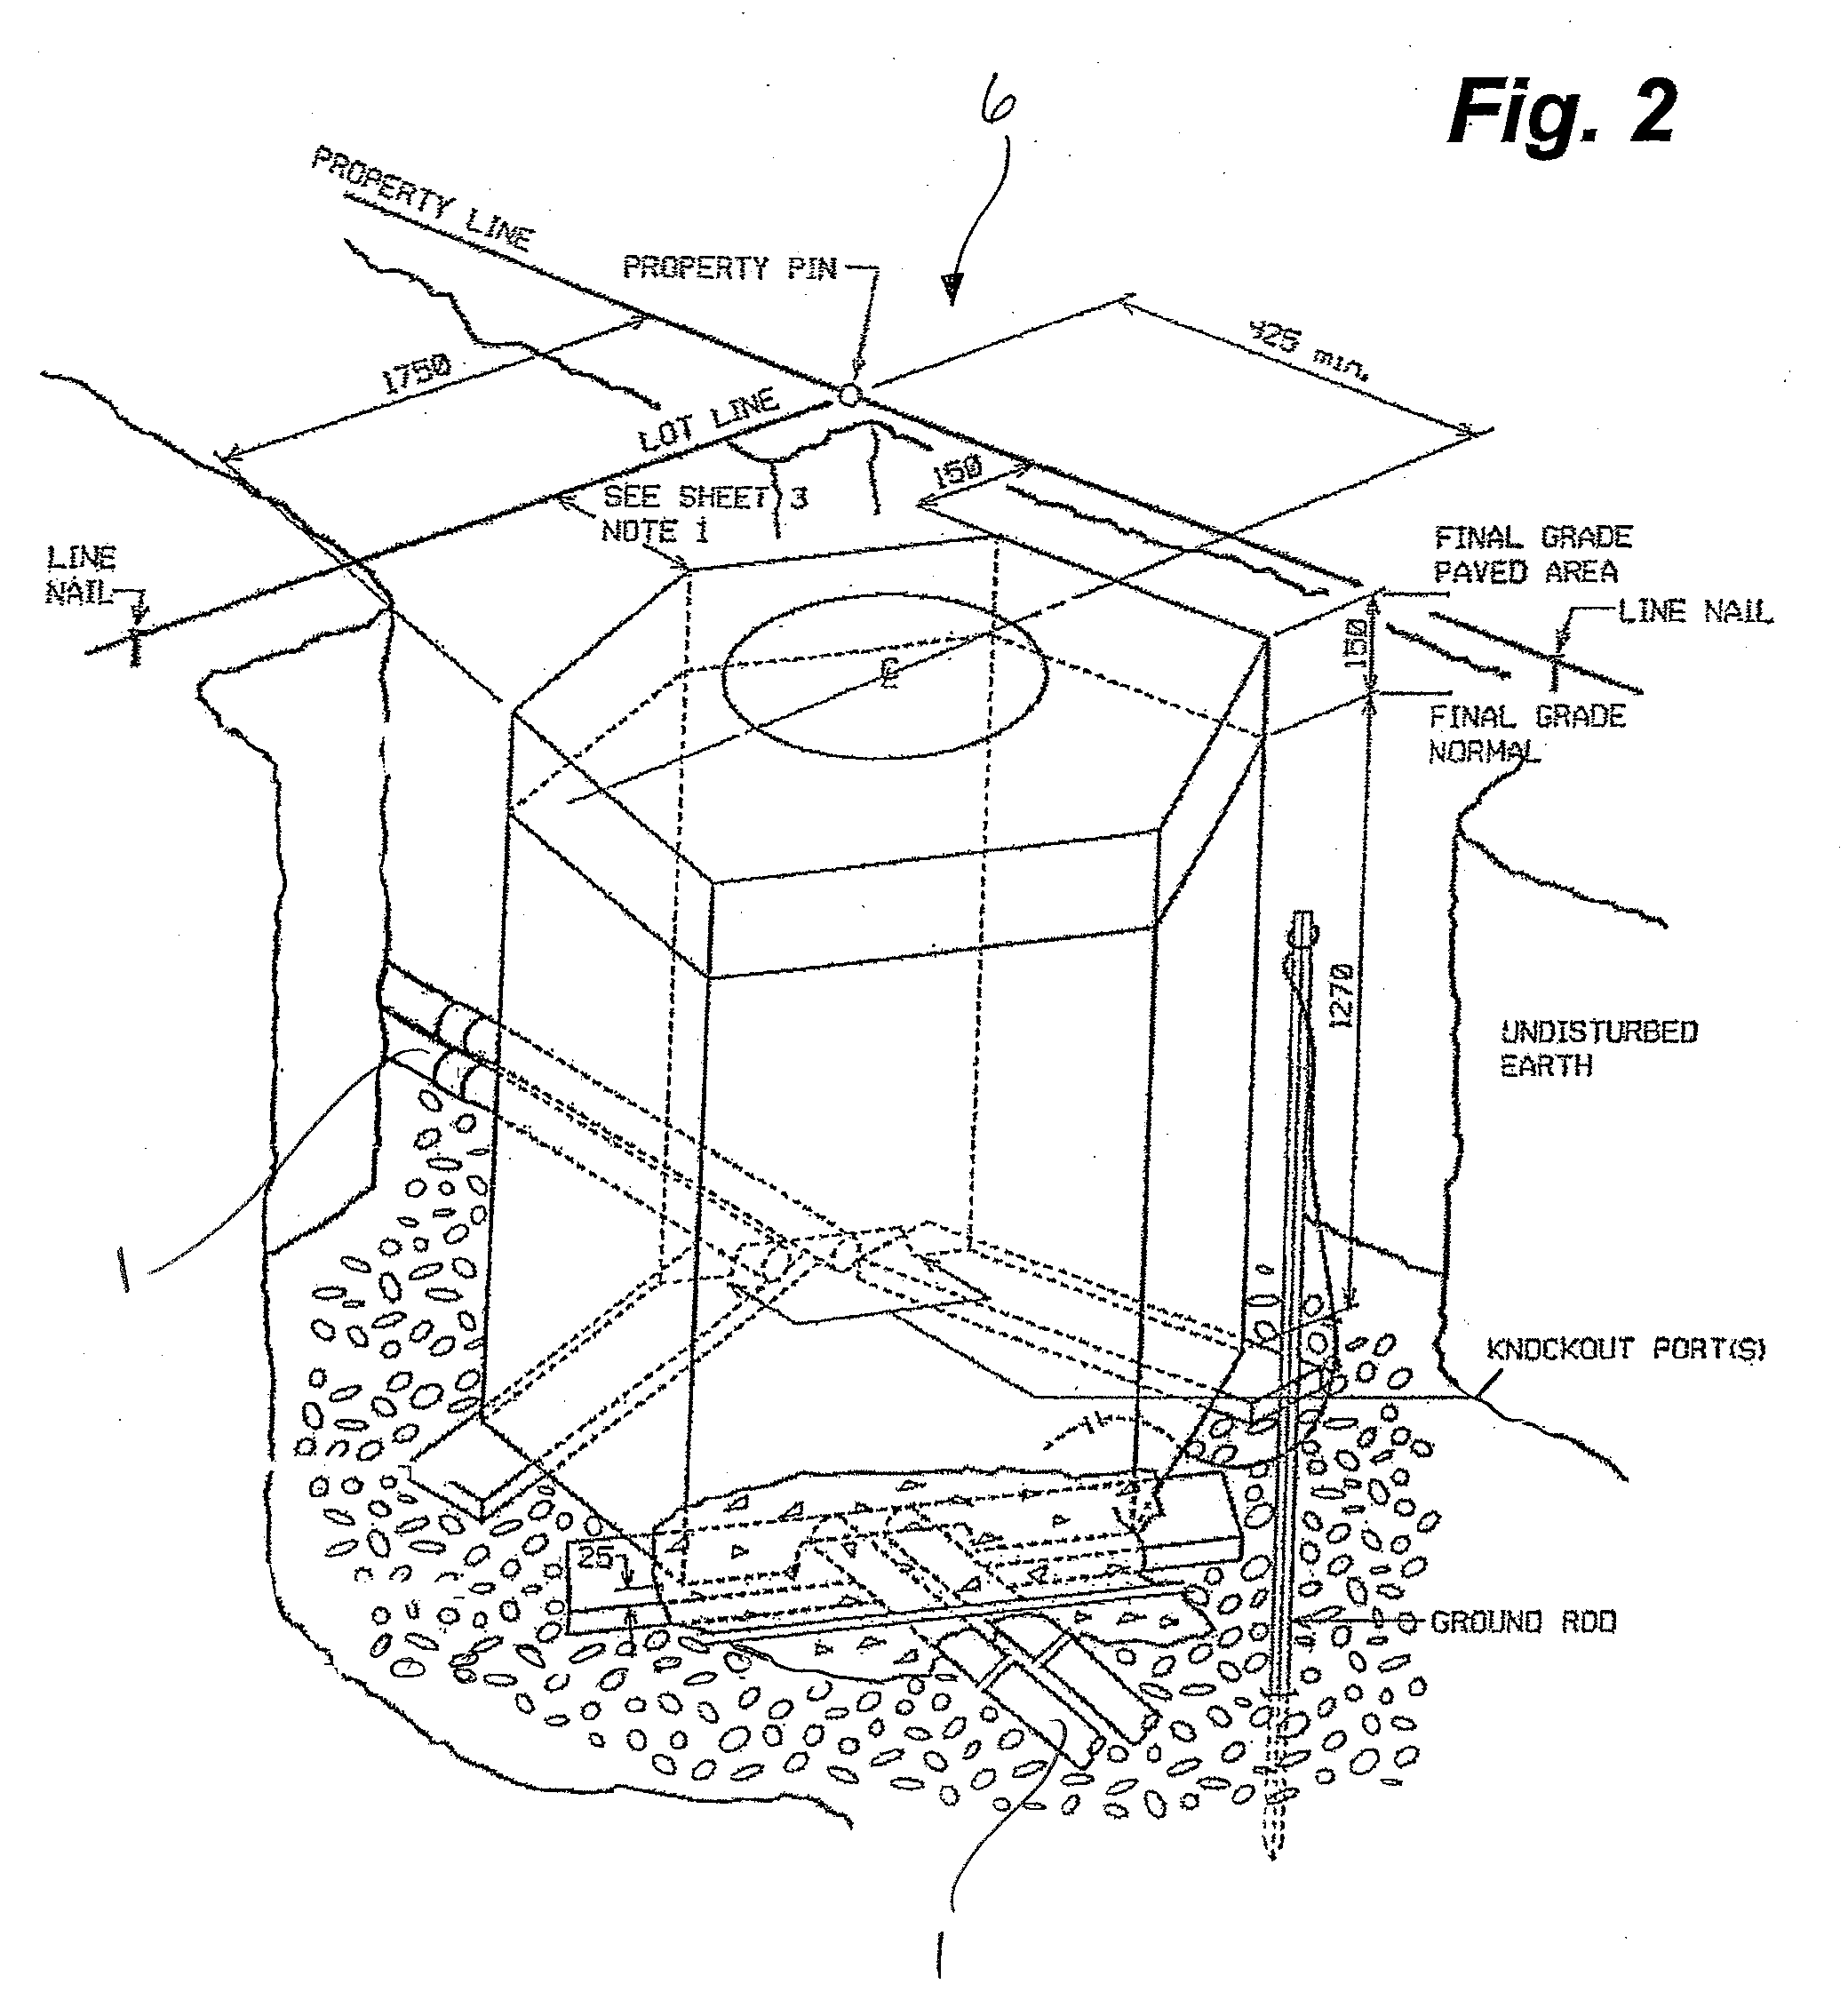
[0047] Subsequent load testing identified the suspect residence 4s which was entered on Day 2 at 1420 hours. An electrical bypass ...


PUM


Abstract

Methods of detecting atypical patterns of usage of electricity, determined by monitoring consumption at the primary line, permit detection of grow-ops and unusual line losses due to defective service lines. A meter having a high resolution is connected to the primary line and the data collected is compared to known consumption patterns thus identifying a potential theft or a loss. Once an atypical pattern has been found, the heat signatures of transformers fed by the primary line are measured. An unusual heat signature alerts the utility to load test the secondary lines of each residence fed from the transformer and thus locate suspect residences which may be grow-ops or to locate a line loss due to defective service lines.

Description

FIELD OF THE INVENTION [0001] Embodiments of the invention relate to systems for monitoring usage of utilities, such as electrical, for alterations in normal patterns of consumption of utilities and, more specifically, to a system of detection of patterns indicative of theft of electrical utilities, such as in the indoor cultivation of marijuana. BACKGROUND OF THE INVENTION [0002] It is estimated that electrical theft alone results in millions of dollars of loss per year. Ontario, Canada reports an estimated cost of $500 million dollars per year. It is believed that the most significant contributor to electrical theft is the indoor cultivation of marijuana known as grow operations or “grow-ops”. While recent case law has made the recovery of lost energy revenue possible, the reality is that very little monetary recovery is made through court actions. [0003] Along with the staggering costs related to the electrical theft, there are additional costs to the community which include prop...

Claims


Application Information

Patent Timeline
IPC IPC(8): G01R11/32
CPCG01R22/10G01R22/066
Inventor MORRISON, ROGER
Owner DTECHS EPM
Why Eureka
Try Eureka