
Mechanism for animated load graph analysis of system metrics

Inactive Publication Date: 2007-11-15
SUN MICROSYSTEMS INC
View PDF24 Cites 11 Cited by
  • Summary
  • Abstract
  • Description
  • Claims
  • Application Information

AI Technical Summary

Problems solved by technology

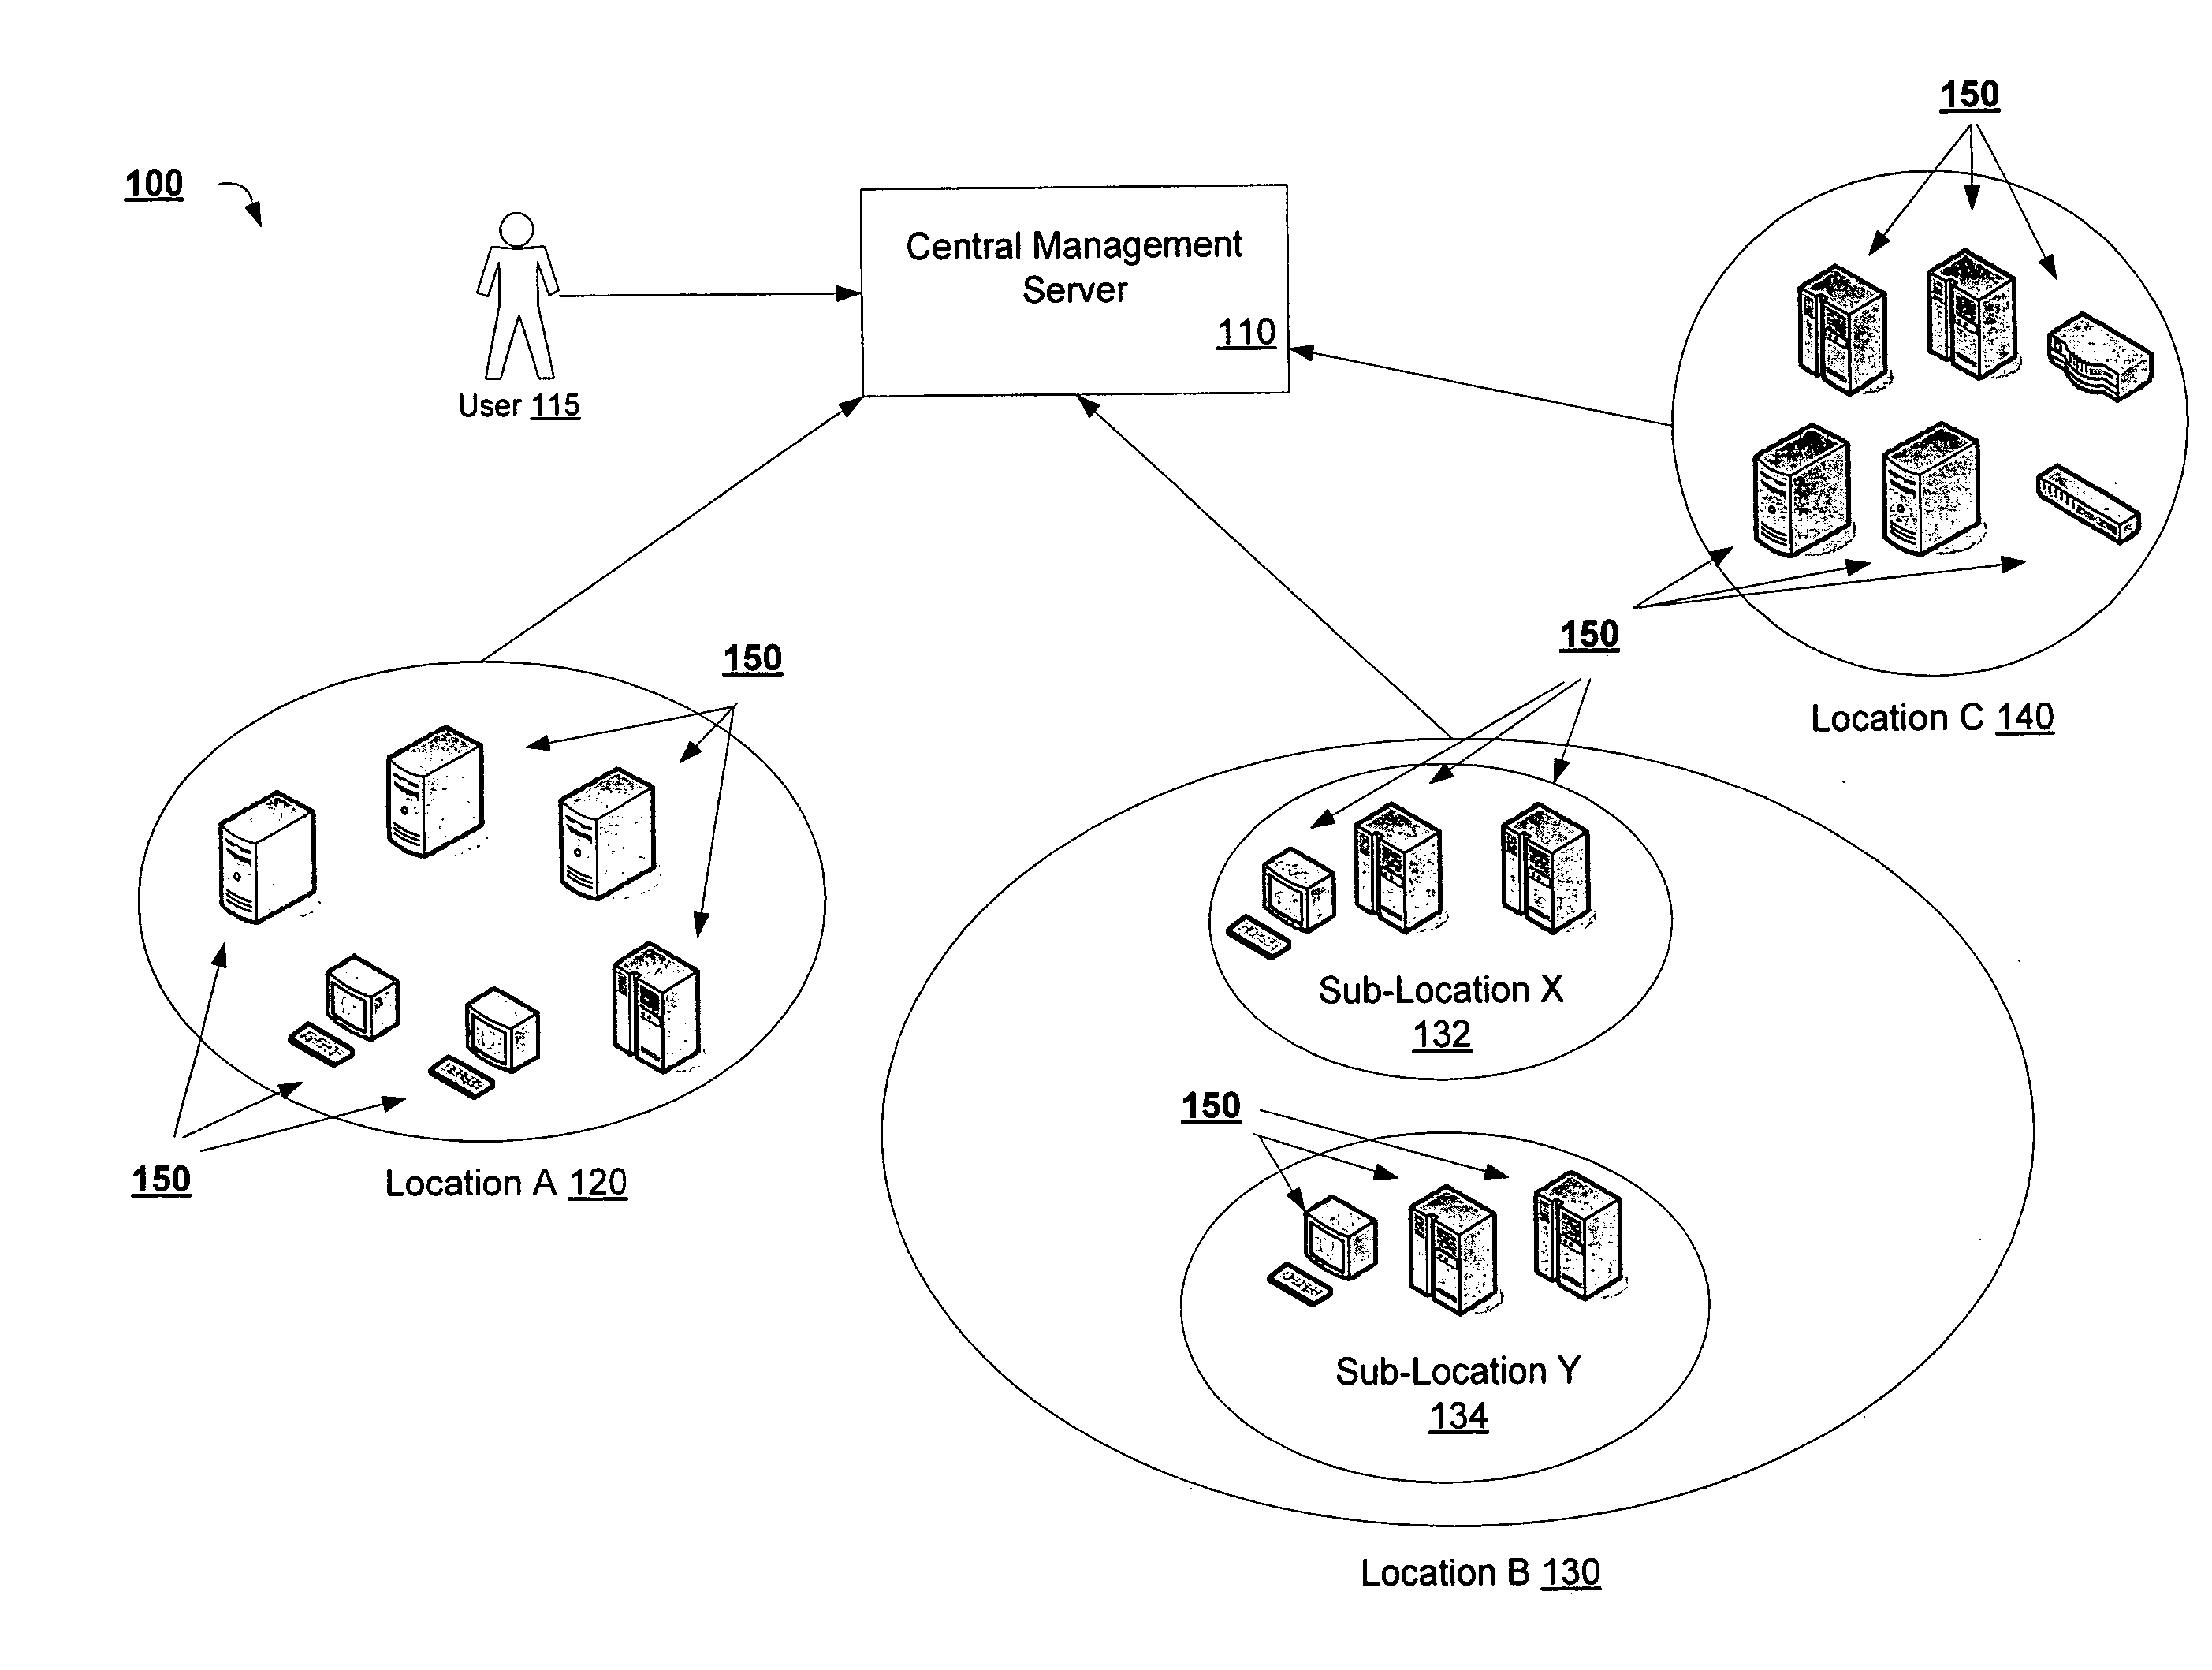
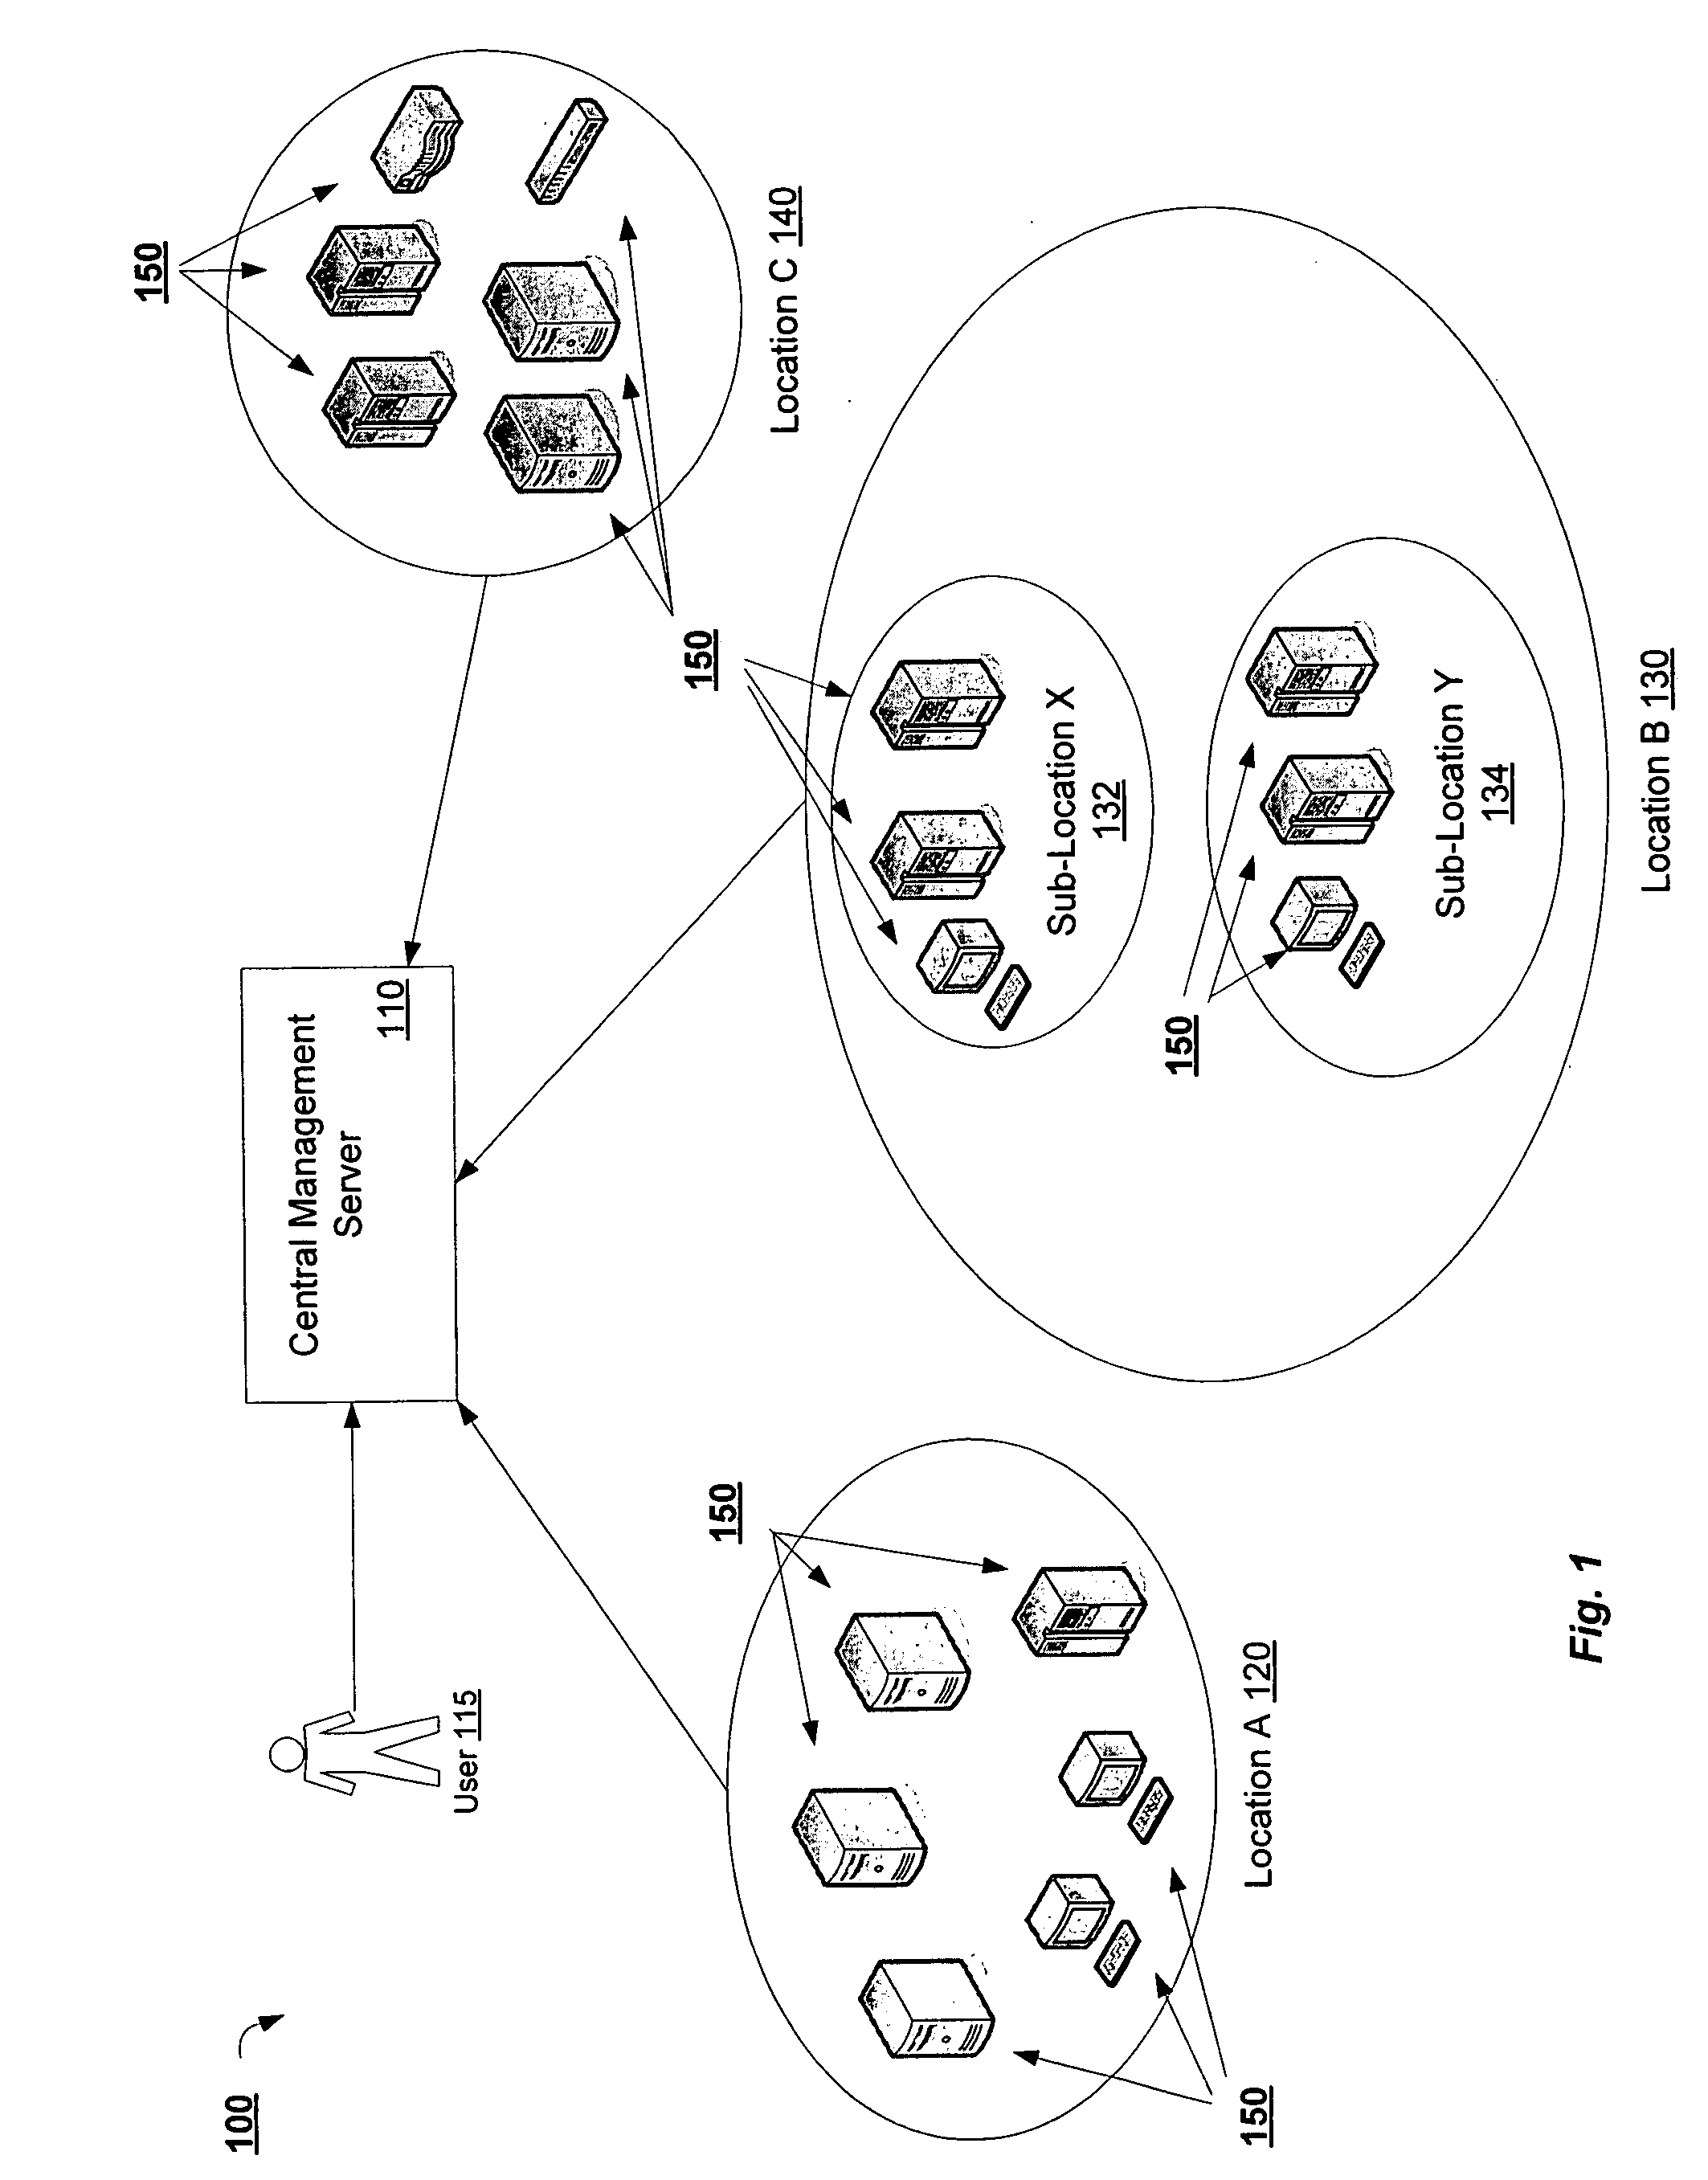
A problem encountered in network architectures with separated clients and servers, such as one utilizing thin clients, is that it is difficult to manage the variety of components involved in such a network architecture.

Method used


Image

  • Mechanism for animated load graph analysis of system metrics
  • Mechanism for animated load graph analysis of system metrics
  • Mechanism for animated load graph analysis of system metrics

Examples


Embodiment Construction

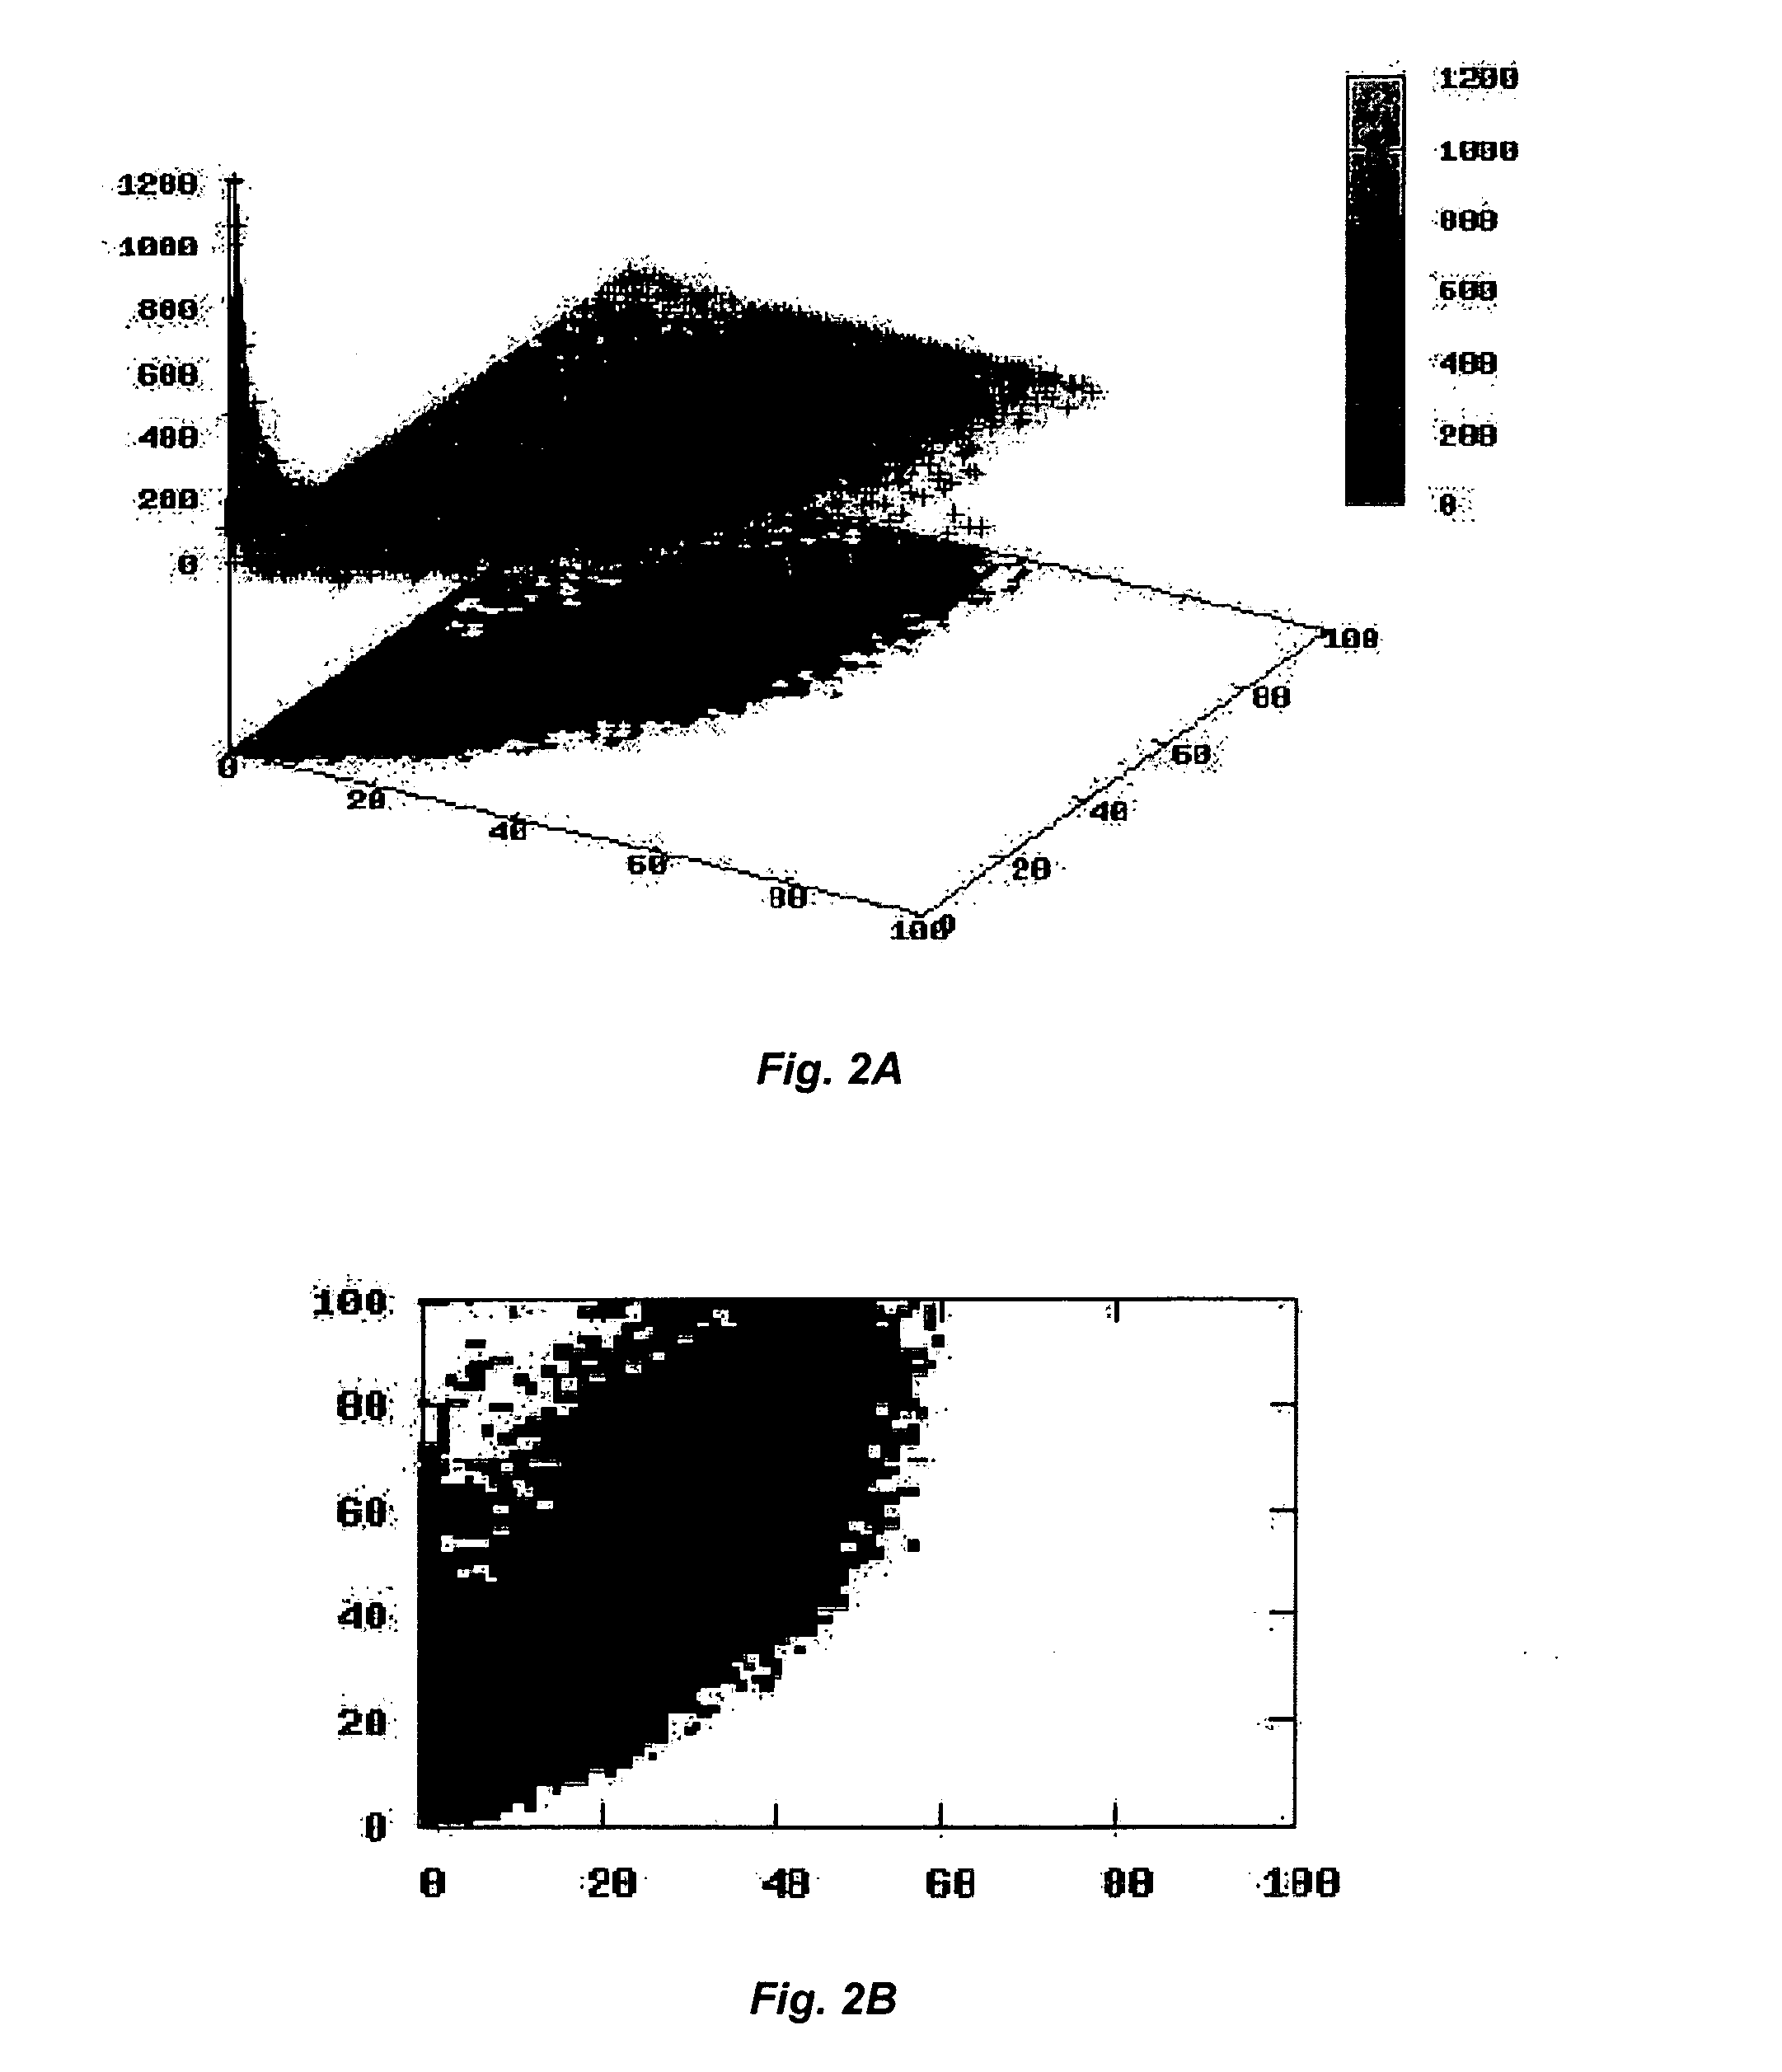
[0017] A method and apparatus are described for animated load graph analysis of system metrics. According to one embodiment, the method includes plotting system metric data of components for three dimensions in a two-dimensional graph for a plurality of distinct time periods, wherein a Z-axis of the three dimensions is represented in the two-dimensional graph by colors that each indicate a frequency of an occurrence at an intersection of a X- and a Y-axis of the two-dimensional graph, and animating the two-dimensional graph by portraying the system metric data for the plurality of distinct periods of time in a sequential order beginning with the earliest time period of the distinct periods of time.

[0018] In the following description, numerous details are set forth. It will be apparent, however, to one skilled in the art that embodiments of the present invention may be practiced without these specific details. In other instances, well-known structures, devices, and techniques have n...


PUM


Abstract

In one embodiment, a method and apparatus for animated load graph analysis of system metrics is disclosed. The method includes plotting system metric data of components for three dimensions in a two-dimensional graph for a plurality of distinct time periods, wherein a Z-axis of the three dimensions is represented in the two-dimensional graph by colors that each indicate a frequency of an occurrence at an intersection of a X- and a Y-axis of the two-dimensional graph, and animating the two-dimensional graph by portraying the system metric data for the plurality of distinct periods of time in a sequential order beginning with the earliest time period of the distinct periods of time. Other embodiments are also disclosed.

Description

FIELD OF INVENTION [0001] An embodiment of the invention relates to computer system management, and more specifically, to a mechanism for animated load graph analysis of system metrics. BACKGROUND OF INVENTION [0002] Network architectures have many operating components with varying performance levels. These components may produce system metric data that can be monitored to predict and analyze performance of the components. For example, both clients and servers in a network architecture may produce system metric data that can be analyzed. For example, system metric data for a server may include server load. System metric data for a client may be the load profile of the client. Some examples of servers and clients producing measurable system metrics include lightweight direct access protocol (LDAP) servers, Network File System (NFS) servers, web proxy servers, databases, thin clients, or a computer doing central processing unit (CPU) bound calculations, to name a few examples. [0003] ...

Claims


Application Information

Patent Timeline
IPC IPC(8): G06T15/70
CPCH04L41/12H04L43/045H04L41/22H04L41/147
Inventor MEIGHAN, SEAN C.BOLANO, GABRIEL M.
Owner SUN MICROSYSTEMS INC
Learn More