Method and apparatus for concentrating and amplifying nucleic acid in single micro chamber
- Summary
- Abstract
- Description
- Claims
- Application Information
AI Technical Summary
Benefits of technology
Problems solved by technology
Method used
Image
Examples
example 1
PCR Efficiency as a Function of Increasing Surface Area of a Chip
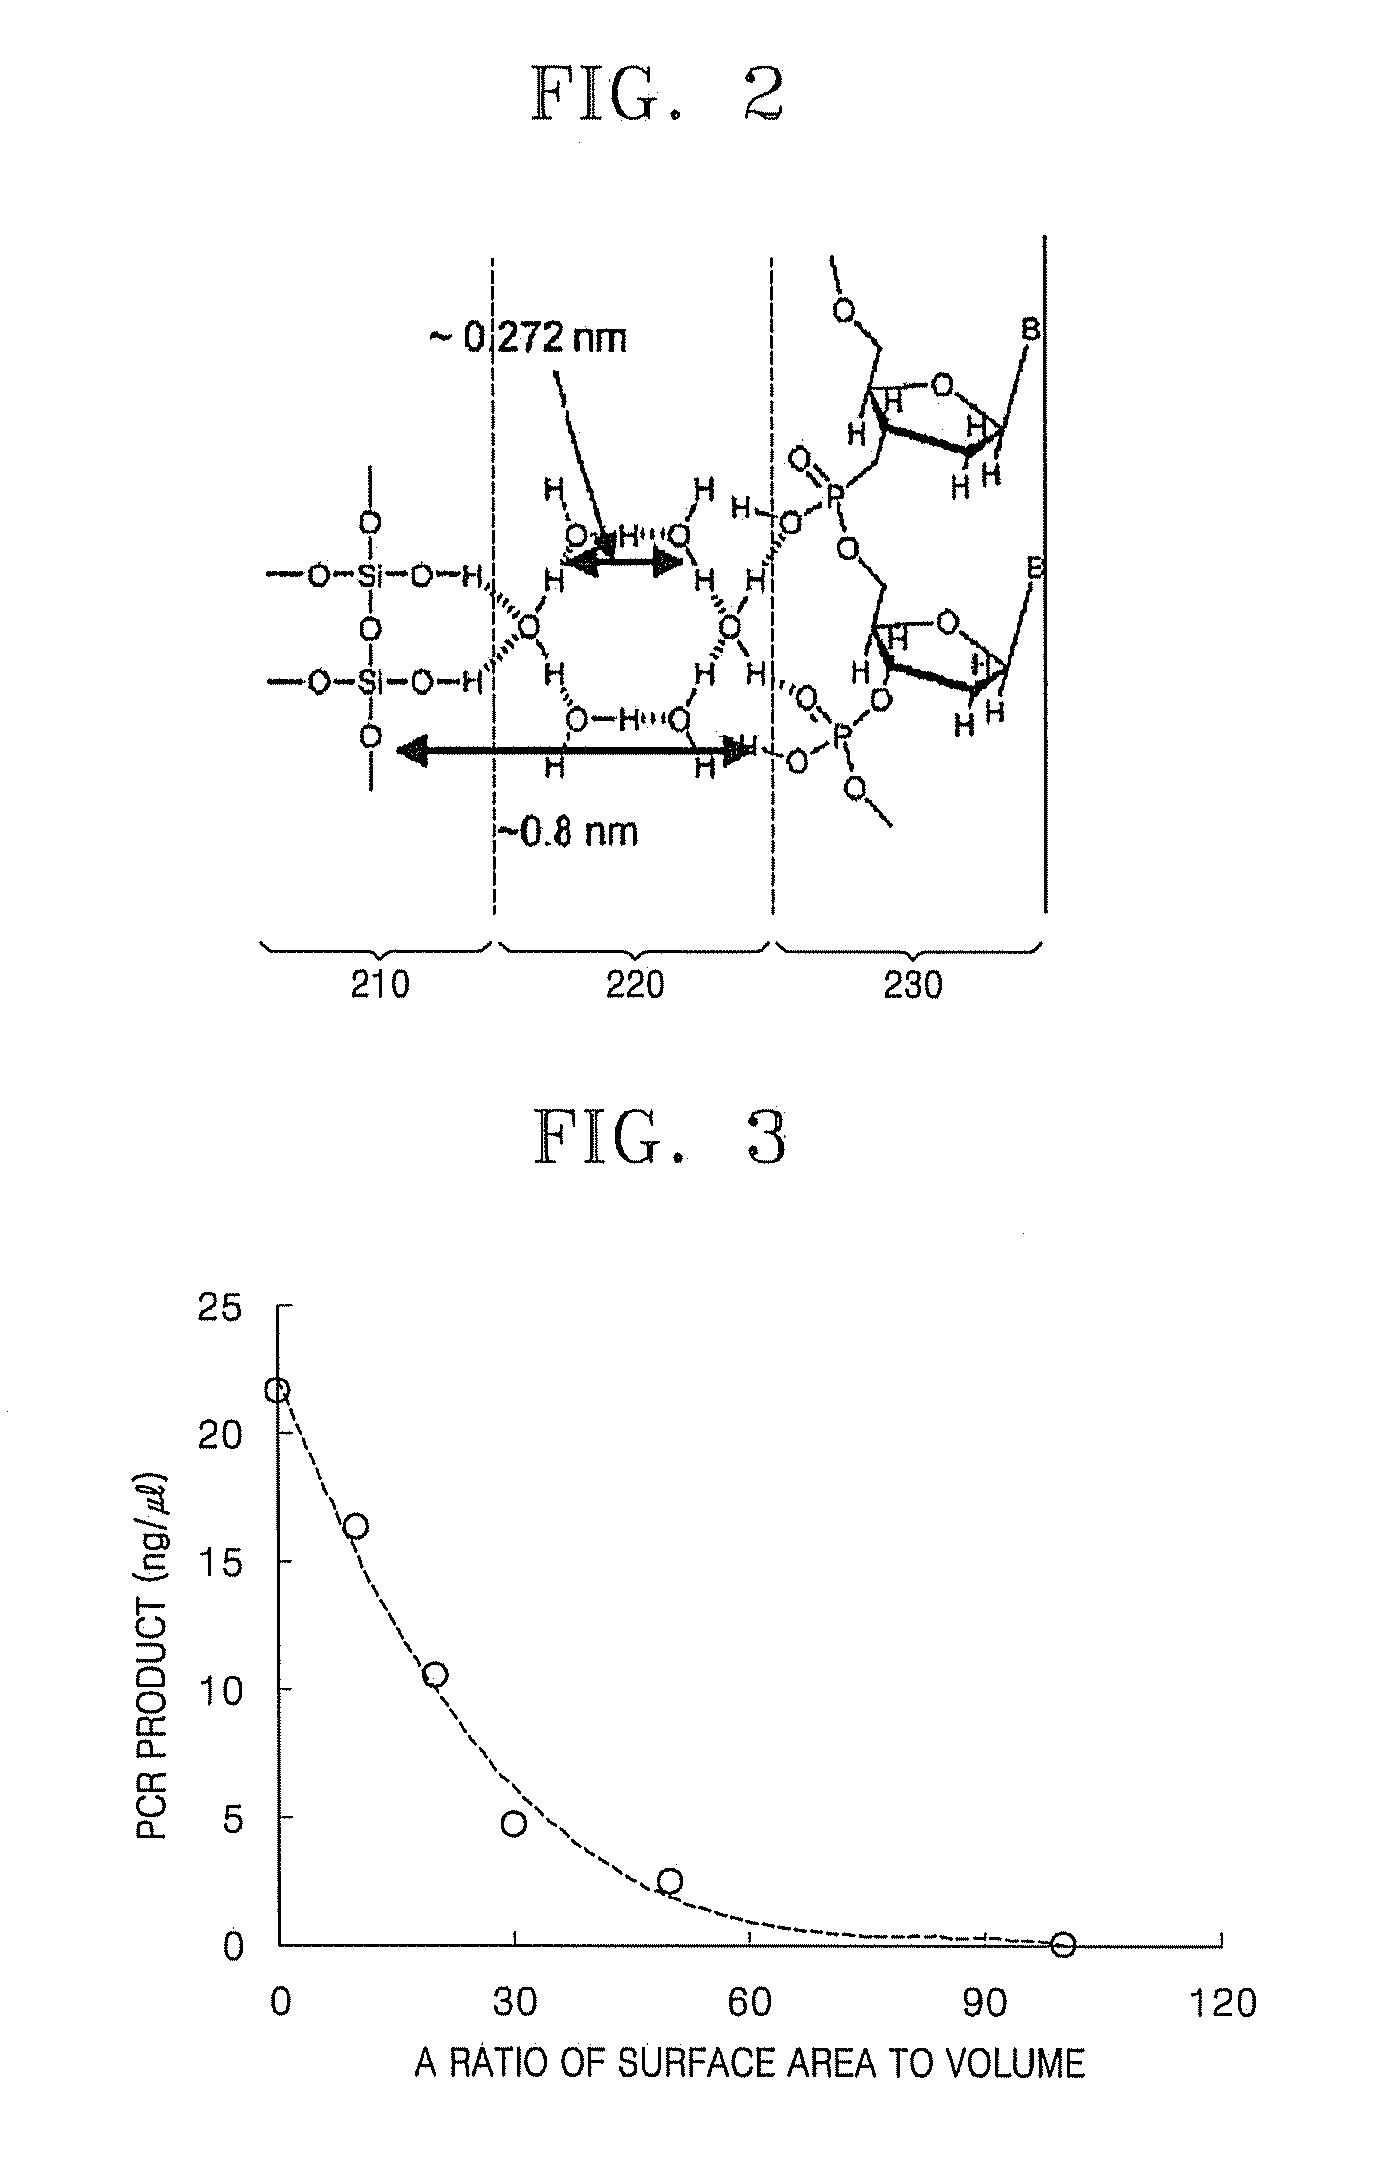
[0054]PCR efficiency was determined as a function of increasing surface area of a chip. PCR was performed using a TMC1000 (Samsung) instrument. The TMC1000 is an instrument that performs quantitative PCR on a silicon-based chip. Unless otherwise specified, a template DNA used in all the examples is a genome DNA of E. coli BL21, 1.4×10⁵ copies of which were used per reaction. A copy of genome DNA has seven target nucleic acids (16s-rRNA gene), and thus a total of 106 copies of the target gene per reaction are included. A forward primer (YCCAKACTCCTACGGGAGGC; SEQ ID NO: 1) and a reverse primer (GTATTACCGCRRCTGCTGGCAC; SEQ ID NO: 2) were used as a PCR primer.
[0055]Unless otherwise specified, a PCR mixture comprises 1×PCR buffer (Solgent Co. Ltd.), 5.0 mM of MgCl2, 200 μM of dNTP, 0.2 μM of each primer, 0.1 mg / ml of BSA, and 0.1 U / μl of Taq DNA polymerase. Temperature condition of PCR is as follows. PCR was performed in an...
example 2
PCR Efficiency as a Function of PEG Concentration
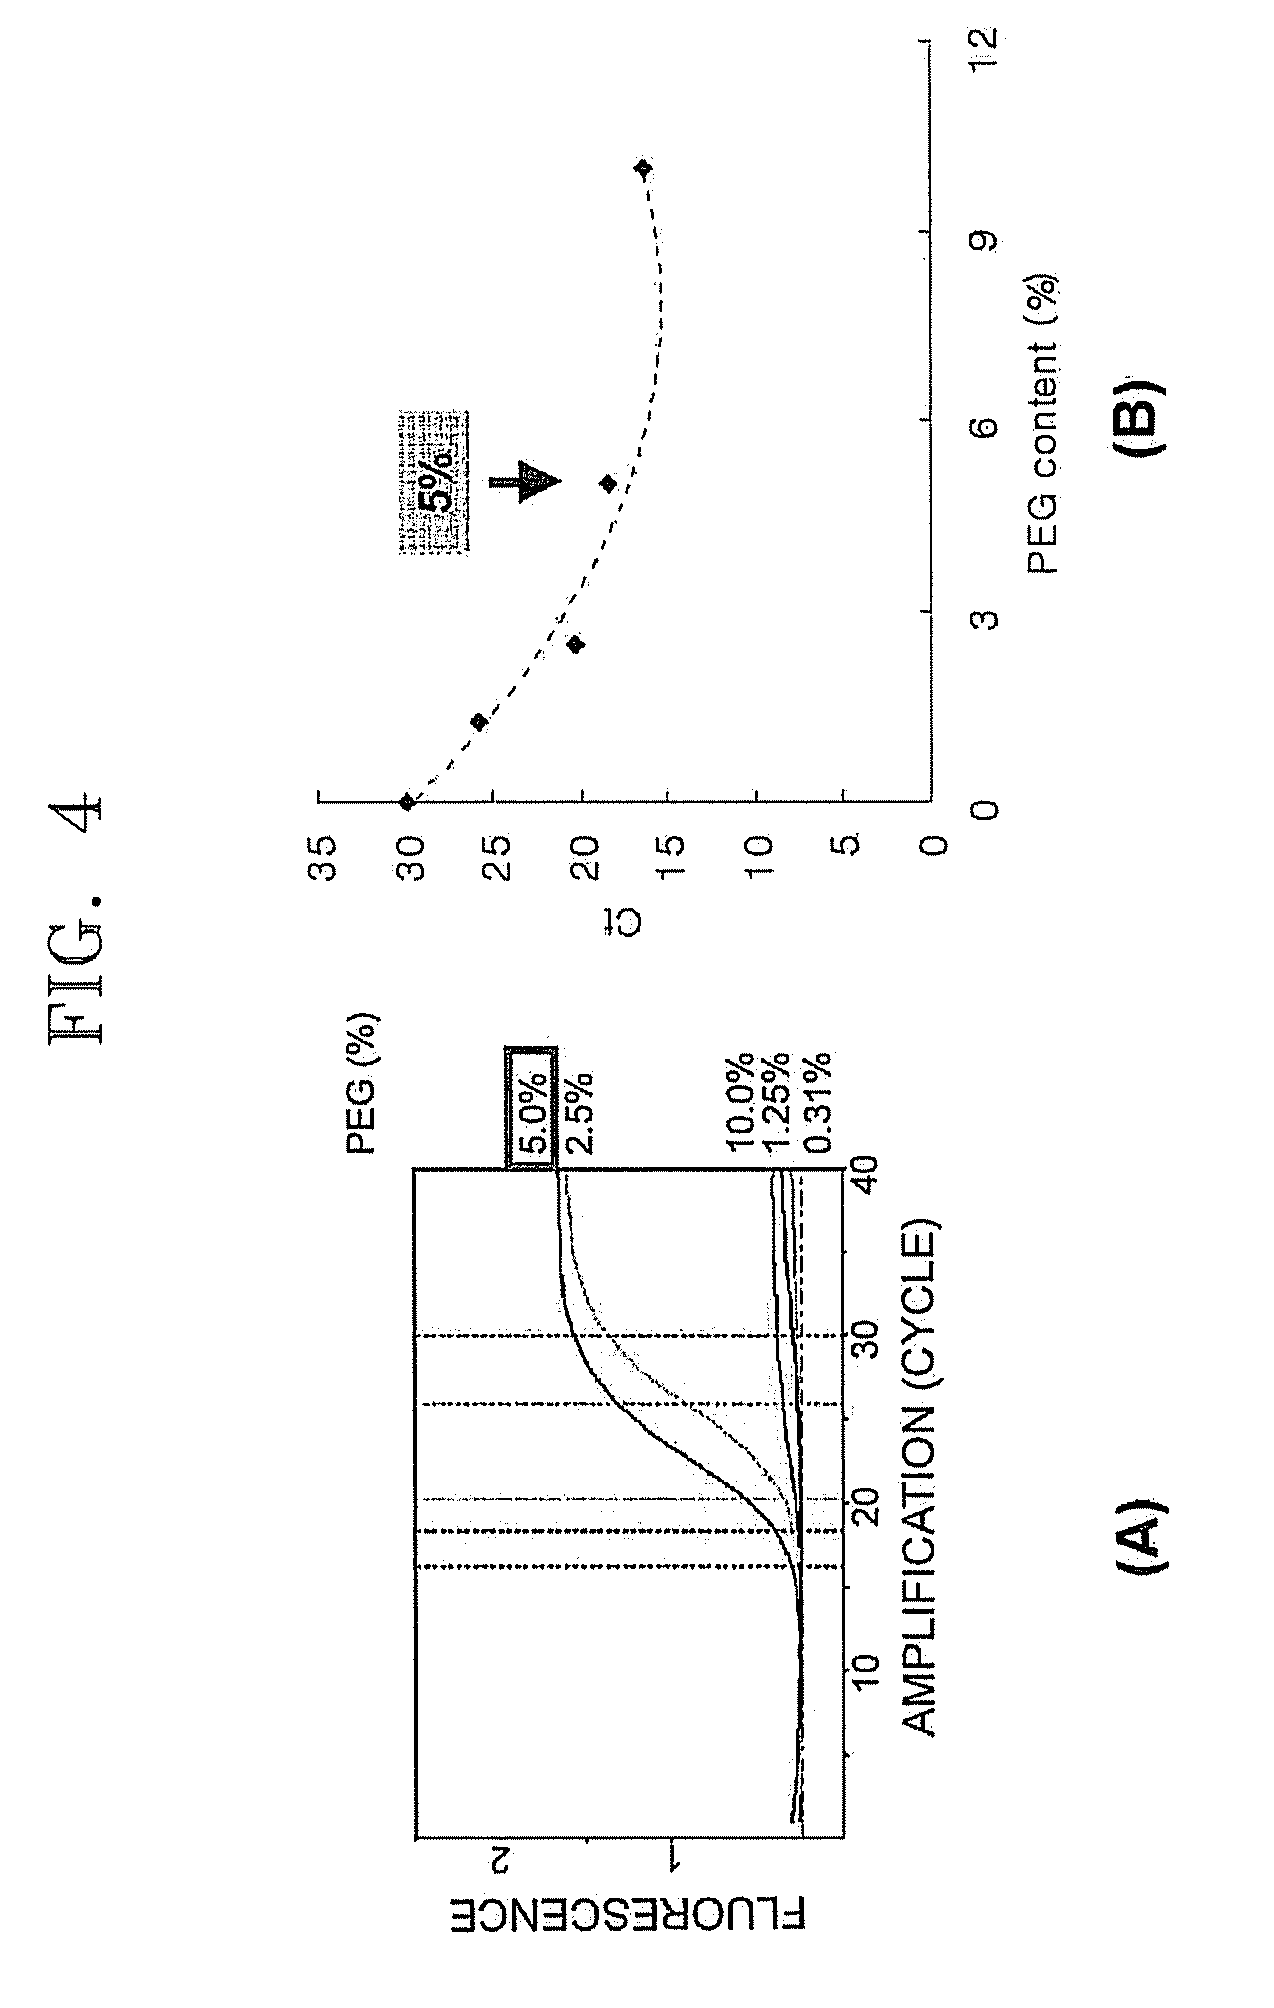
[0057]PCR efficiency as a function of concentration of polyethylene glycol (PEG) with respect to a chip having a large surface area was determined. PCR was performed in the same manner as in Example 1 except that 5 samples were prepared by adding PEG in concentrations of 0.31 wt %, 1.25 wt %, 2.5 wt %, 5 wt %, and 10 wt % to a PCR mixture, based on the total weight of PCR mixture. FIG. 4 illustrates two graphs ((A) and (B)) showing PCR efficiency with respect to PEG concentration. In FIG. 4, the graph on the left (A) refers to Rn values, and the graph on the right (B) refers to fluorescence measurement values Ct. The fluorescence measurement values Ct are represented by determining the amount of fluorescence amplified in real time as a threshold cycle. When the same sample is used, the lower the Ct value is, the higher the PCR efficiency. Ct is a unit indicating that 1 cycle difference denotes doubling or halving DNA concentration. Rn...
example 3
PCR Efficiency According to a Concentration of BSA
[0058]PCR efficiency as a function of the concentration of bovine serum albumin (BSA) with respect to a chip having a large surface area was determined. PCR was performed in the same manner as in Example 1, except that 5% (w / w) of PEG was added to a PCR mixture based on the total weight of PCR mixture, and 5 samples were prepared by adding amounts of 0.62 mg / ml, 1.25 mg / ml, 2.5 mg / ml, 5 mg / ml, and 10 mg / ml of BSA were added thereto, based on the total volume of PCR mixture. FIG. 5 illustrates two graphs ((A) and (B)) showing PCR efficiency as a function of BSA concentration. In FIG. 5, the graph on the left panel (A) refers to Rn values, and the graph on the right (B) refers to Ct values. Thus as shown in FIG. 5, when 0.62 mg / ml of BSA is added, Rn has the highest value, and Ct has the lowest value, representing the highest PCR efficiency.
PUM
| Property | Measurement | Unit |
|---|---|---|
| Length | aaaaa | aaaaa |
| Concentration | aaaaa | aaaaa |
| Molar density | aaaaa | aaaaa |
Abstract
Description
Claims
Application Information
 - R&D
- Intellectual Property
- Life Sciences
- Materials
- Tech Scout
- Unparalleled Data Quality
- Higher Quality Content
- 60% Fewer Hallucinations
Browse by: Latest US Patents, China's latest patents, Technical Efficacy Thesaurus, Application Domain, Technology Topic, Popular Technical Reports.
© 2025 PatSnap. All rights reserved.Legal|Privacy policy|Modern Slavery Act Transparency Statement|Sitemap|About US| Contact US: help@patsnap.com


