Graph with zoom operated clustering functions

Inactive Publication Date: 2007-12-13
MATINA NICHOLAS A
View PDF11 Cites 23 Cited by
  • Summary
  • Abstract
  • Description
  • Claims
  • Application Information

AI Technical Summary

Benefits of technology

[0007]The present invention is directed to programs and methods of presentation of a plurality of data points in which at least some of the data points are clustered into higher level clusters and/or de-clustered from higher level clusters to lower level clusters or even original data, wherein deconvolution and agglomeration are a function of a user that zooms in and/or out of a display. Using such data presentation, excessive detail information

Problems solved by technology

Most typically, and especially where there is a wealth of data points to be displayed, at least some information content is lost at any given magnification.
For example, where data points are taken in millisecond intervals for a period of 24 hours, display of the entire 24 hour data will result in loss of resolution and obscure brief spikes or other short-term irregularities.
While such approaches typically provide at least some more detailed insight into the data points in a certain interval, several difficulties nevertheless remain.
Regardless of the manner of magnification, currently known methods to increase and/or decrea

Method used


Image

  • Graph with zoom operated clustering functions
  • Graph with zoom operated clustering functions
  • Graph with zoom operated clustering functions

Examples


Embodiment Construction

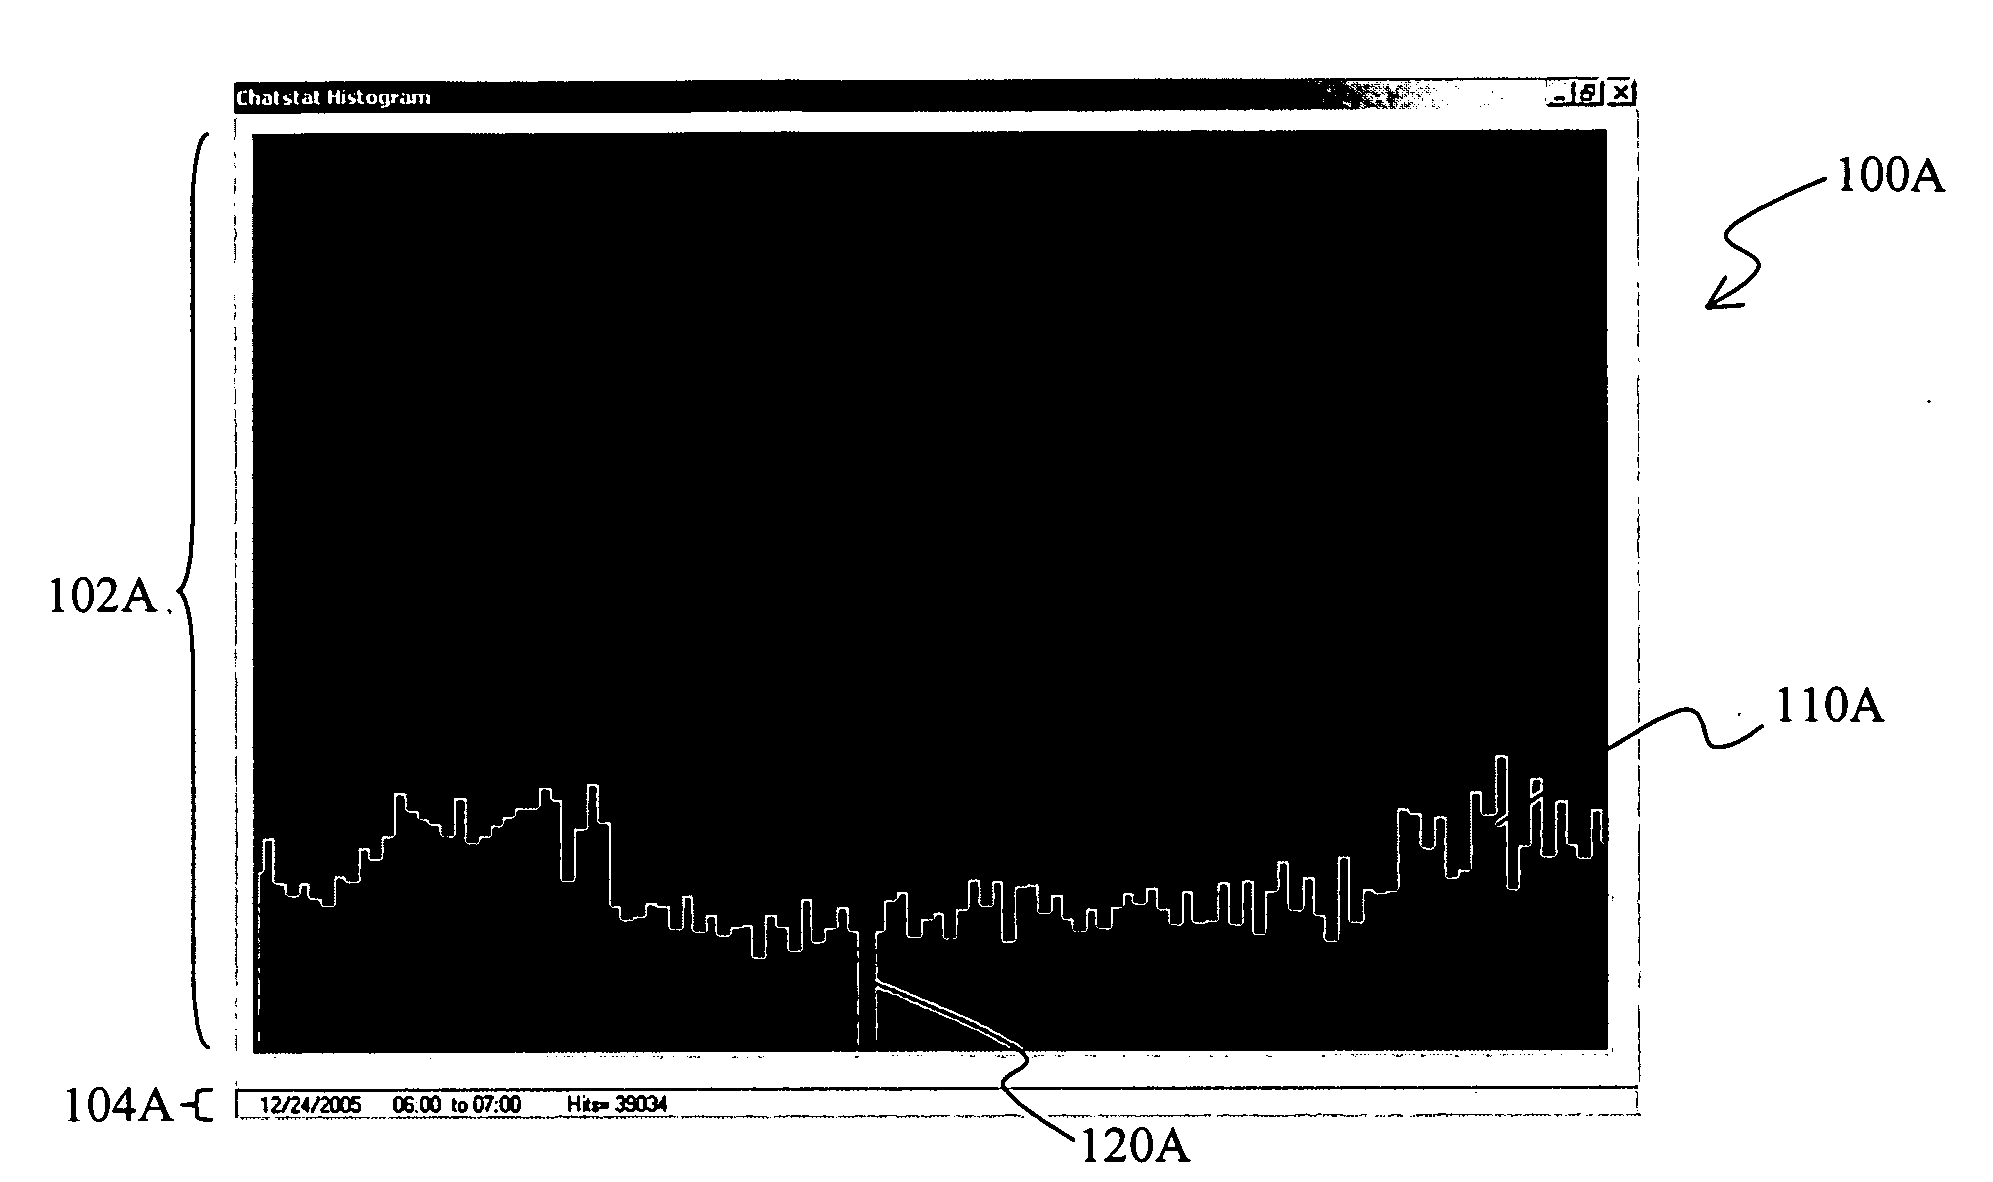
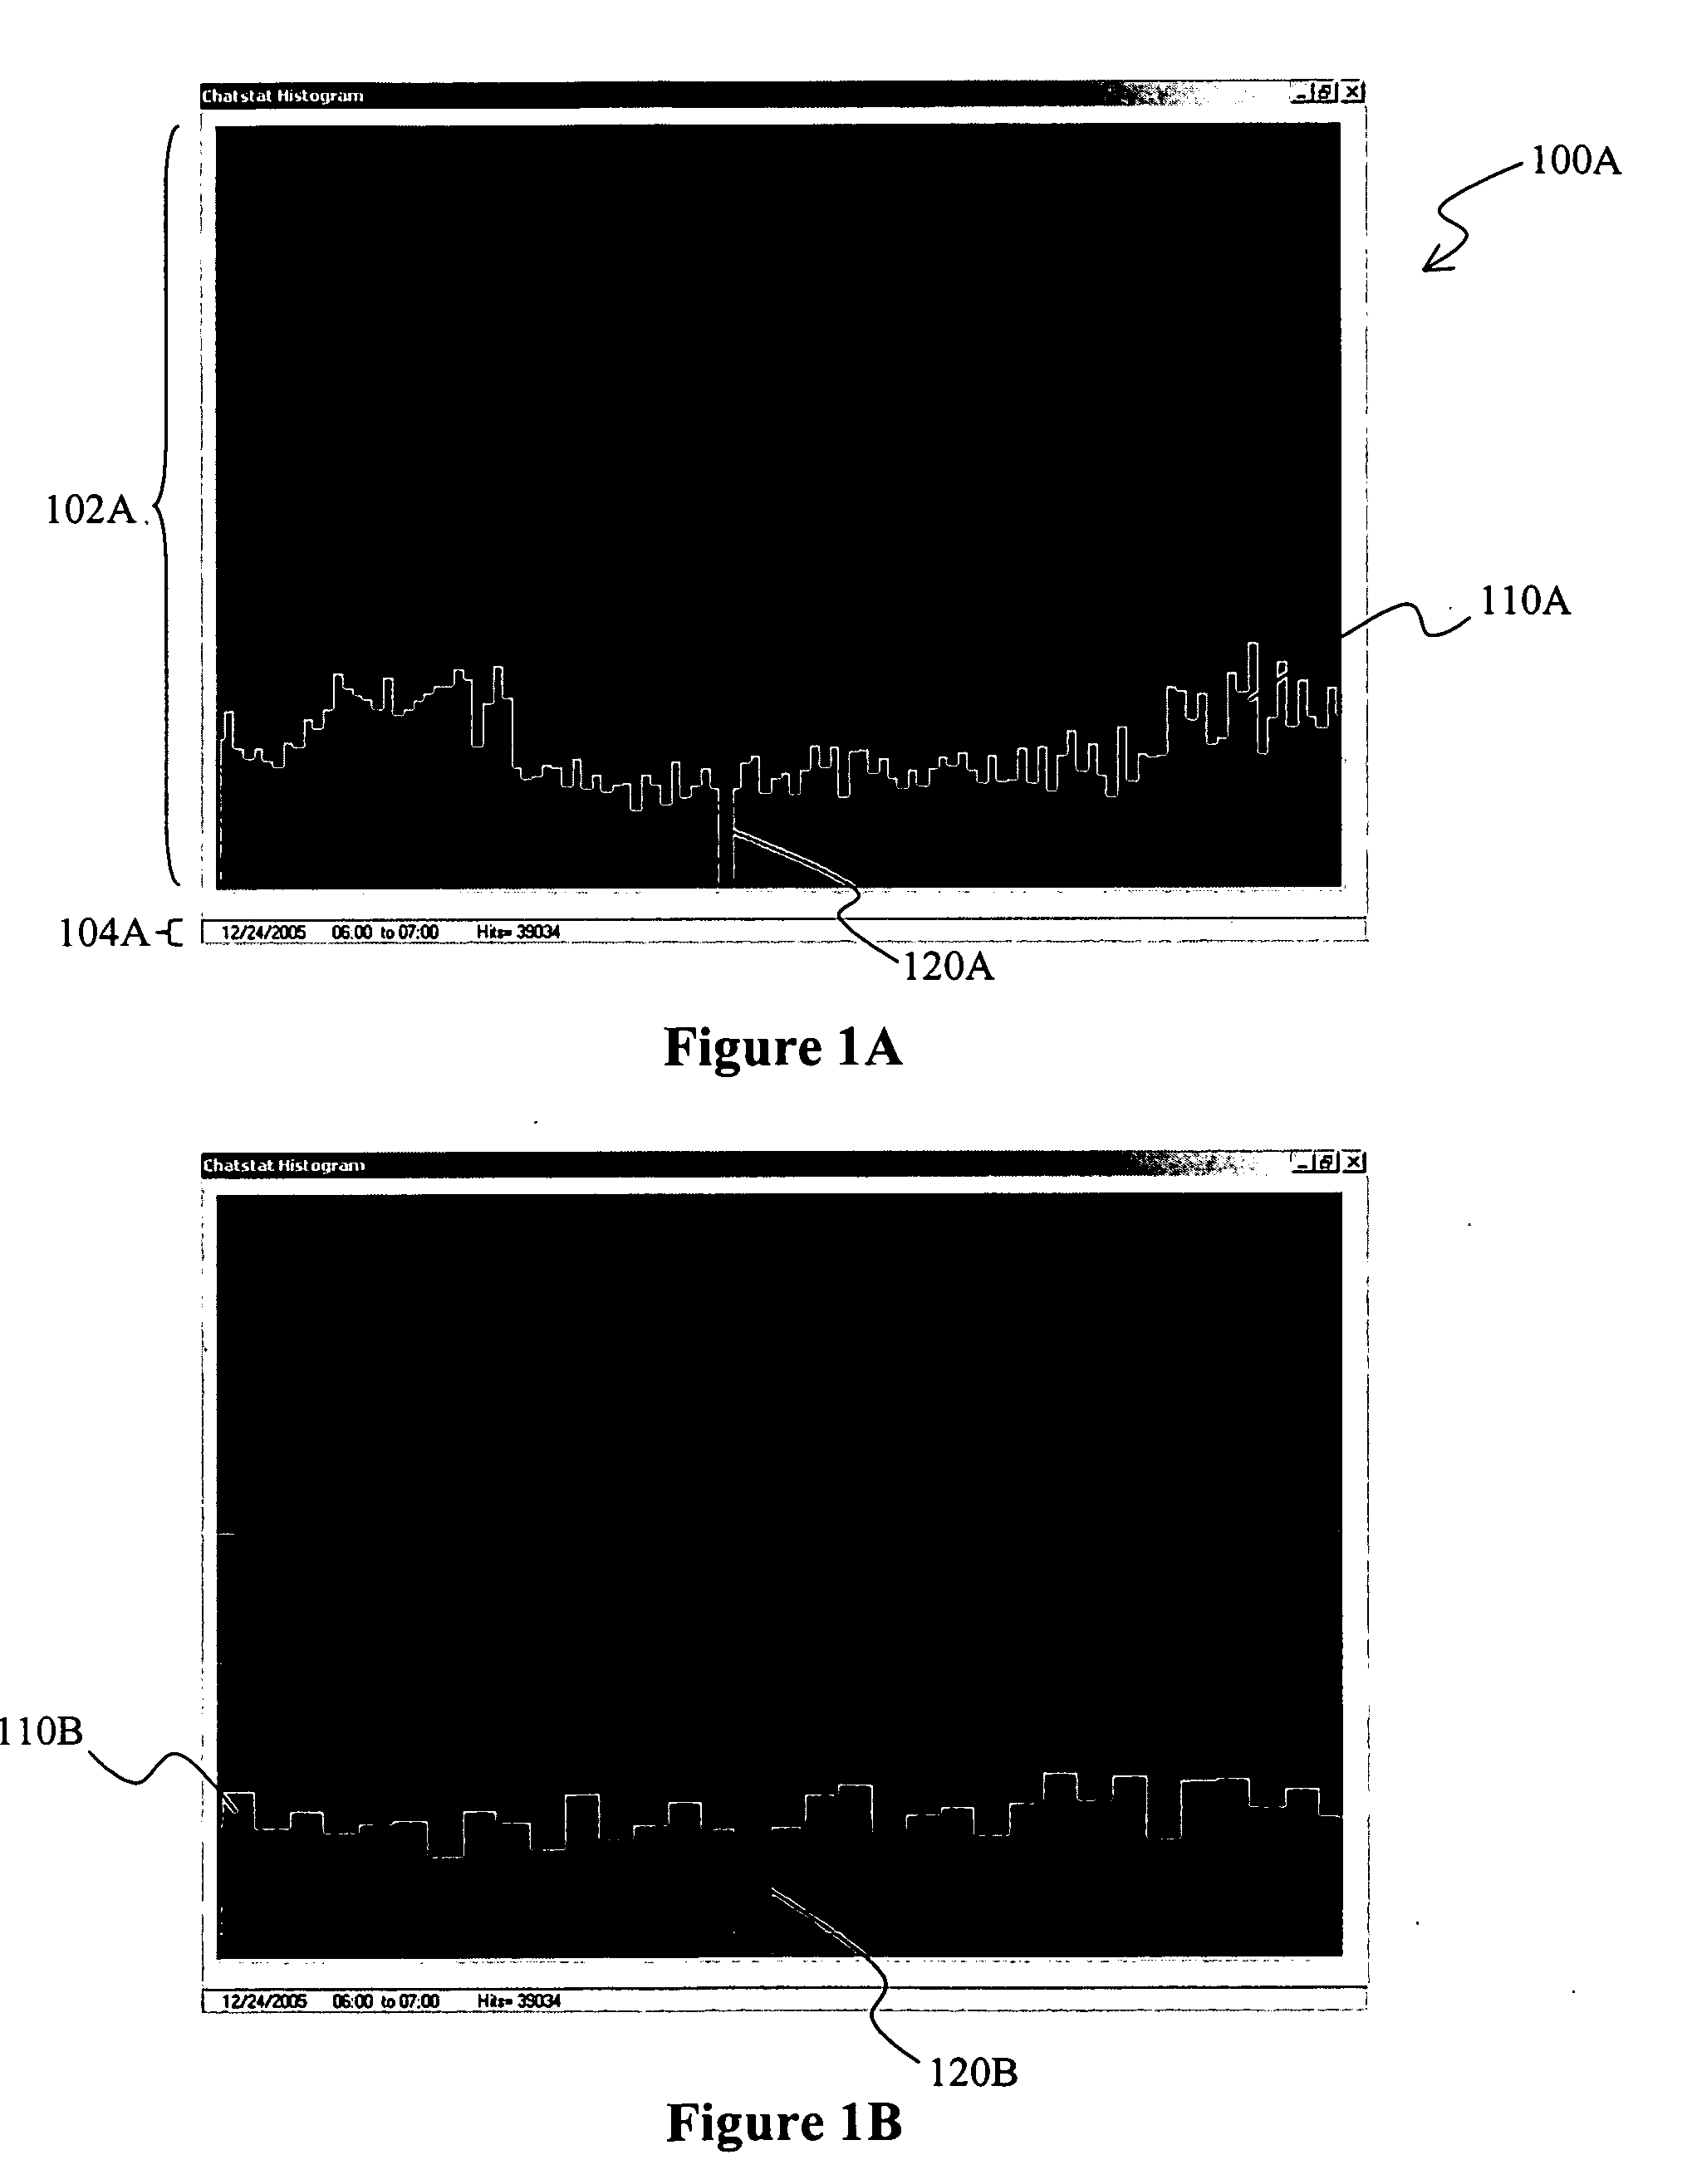
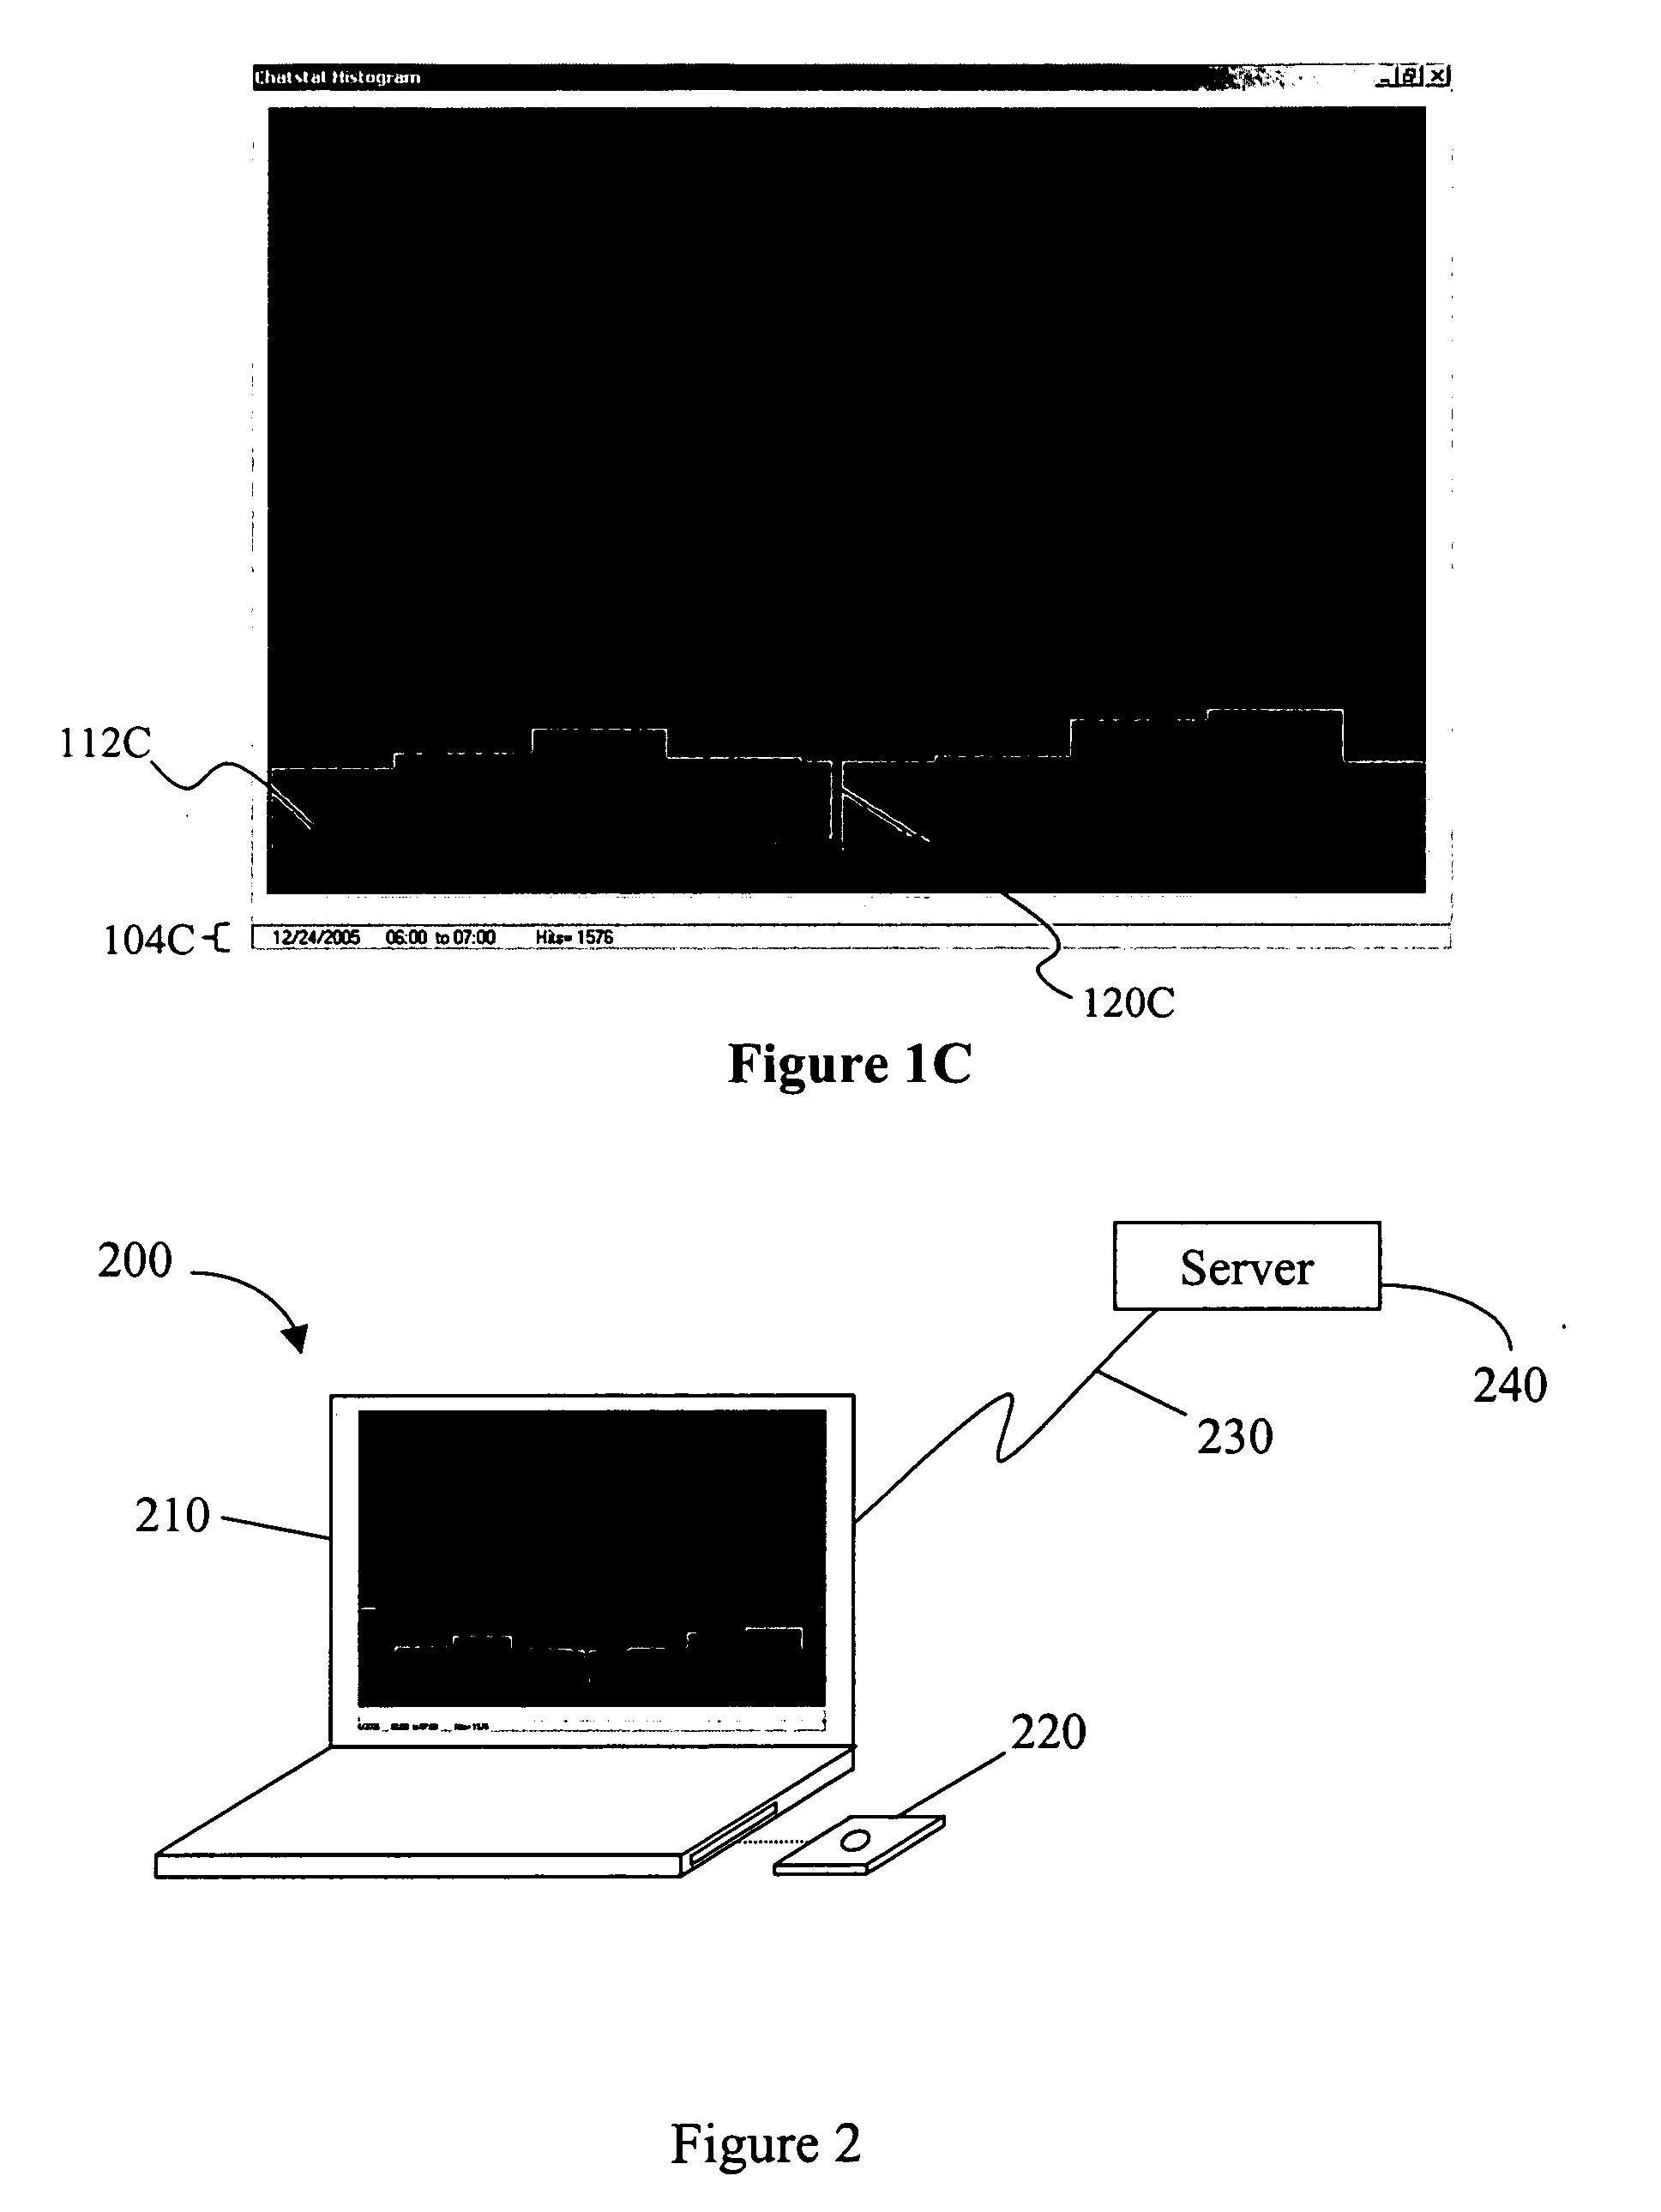
[0018]The inventor has discovered that a plurality of data points can be presented in a display in which the data points can be viewed at any given and variable zoom without losing relevant information associated with the data points. Most advantageously, as a user zooms in a graph or other display, a second display is generated and presented in which detail information of the zoomed-in area is displayed as a plurality of data points in a de-clustered manner. Similarly, as a user zooms out of a particular area, individual data points are clustered into appropriate higher level clusters to thereby prevent information overload and generate a meaningful information output. In especially contemplated aspects, the presentation of the data points allows for a continuous zoom-in and zoom-out function as well as for a continuous panning function.

[0019]As used herein, the term “continuous” when used in conjunction with the terms “zoom”, “zooming”, “pan”, or “panning” refers to the manner of ...


PUM


Abstract

Software and methods of graphic representation of data are contemplated in which the data points are displayed in a clustered and/or de-clustered format as a function of a user zooming in and out of the display. Most preferably, the zoom is a continuous zoom, and the program further allows for panning within the display.

Description

FIELD OF THE INVENTION[0001]The field of the invention is data manipulation and display of manipulated data.BACKGROUND OF THE INVENTION[0002]Graphic representation of data points from numerous sources is a common tool to obtain information on particular characters, trends, and other parameters. Most typically, and especially where there is a wealth of data points to be displayed, at least some information content is lost at any given magnification. For example, where data points are taken in millisecond intervals for a period of 24 hours, display of the entire 24 hour data will result in loss of resolution and obscure brief spikes or other short-term irregularities. On the other hand, where only a few seconds or even shorter intervals are displayed, spikes, short-term irregularities, or brief trends tend to be overemphasized where no larger context is visible.[0003]To circumvent such problems associated with data management of large quantities of data points, numerous approaches hav...

Claims


Application Information

Patent Timeline
IPC IPC(8): G06T11/20
CPCG06T11/206
Inventor MATINA, NICHOLAS A.
Owner MATINA NICHOLAS A
Why Eureka
Try Eureka