Method and system for detecting difference between plural observed results

a technology of plural observed results and detection methods, applied in the direction of denominational number representation computation, testing/monitoring control systems, instruments, etc., can solve the problems of difficult to determine the reference value of a variable for detecting anomalies, and it is unrealistic to assume that enough experienced engineers are available in every field

Inactive Publication Date: 2008-01-10
IBM CORP
View PDF10 Cites 19 Cited by
  • Summary
  • Abstract
  • Description
  • Claims
  • Application Information

AI Technical Summary

Problems solved by technology

Detecting and analyzing anomalies of dynamic systems is an important technical challenge in various areas in the manufacturing industry.
As a result, the utility of such traditional approaches is quite limited in many cases.
Thus it is difficult to determine the reference value of a variable for detecting anomalies.
While experienced engineers may be able to make a decision on the state of the system based on such complicated numerical data, it is unrealistic to assume that enough manpower of experienced engineers is available in every phase and place of anomaly detection.
In addition, the knowledge of experienced engineers is often hard to translate to specific mathemat

Method used


Image

  • Method and system for detecting difference between plural observed results
  • Method and system for detecting difference between plural observed results
  • Method and system for detecting difference between plural observed results

Examples


Embodiment Construction

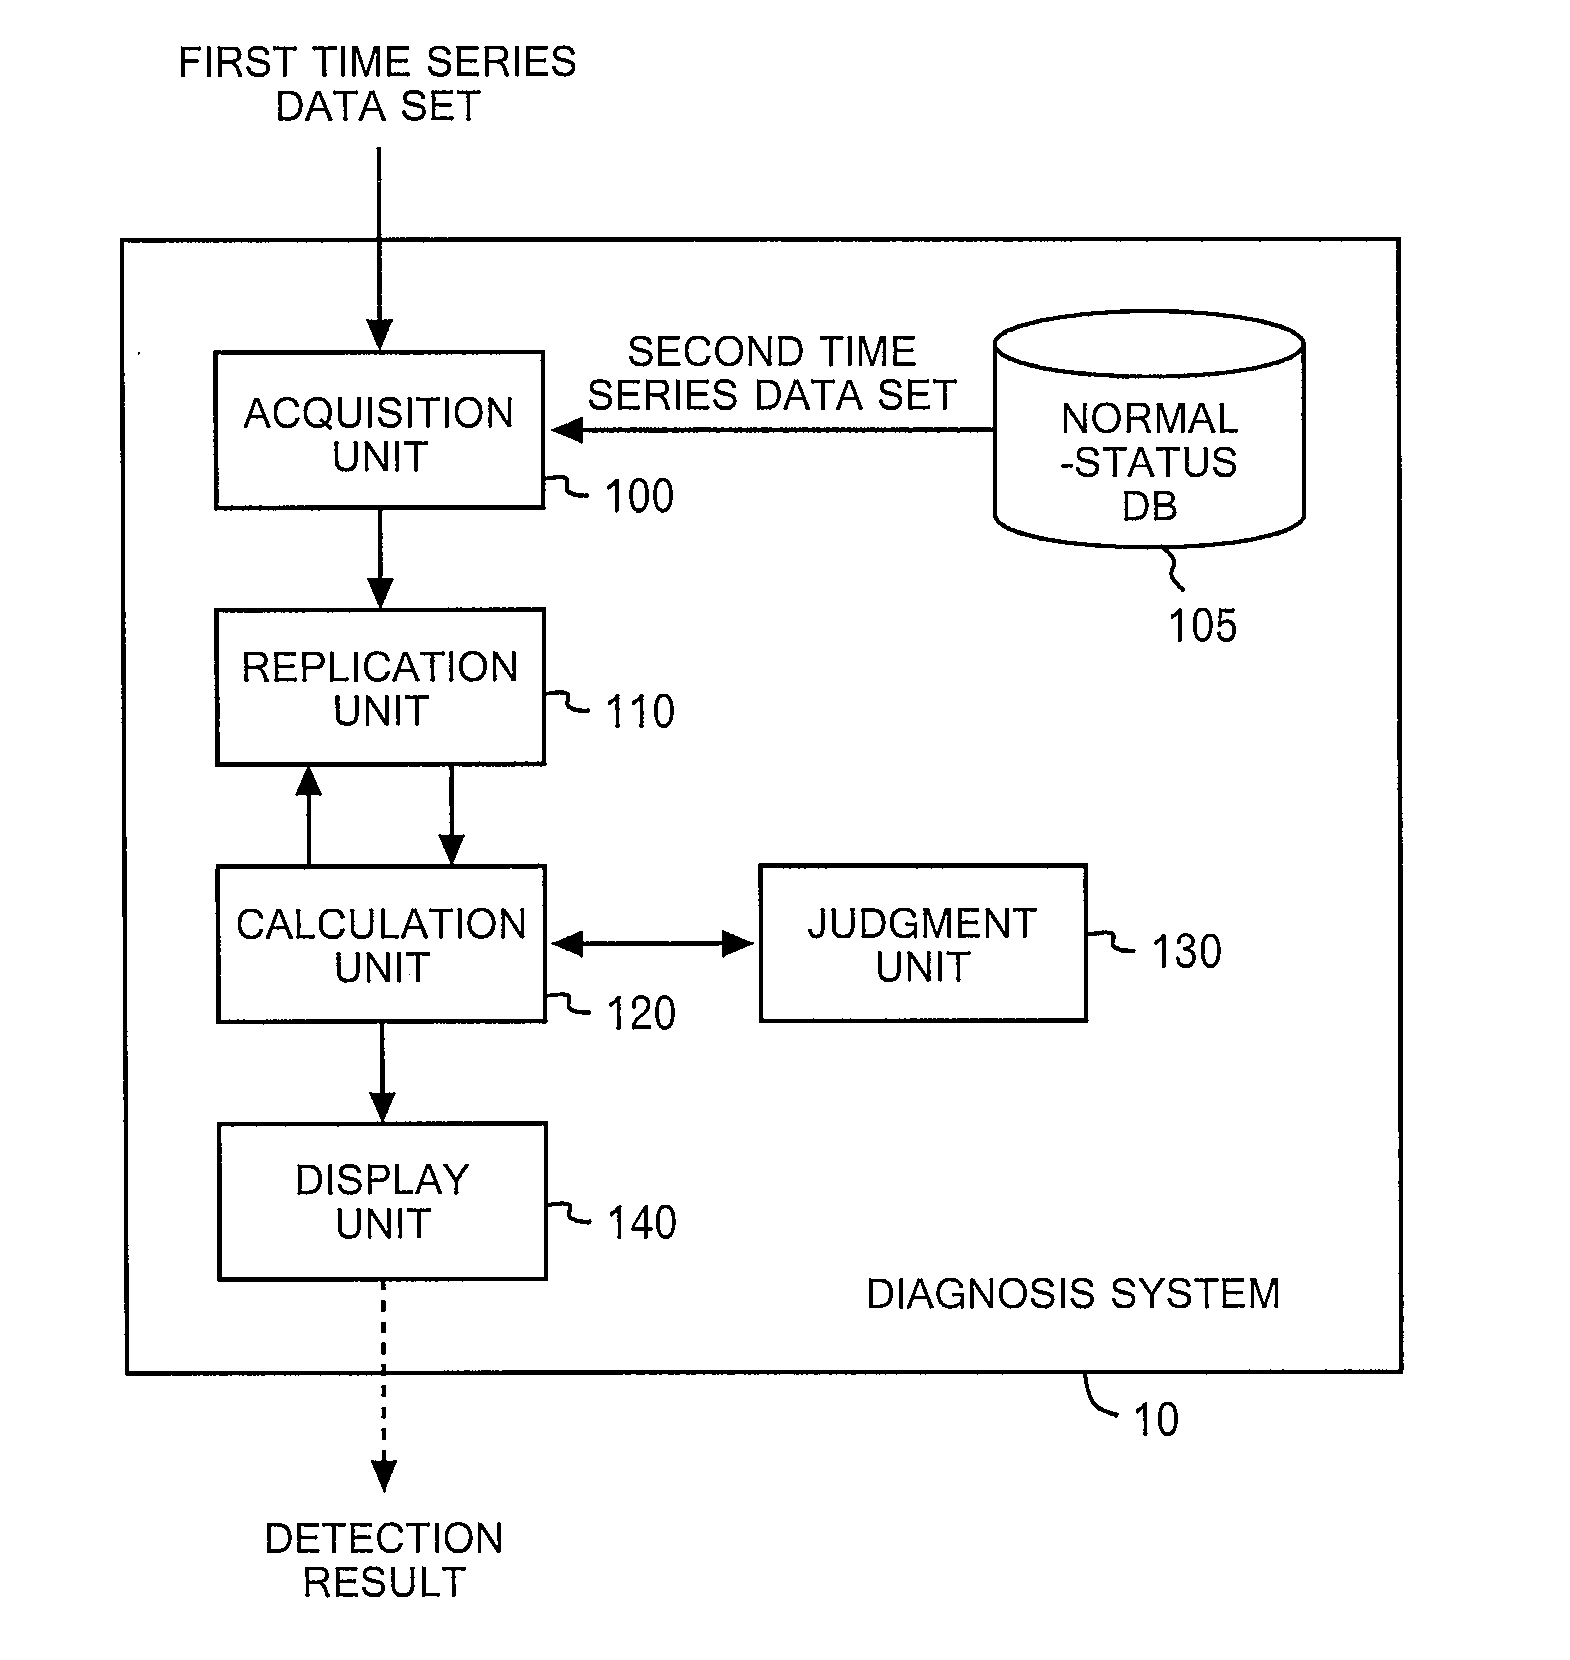
[0039]Hereinafter, the present invention will be described by using an embodiment of the present invention. However, the following embodiment does not limit the present invention according to the scope of claims, and all the combinations of features described in the embodiment are not always required for solving means of the invention.

[0040]FIG. 1 shows a functional configuration of a diagnosis system 10. The diagnosis system 10 includes an acquisition unit 100, a normal-status database (DB) 105, a replication unit 110, a calculation unit 120, a judgment unit 130 and a display unit 140. The acquisition unit 100 acquires a first time series data set from outside for each observation variable of a plurality of observation variables, and acquires a second time series data set based on data in the normal-status DB 105. The first time series data set includes a plurality of observed values obtained by observing a certain observation target over time, and is to be used for detecting anoma...


PUM


Abstract

A method and system for analyzing time series data. In an embodiment, a loop is executed and terminated upon a specified maximum number of iterations of the loop being performed or upon a difference between scores in successive iterations of the loop not being greater than a specified tolerance, wherein the score in each iteration is calculated as function of an absolute value of a difference between respective cumulative probability values of first and second cumulative probability distributions which are generated from respectively first and second time series data sets. In an embodiment, time series data is processed in a sequence of time periods, wherein a combined cumulative probability distribution is generated in each time period by combining a cumulative probability distribution of new time series data with previously combined cumulative probability distribution data according to a ratio of the number of new to previous observed values.

Description

FIELD OF THE INVENTION[0001]The present invention relates to a method and system for detecting a difference between a set of observed results, and in particular, the present invention relates to a method and system for statistically analyzing the difference between time series data sets.BACKGROUND OF THE INVENTION[0002]Detecting and analyzing anomalies of dynamic systems is an important technical challenge in various areas in the manufacturing industry. For example, anomaly detection in a production line has been of particular importance, and a lot of statistical techniques have been developed for quality control purposes. However, most of the traditional statistical quality control techniques are based on a strong assumption of multivariate normal distribution. Unless the system of interest is relatively static and stationary, the distribution of data is far from the normal distribution in general. This is especially the case in the analysis of automotives, where the system is high...

Claims


Application Information

Patent Timeline
IPC IPC(8): G06F7/38
CPCG05B23/024
Inventor IDE, TSUYOSHI
Owner IBM CORP
Why Eureka
Try Eureka