Method and system for analyzing memory leaks occurring in JAVA virtual machine data storage heaps

a technology of java virtual machines and data storage heaps, applied in error detection/correction, instruments, computing, etc., can solve problems such as memory leaks, unanticipated accumulation of data objects in memory, and inability to allocate enough memory

Inactive Publication Date: 2008-08-28
IBM CORP
View PDF11 Cites 45 Cited by
  • Summary
  • Abstract
  • Description
  • Claims
  • Application Information

AI Technical Summary

Problems solved by technology

Diagnosing an unanticipated accumulation of data objects in memory (or “memory leak”) occurring as a result of JVM operations when it is utilizing a large heap size is not always possible with existing memory analysis tools (such as “hprof”), since such tools typically rely on obtaining a representation of data heap status using the “JVMPI” interface (Java Virtual Machine Profiler Interface) operated during “runtime” execution of the JVM program.
The problem with this approach is that the JVMPI interface often cannot allocate sufficient memory to build such a “heap dump” representation when the heap size is large, and the JVM then ceases to function due to lack of remaining free memory and any possibility of analyzing the data heap to correct memory leaks that have occurred as a result of operation of the program is then lost.
Such an analysis is further complicated in cases where a memory leak occurs during actual operation of a “production” data processing system, due to the need to maintain an acceptable level of performance while the diagnosis proceeds during execution of the program, since most memory leak analysis tools cause a degradation in performance of the JVM application during operation and are therefore unsuited to correcting (or “debugging”) memory leaks in a “live” system.
However, due to the iterative nature of problem solving, incremental changes in the understanding of the problem will usually require such a profiler to be re-designed and re-coded in several cycles in order to extract the information needed to detect a memory leak, in turn causing multiple undesired “shutdown” and “restart” cycles during operation of the JVM program.

Method used


Image

  • Method and system for analyzing memory leaks occurring in JAVA virtual machine data storage heaps
  • Method and system for analyzing memory leaks occurring in JAVA virtual machine data storage heaps
  • Method and system for analyzing memory leaks occurring in JAVA virtual machine data storage heaps

Examples


Embodiment Construction

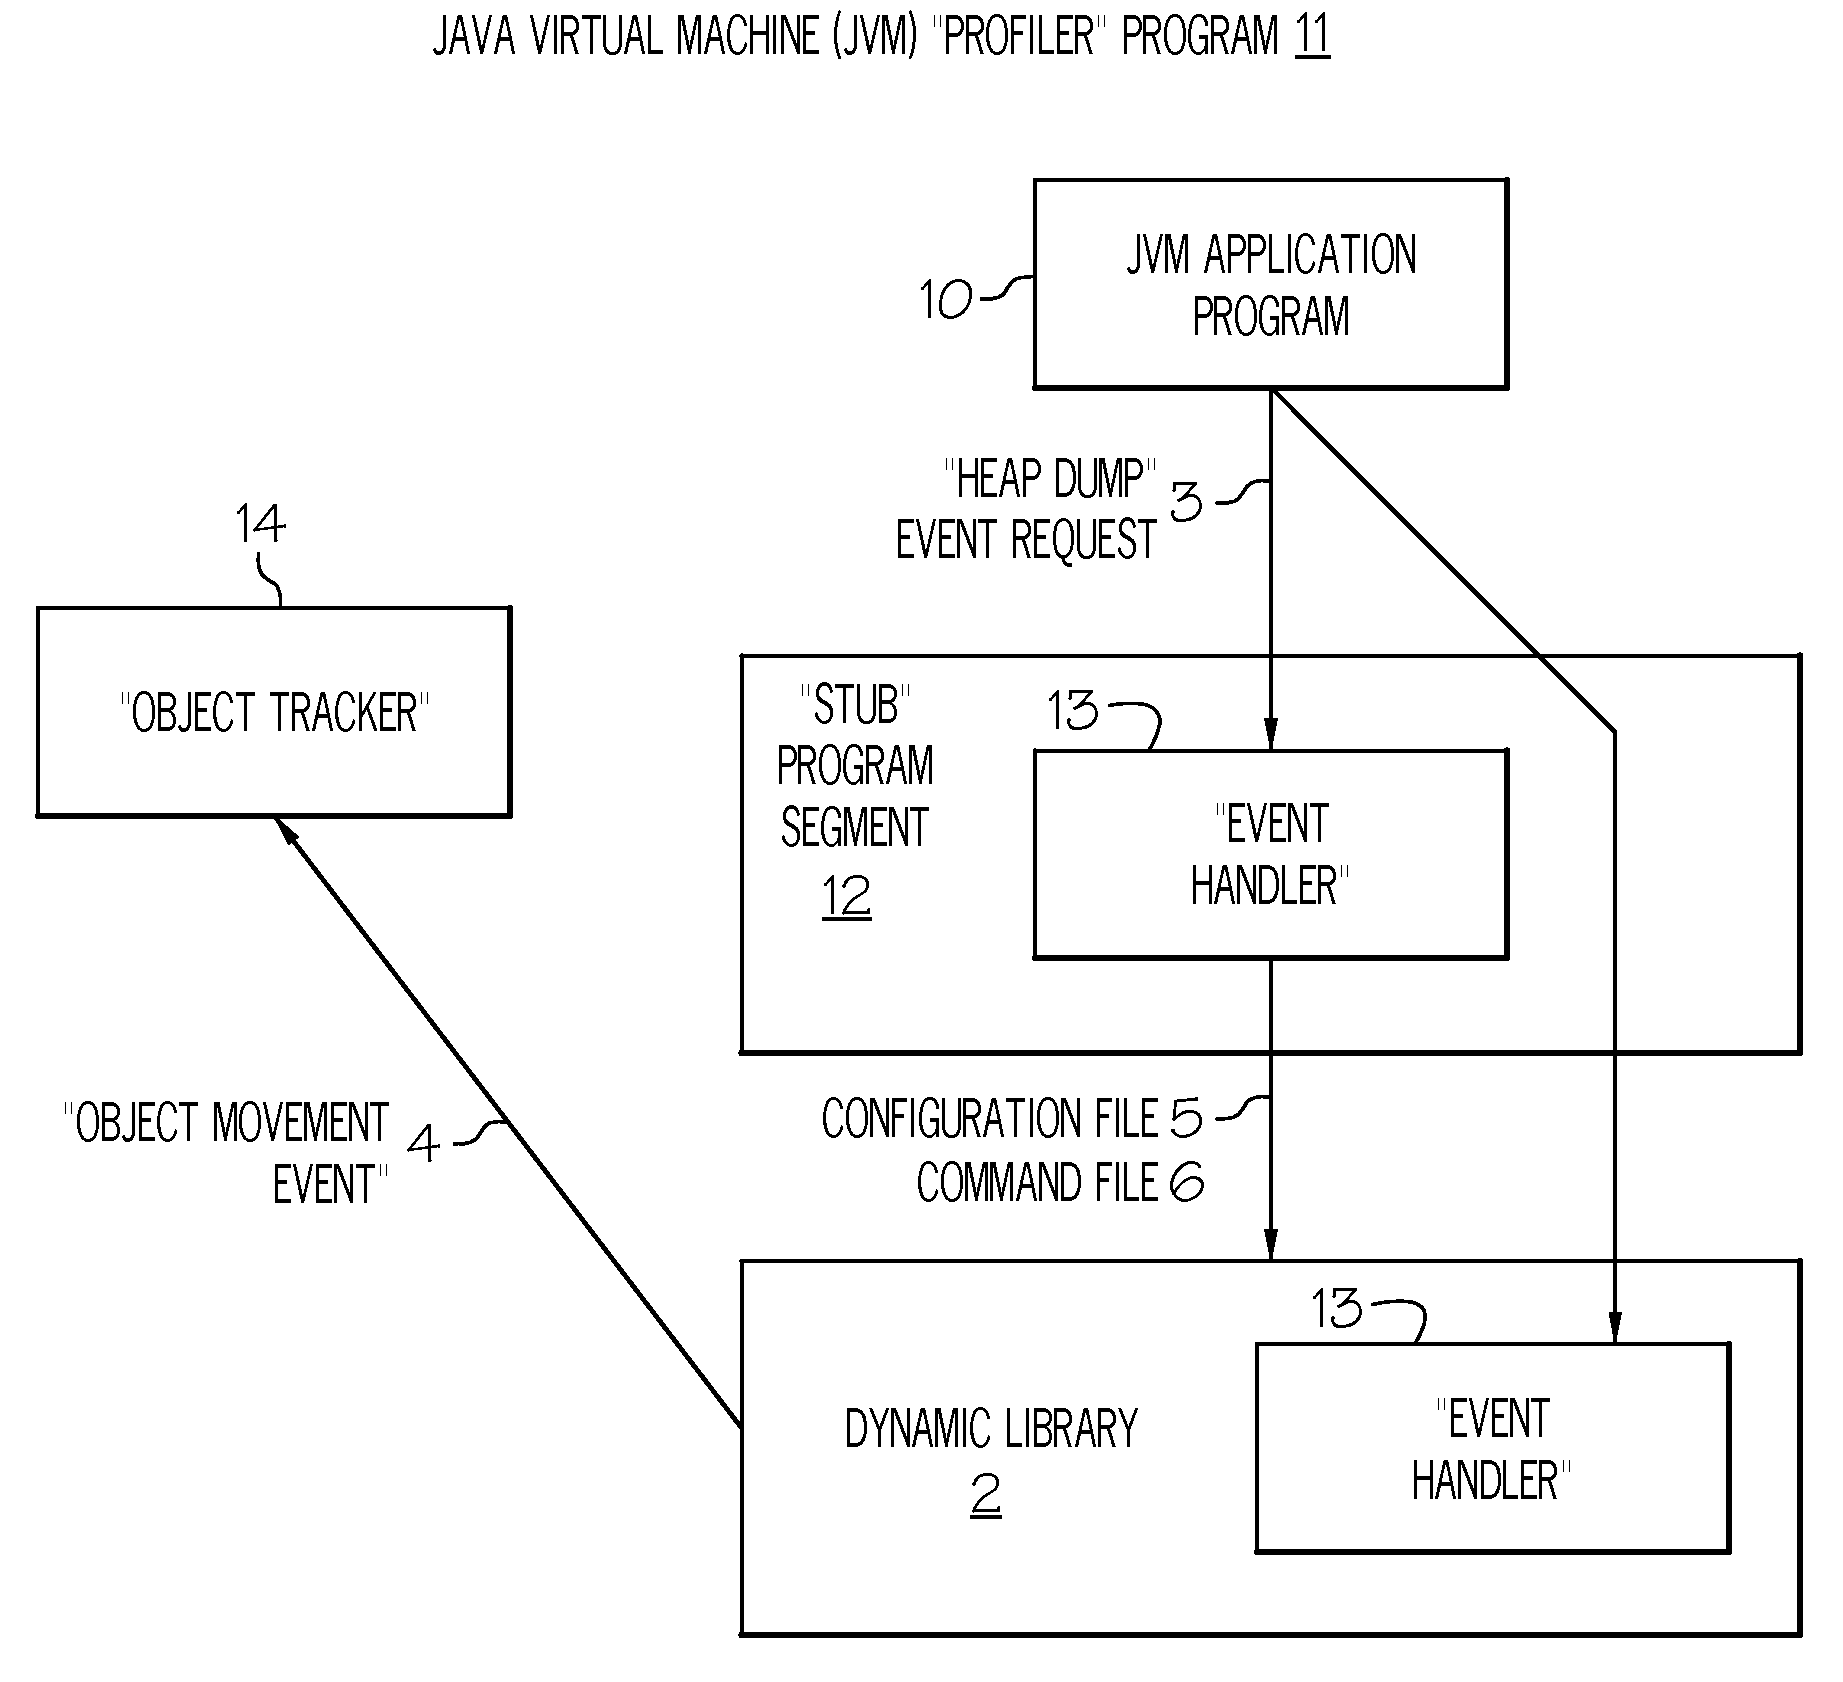
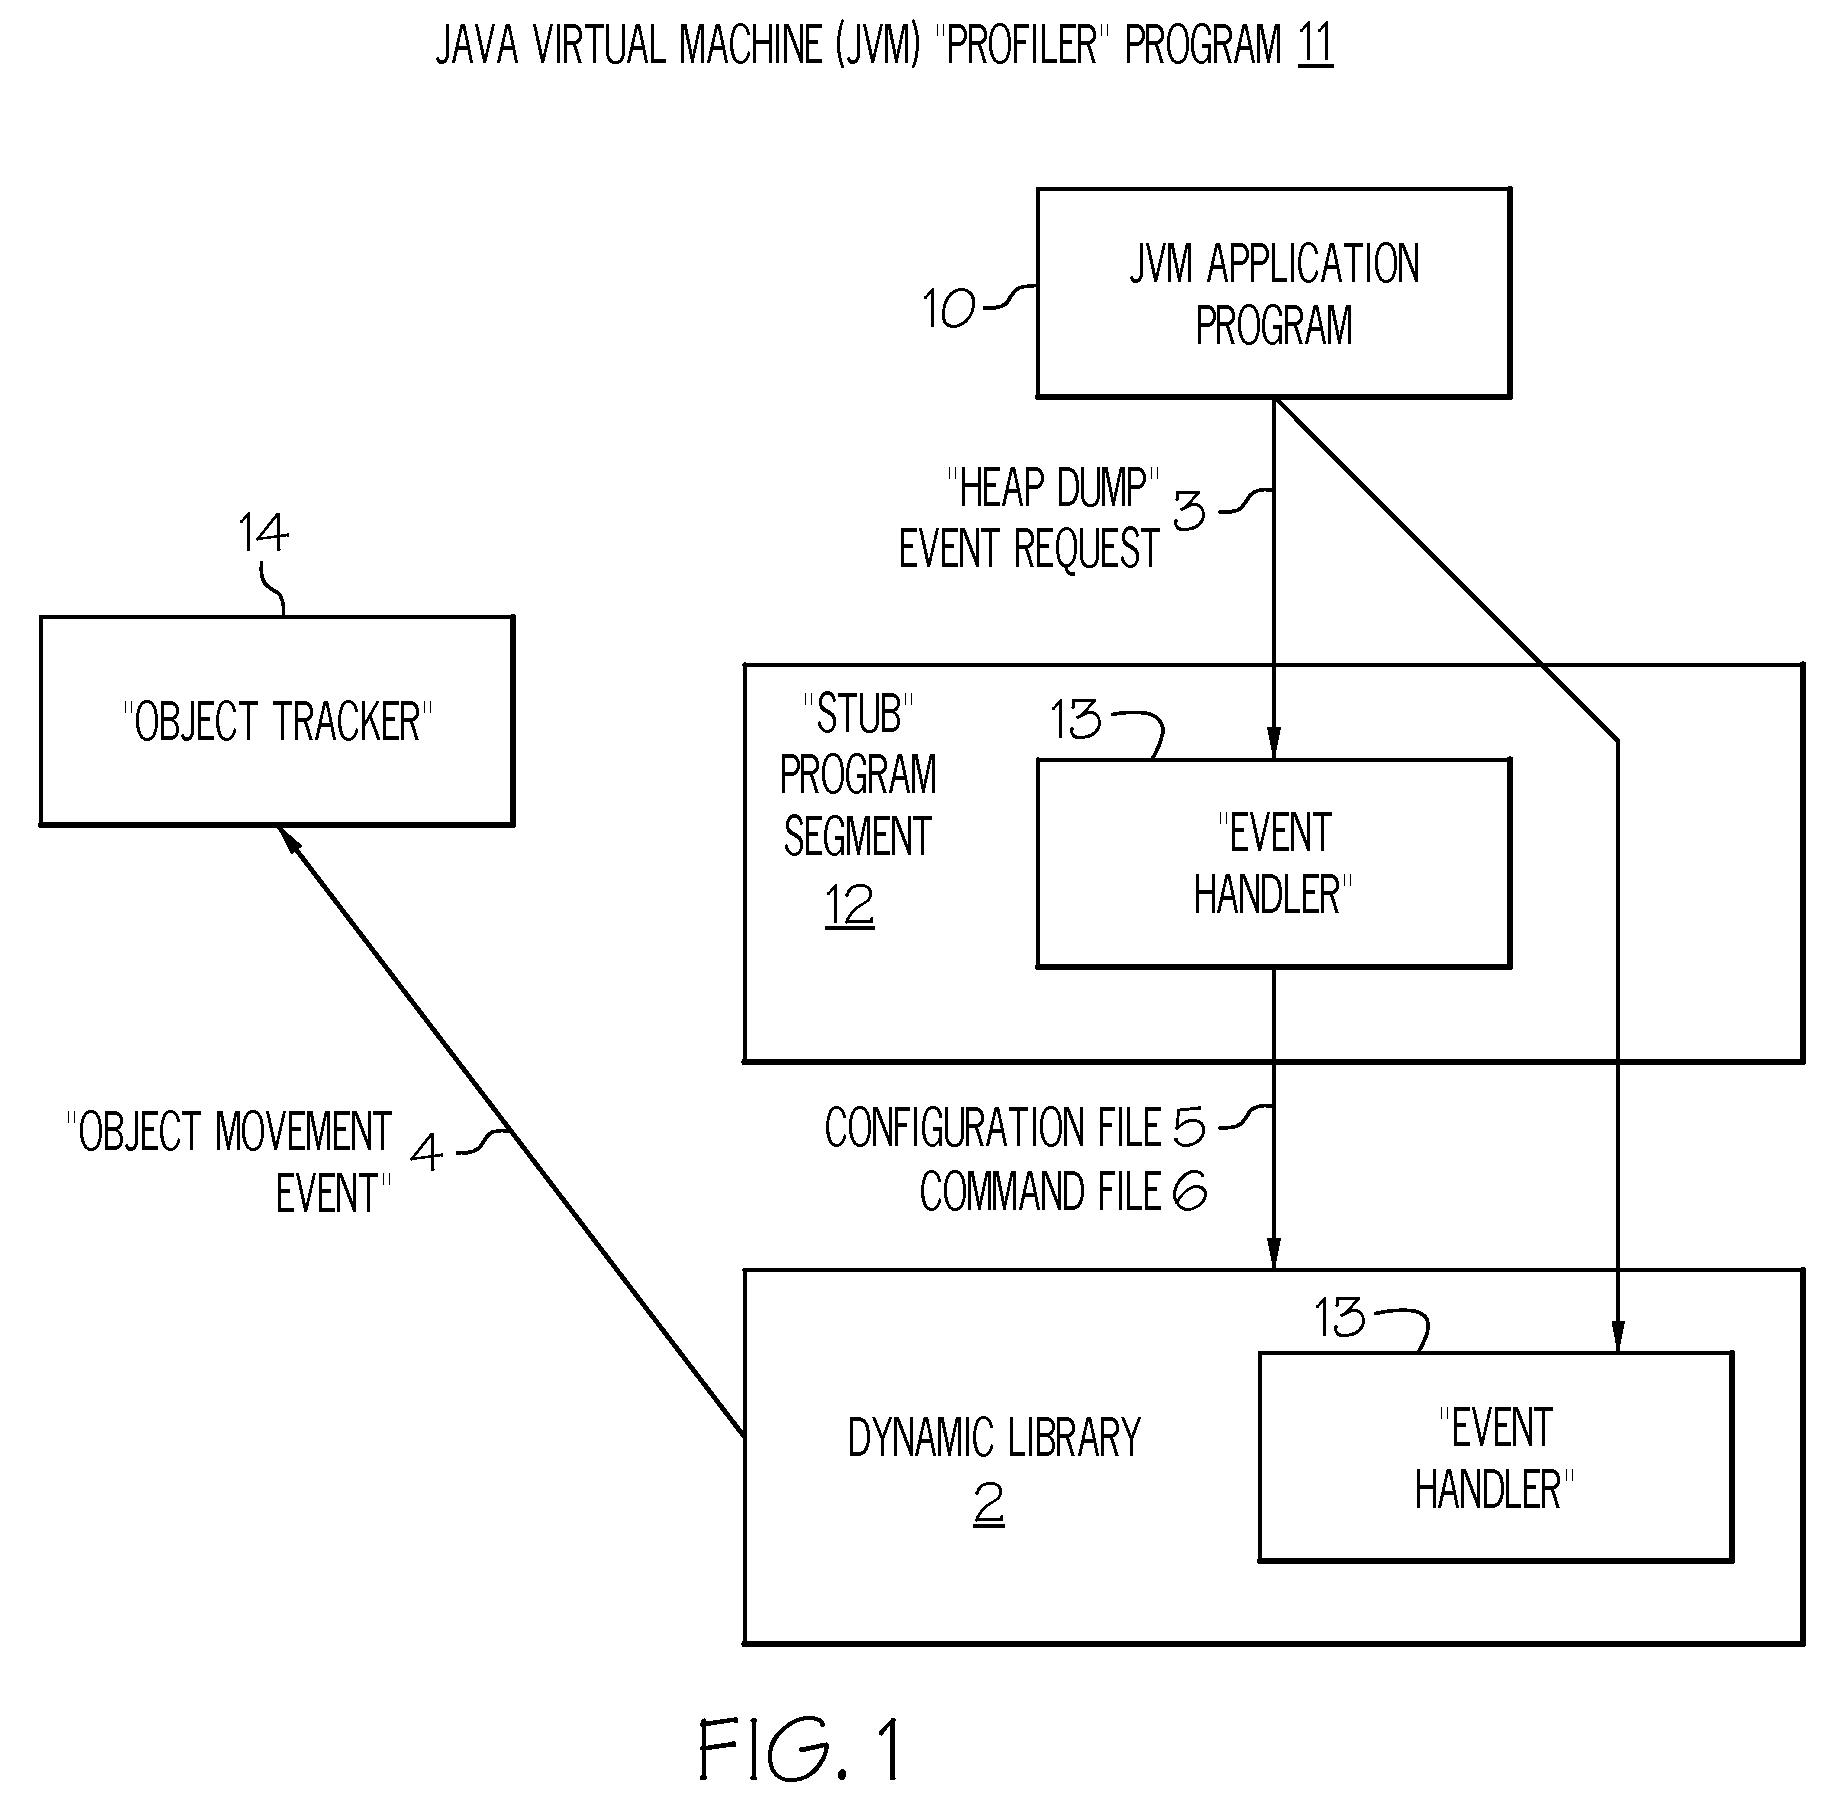
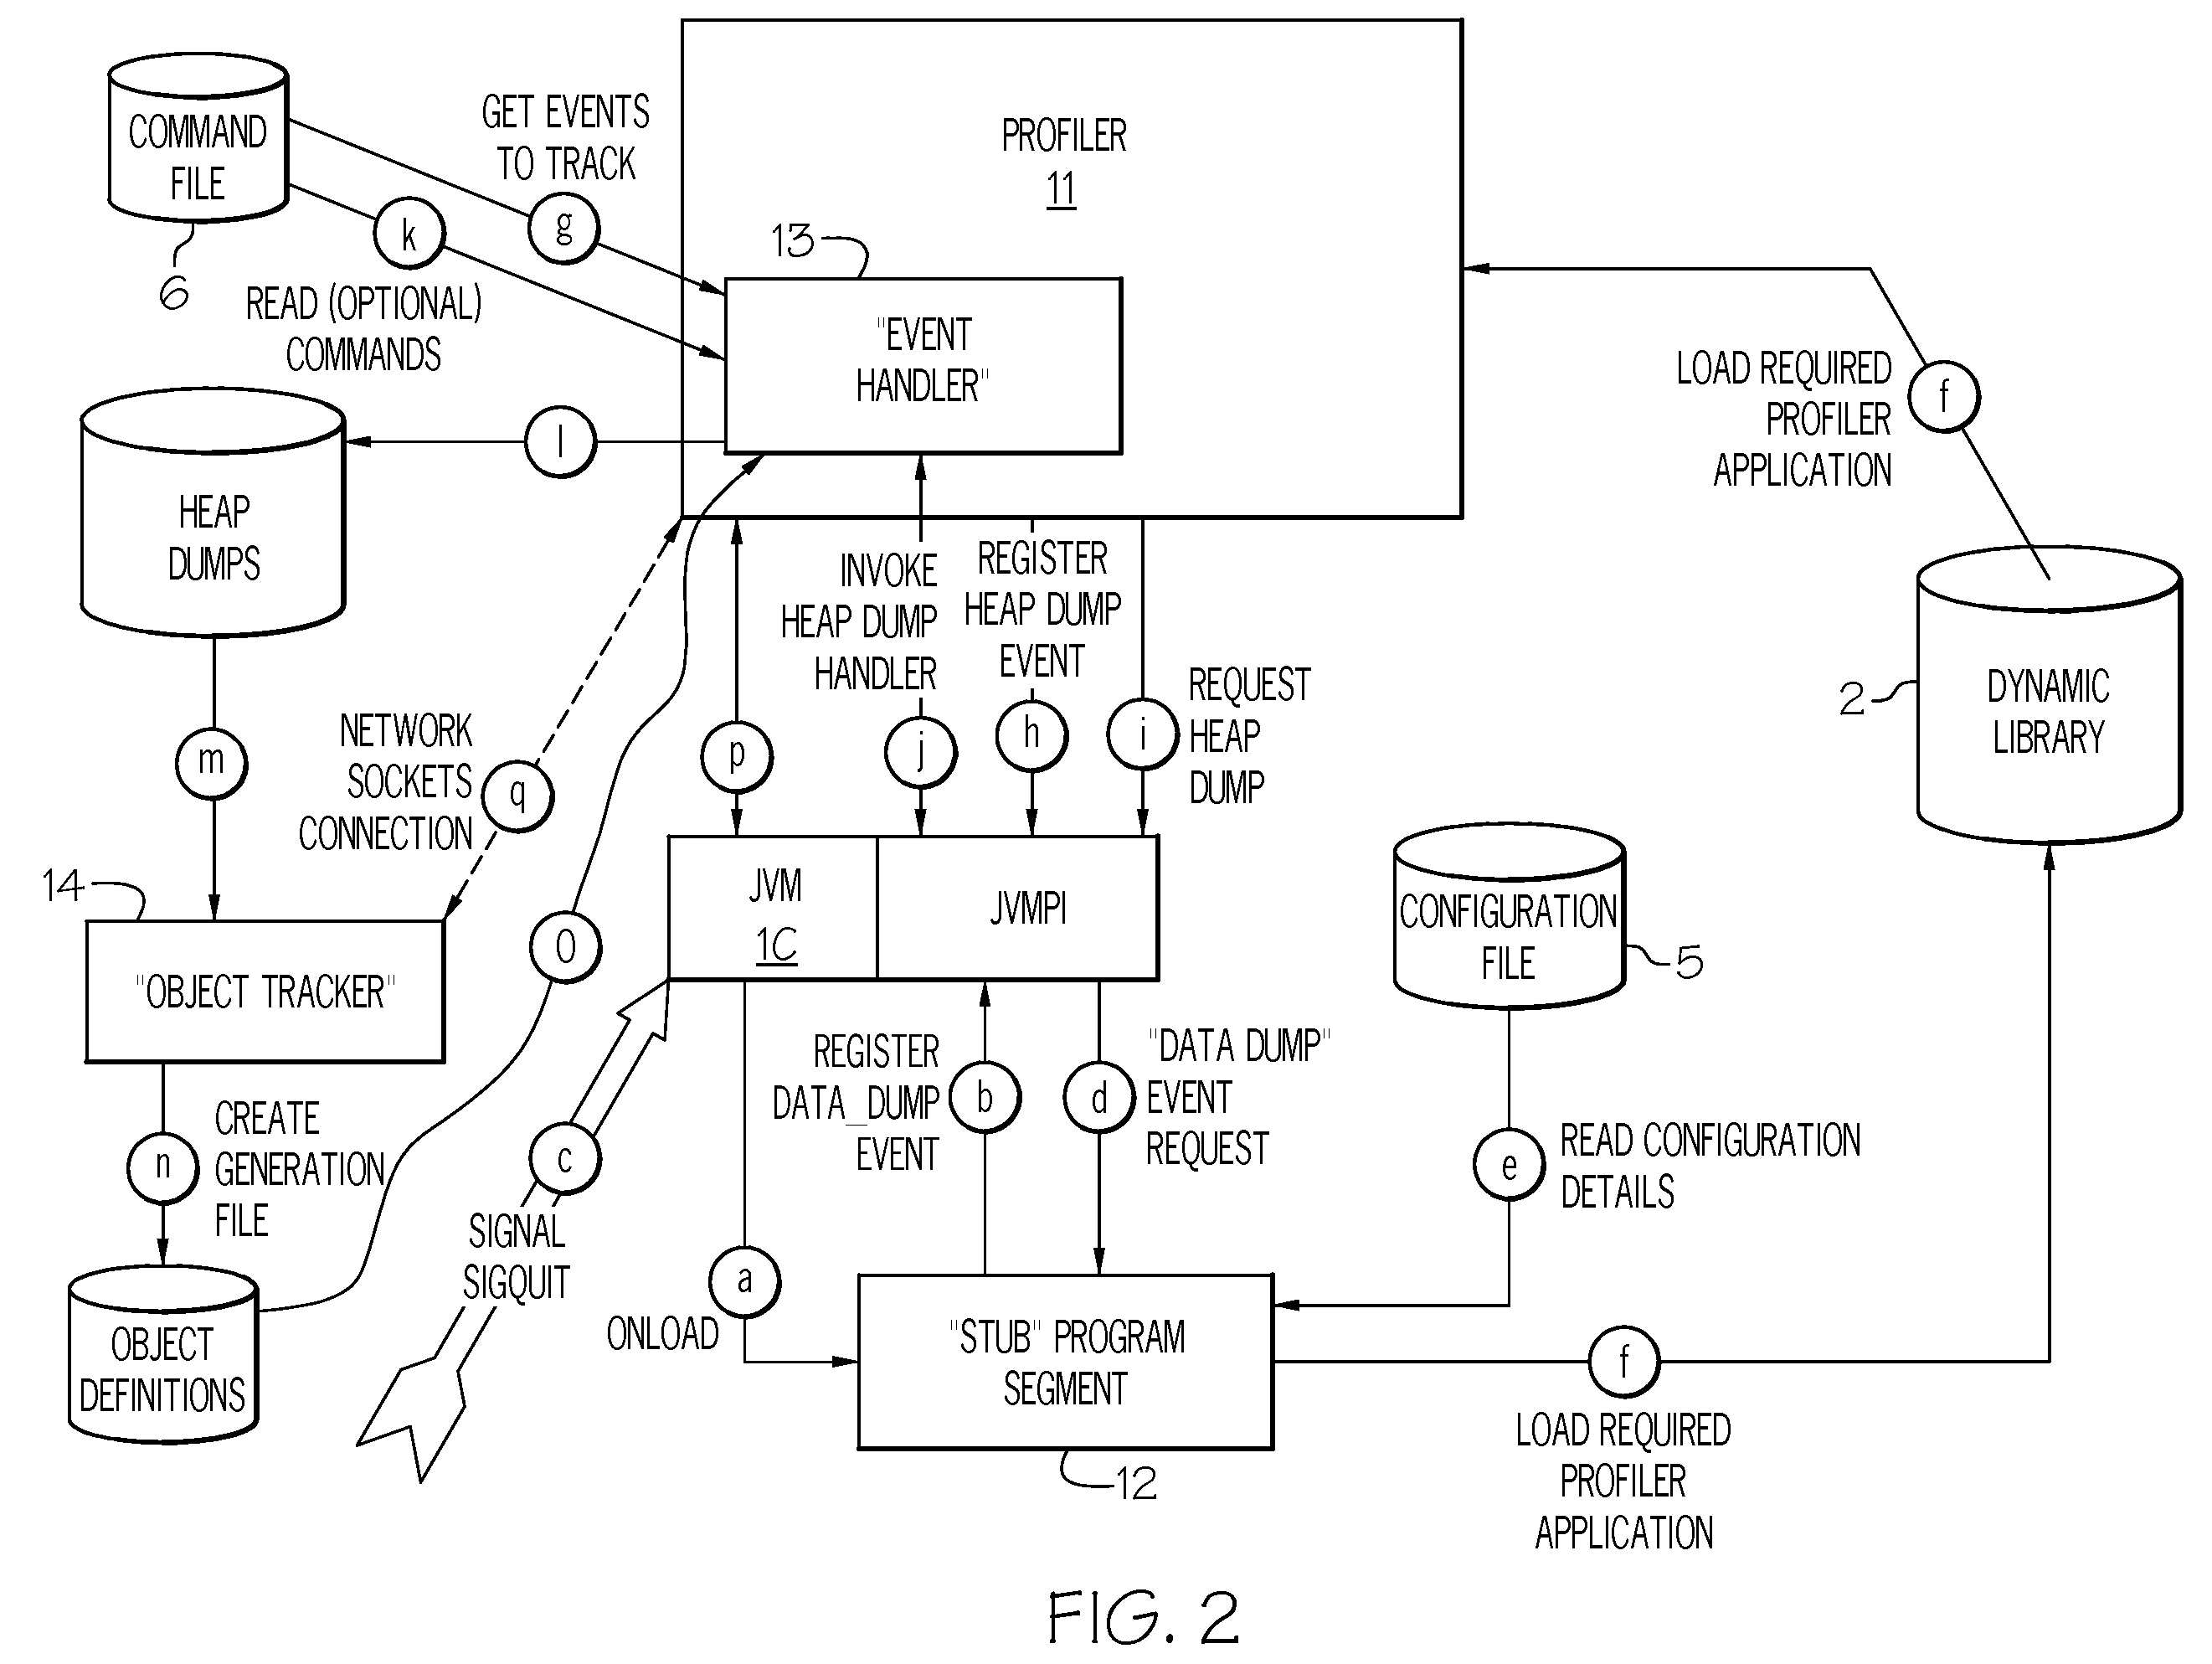
[0012]Memory leak analysis is achieved through use of a combination of functions contained in a Java Virtual Machine (JVM) instruction compiler library acting in cooperation with functions packaged in the dynamically modifiable “profiler” program tool. As illustrated in FIG. 1 and in program processing steps “a” through “q” in FIG. 2, a preferred embodiment of the profiler 111 consists of a “stub” program segment 12 loaded by the JVM interface program 10 during initialization (to invoke its “JVM_OnLoad” function) which enables execution of the JVMPI_EVENT_DATA_DUMP_REQUEST (i.e., “heap dump event request”) 3 by associating it with an “event handler”13 that processes the registered event(s) when a SIGQUIT instruction is sent to the JVM program interface 10 to cause passing of the event request to the stub. The event handler 13 of the stub 12 reads the configuration file 5 of the heap dump event request 3 to determine the parameters (including the name and location of the dynamic libr...


PUM


Abstract

An invention is disclosed for analyzing memory leaks occurring in Java Virtual Machine (JVM) data storage, consisting of a dynamically modifiable JVM “profiler” and an “object tracker” tool for analyzing the output from the profiler. Specifically, a method and system is disclosed for programming a JVM profiler used to analyze and correct memory leaks in stored data heaps, consisting of a program segment (or “stub”) initialized by the JVM application program interface to determine the parameters to be passed to the main profiler memory leak analysis program logic, which is then initialized by the stub to examine a minimal number of “heap dumps” in order to identify data elements or objects for the existence and/or correction of memory leaks. Updated information on data elements or objects can be requested from the profiler as needed by use of the object movement tracking option to record the details of subsequent changes in data memory storage status once a heap dump has been obtained.

Description

TECHNICAL FIELD[0001]This invention relates to analyzing memory leaks occurring in Java Virtual Machine (JVM) data storage.BACKGROUND[0002]This invention discloses a programming method and system that solves the problems existing in prior art techniques for analyzing and correcting memory leaks in large Java Virtual Machine (JVM) “heaps” in which data elements or objects are stored in a managed heap. The introduction of Java Virtual Machines (JVMs) incorporating memory space for storing computer program instructions and data to be processed by 64-bit central processing units (CPUs) makes it possible to significantly increase the number of addressable memory locations (or “memory space”) and to increase the amount of data (or “heap size”) capable of being processed using the JVM. For example, with a 64-bit CPU, it is possible to specify JVM heap sizes of over 4 Gigabytes (GB). Diagnosing an unanticipated accumulation of data objects in memory (or “memory leak”) occurring as a result ...

Claims


Application Information

Patent Timeline
Patent Type & Authority Applications(United States)
IPC IPC(8): G06F9/44
CPCG06F11/366
Inventor BRADY, MICHAEL JOHN
Owner IBM CORP
Why Eureka
Try Eureka