Multivariate multiple matrix analysis of analytical and sensory data

a multi-variate, sensory data technology, applied in the field of multi-variate multiple matrix analysis of analytical and sensory data, can solve problems such as embarrassing situations, skewed results compared with actual sales, and test panelists sometimes don't understand, so as to improve consumer liking

Inactive Publication Date: 2009-02-26
MKS INSTR INC
View PDF18 Cites 12 Cited by
  • Summary
  • Abstract
  • Description
  • Claims
  • Application Information

AI Technical Summary

Benefits of technology

[0019]The method and system provide the advantages of predicting consumer responses without the need for additional consumer input.
[0020]The basic objectives are (a) to understand the consumer responses and liking of the products as well as a comparison between the products with respect to the consumer data, and (b) to find the relationships between on the one hand the data matrices A and P, and on the other hand C (FIG. 3). Finding such relationships will allow the prediction of consumer behavior from either analytical or expert panel data or both. This, in turn, will provide an understanding of the nature of consumer behavior in terms of physical, chemical, and other factors, and thus allow the modification of the product candidates to improve consumer liking.

Problems solved by technology

While consumer data can be very useful, the data can often give inaccurate expectations and predictions about the probably success of the product or service, thereby creating potentially skewed results compared with actual sales.
Such a situation can be embarrassing for a manufacturer and agency that conducted the surveys if expected / predicted purchasing levels as suggested by the manufacturer and agency are not attained.
This inaccuracy may be due to test panel participants or subjects providing feedback that does not match their actual liking or purchasing habits.
While a few consumers in a survey may intentionally supply incorrect answers because they want to be invited back for other surveys or test product sampling, most participants generally try to be as accurate as possible, but their answers may not exactly correspond to their actual behavior.
One such reason is that test panelists sometimes don't understand the survey questions or may find the questions to be confusing or misleading.
Another reason for inaccuracy may be that the panelist is flattered that someone is asking for their opinion, and consequently is overly polite to the interviewer and indicates interest in the product even though the consumer wouldn't have enough interest in the actual product to seek it out and pay hard-earned money to buy it.
Still other reasons may include errors in inputting or compiling survey responses and other factors.
All of the foregoing can lead to inaccurate or skewed data when trying to interpret whether to continue supporting a product or service offering.

Method used


Image

  • Multivariate multiple matrix analysis of analytical and sensory data
  • Multivariate multiple matrix analysis of analytical and sensory data
  • Multivariate multiple matrix analysis of analytical and sensory data

Examples


Embodiment Construction

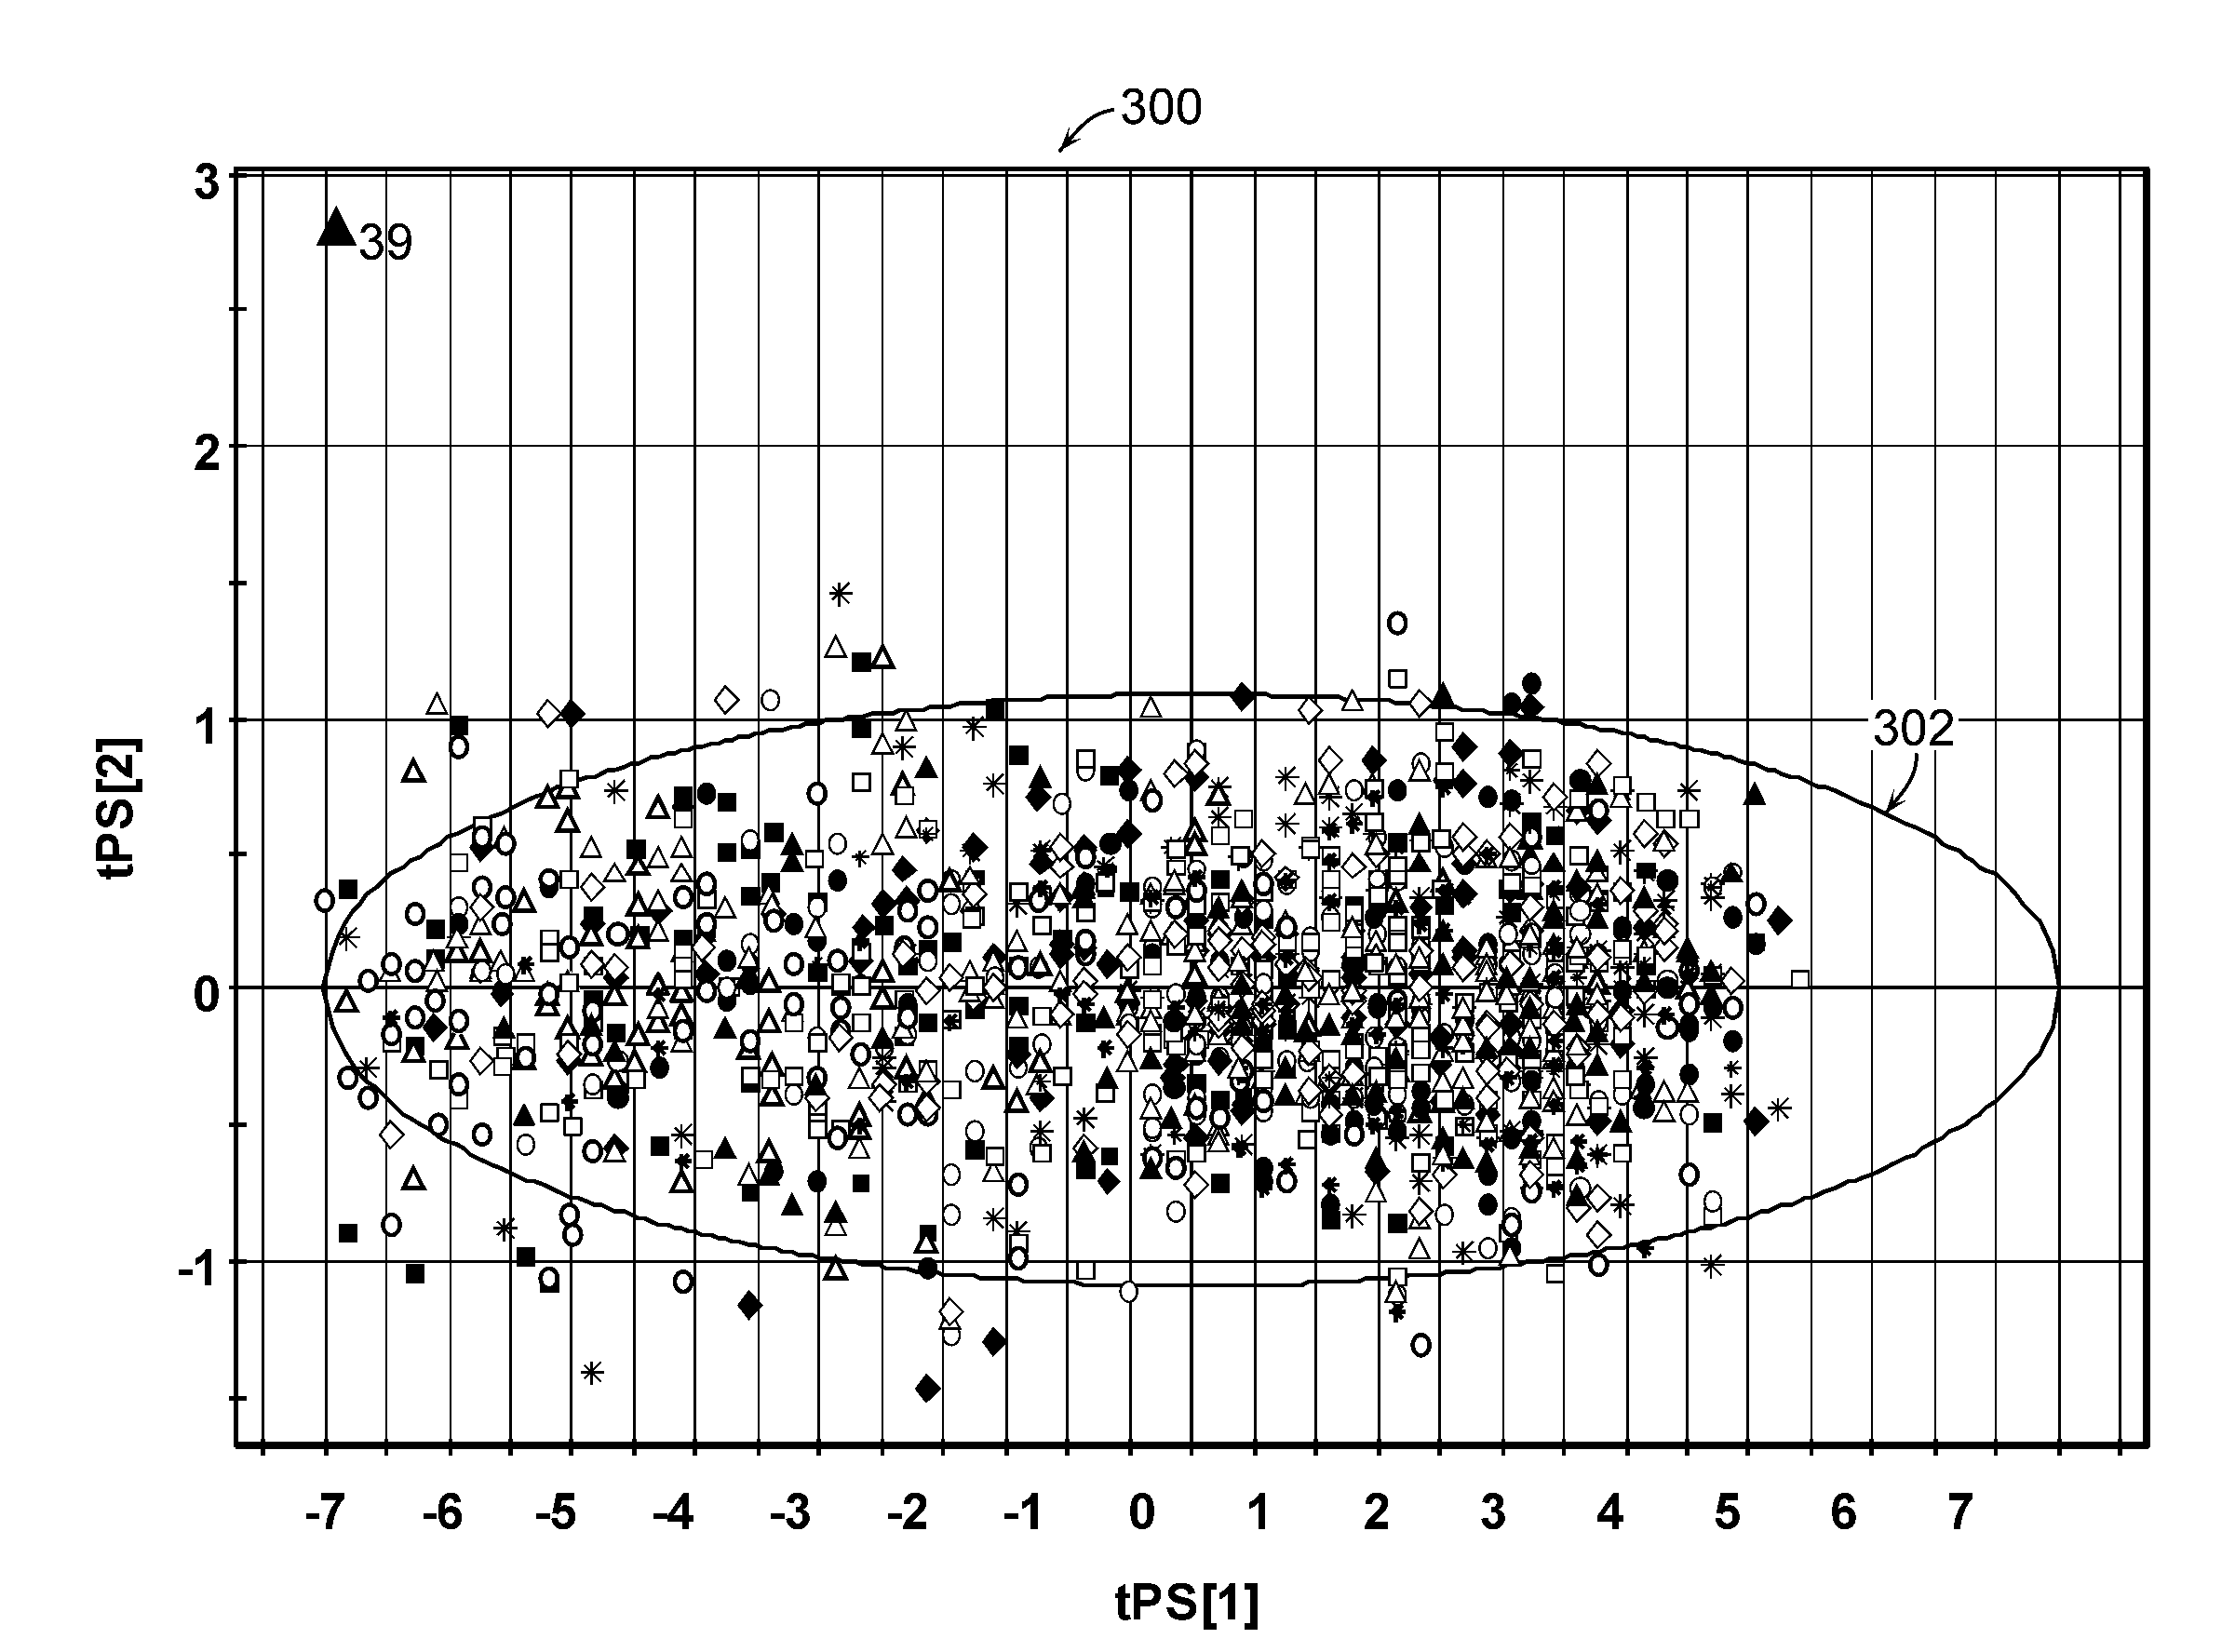
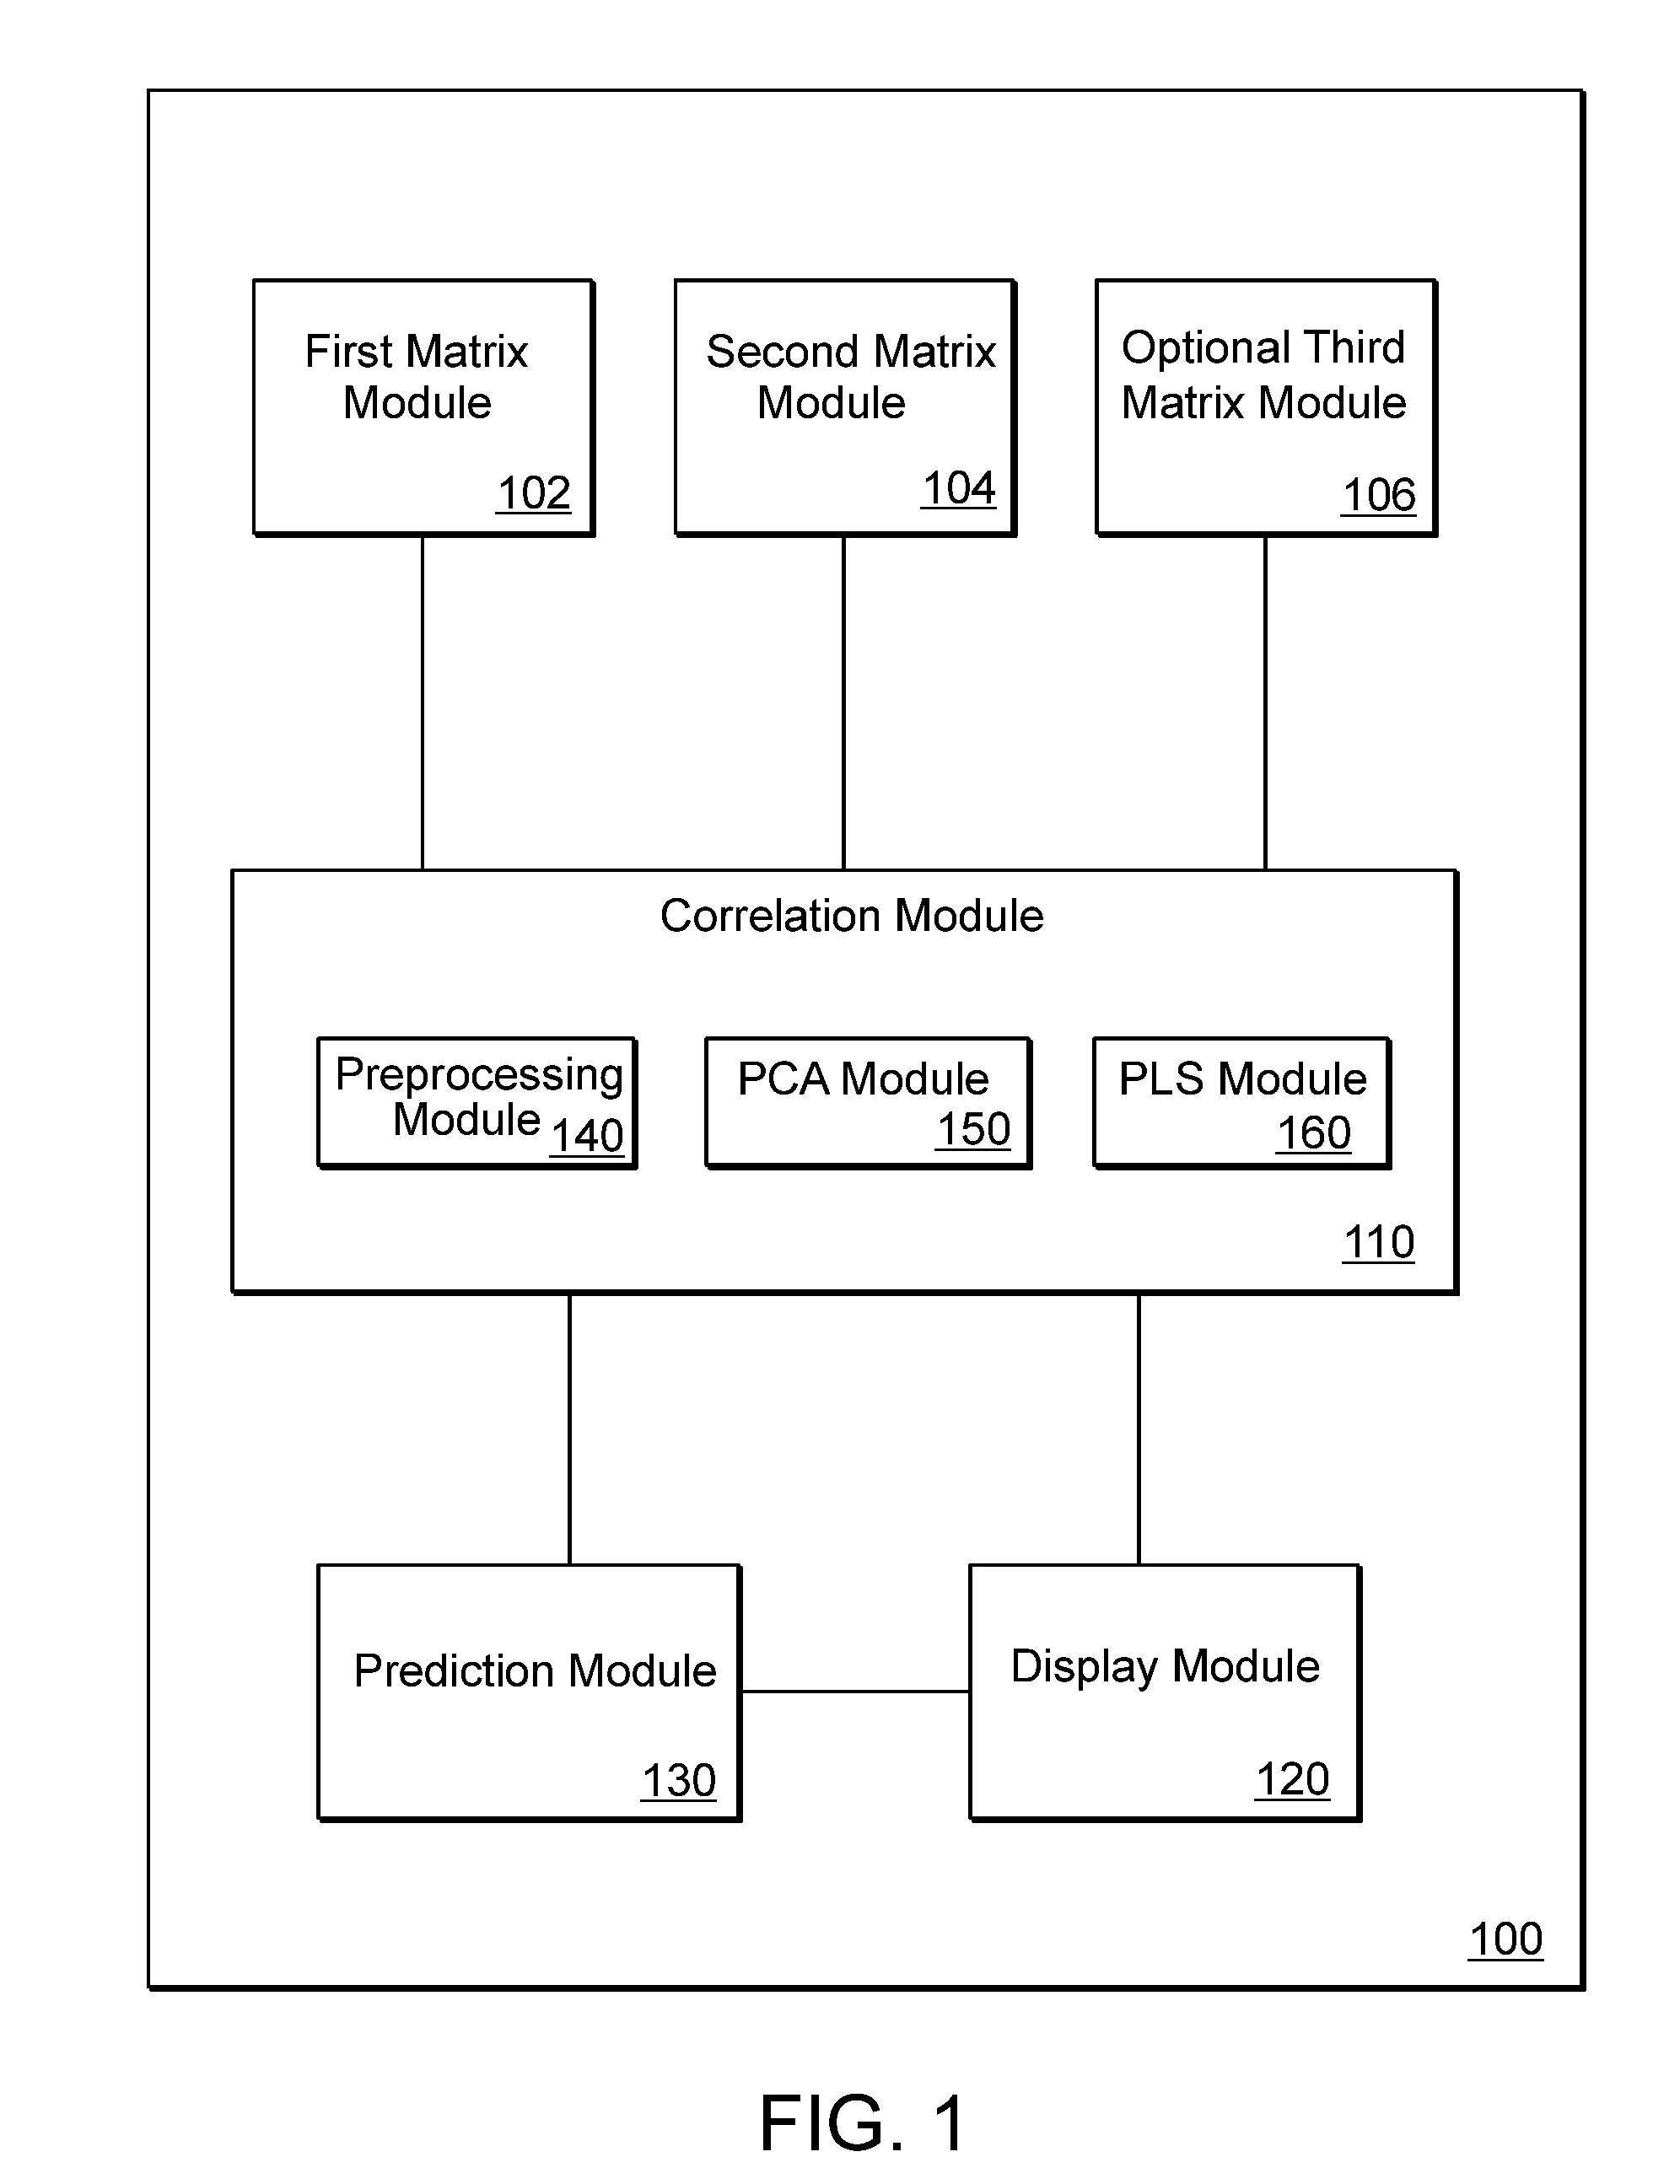
[0035]Generally, a system predicts consumer responses for N products and candidates as follows. At least two matrices are produced for the N products or candidates, one matrix based on consumer evaluation and the other matrix based on analytical profile characterization or expert panel evaluation. A third matrix can be produced based on analytical profile characterization or expert panel evaluation not used for building the other matrix. A relationship model is built by correlating the product candidate data evaluated by consumers with the same product candidate data evaluated or analyzed by an expert panel and / or an analytical profile. The relationship model is used to build a prediction model of consumer behavior from either analytical or expert panel data or both. The prediction model provides an understanding of the nature of consumer behavior in terms of physical, chemical, and other factors, and thus allows the modification of the product candidates to improve consumer liking....


PUM


Abstract

A system and method is provided for predicting consumer behavior for selected products. The method includes providing a first matrix associated with N products evaluated by a plurality of consumers, providing a second matrix associated with the N products characterized by at least one of an analytical profile or an evaluation by a plurality of experts and correlating the first matrix to the second or / and the third matrix to produce a relationship model.

Description

BACKGROUND[0001]Consumer decision-making has been a focus for many years. Companies that are attempting to meet a particular need in the marketplace, or that are attempting to find out how products or services are being received by the consumer, will often conduct market research to attempt to quantify attributes or characteristics of a particular consumer segment. If performed well, the consumer data extracted from this research can inform companies about how their and others' products or services are perceived and bought by purchasers or potential purchasers in the marketplace, and how the companies' products or services can be changed to achieve the companies' business goals.[0002]Traditionally, this information is collected by introducing products and / or services to a test panel, focus group or another set of actual consumers and query whether they like the product and would be interested in purchasing or using the product or service. Such consumer interest / liking surveys are in...

Claims


Application Information

Patent Timeline
Patent Type & Authority Applications(United States)
IPC IPC(8): G06F17/10
CPCG06Q30/02
Inventor KETTANEH, NOUNAWOLD, SVANTE BJARNE
Owner MKS INSTR INC
Why Eureka
Try Eureka