Managing non-destructive evaluation data

Active Publication Date: 2010-09-16
ETEGENT TECH
View PDF58 Cites 20 Cited by
  • Summary
  • Abstract
  • Description
  • Claims
  • Application Information

AI Technical Summary

Problems solved by technology

However, this NDE data is typically difficult to manage and handle.
As each dataset of NDE data is often inspected, this results in large amounts of data that are difficult to categorize and otherwise analyze in whole.
Moreover, the NDE data may be discarded after it has been analyzed, and thus there is often little NDE data for an asset over time.
Thus, when a potential problem is indicated, it is often difficult to track that indication on an asset through time, analyze that indication in relation to other indications of the asset, and analyze that indication in relation to indications of a plurality of similar assets.
As the amount of NDE data increases, so do associated costs and needs for users trained to perform inspections.
Although NDE data collection devices may produce digital data, the digital data is being generated without systems in place to manage and archive the collected information.
Moreover, the analysis of NDE data is often laborious and crude.
However, these manual tools require human interaction and generally require a user experienced with that NDE data and / or asset to align and analyze that NDE data.
Although some conventional systems have used automatic alignment of the NDE data, these methods often fail as a method of alignment for one dataset of NDE data is typically not useful for another dataset of NDE data.
Thus, conventional systems are typically unable to align datasets of NDE data that are in turn associated multiple modalities (e.g., datasets of NDE data captured with various NDE data collection devices).
This often has the effect of tying particular method of alignments to particular NDE data collection devices, and thus increases the cost of NDE data capture and analysis.

Method used


Image

  • Managing non-destructive evaluation data
  • Managing non-destructive evaluation data
  • Managing non-destructive evaluation data

Examples


example 1

[0127]By way of example, FIG. 26 illustrates a display representation of at least a portion of a dataset of NDE data 600 that may be captured consistent with embodiments of the invention. In particular, the NDE data 600 of FIG. 26 may be captured from at least a portion of an asset, and for this example may be captured from at least a portion of a right wing of an aircraft. FIG. 27 illustrates a display representation of a simulated model 610 of that right wing of the aircraft. Consistent with embodiments of the invention, it may be advantageous to align the NDE data 600 on the simulated model 610. As such, an alignment algorithm to align the NDE data 600 to the simulated model 610 may be determined from the NDE data 600 and / or inspection information associated therewith. The NDE data 600 may then be automatically aligned to the simulated model 610 with that alignment algorithm. FIG. 28 illustrates a display representation of aligned NDE data 620, and in particular illustrates the N...

example 2

[0129]Due to the capture and transformation of NDE data, the exact location of an indication may be unknown, and the approximate location of an indication may be represented. By way of example, FIG. 30 illustrates a display representation 640 that illustrates uncertainty of a determined location for an indication on a simulated model 610. The display representation 640 visually represents two indications as at 642 and 644, and more specifically illustrates a probability density as at 642 and 644 of a distance from the determined location for the indication. Simply put, the closer to the center of the probability density 642 and / or 644 (e.g., which may be a Gaussian distribution density), the more likely that is the actual location of the indication. For example, NDE data and / or inspection information may indicate the location of an indication. The location of the indication may thus be indicated as a point on the simulated model 610 and / or a probability density 642, 644 at the point...

example 3

[0131]During inspection of an asset, at least a portion of NDE data for the asset may not be captured, leading to lapses in coverage. For example, an inspection may involve capturing a plurality of datasets of NDE data from a plurality of portions of an asset. In some embodiments, the inspection involves capturing NDE data from overlapping portions of an asset. However, when a portion of the asset is not captured, there is a lapse of coverage of the asset. As such, embodiments of the invention are configured to indicate that at least a portion of the simulated model is not aligned with NDE data. By way of example, FIG. 32 illustrates a display representation 660 of the simulated model 610 in which at least a portion of the display representation 662, and specifically at least a portion of the background thereof, has been highlighted to indicate a lapse in coverage of aligned NDE data with the simulated model 610. In specific embodiments, the color component of the portion of the dis...


PUM


Abstract

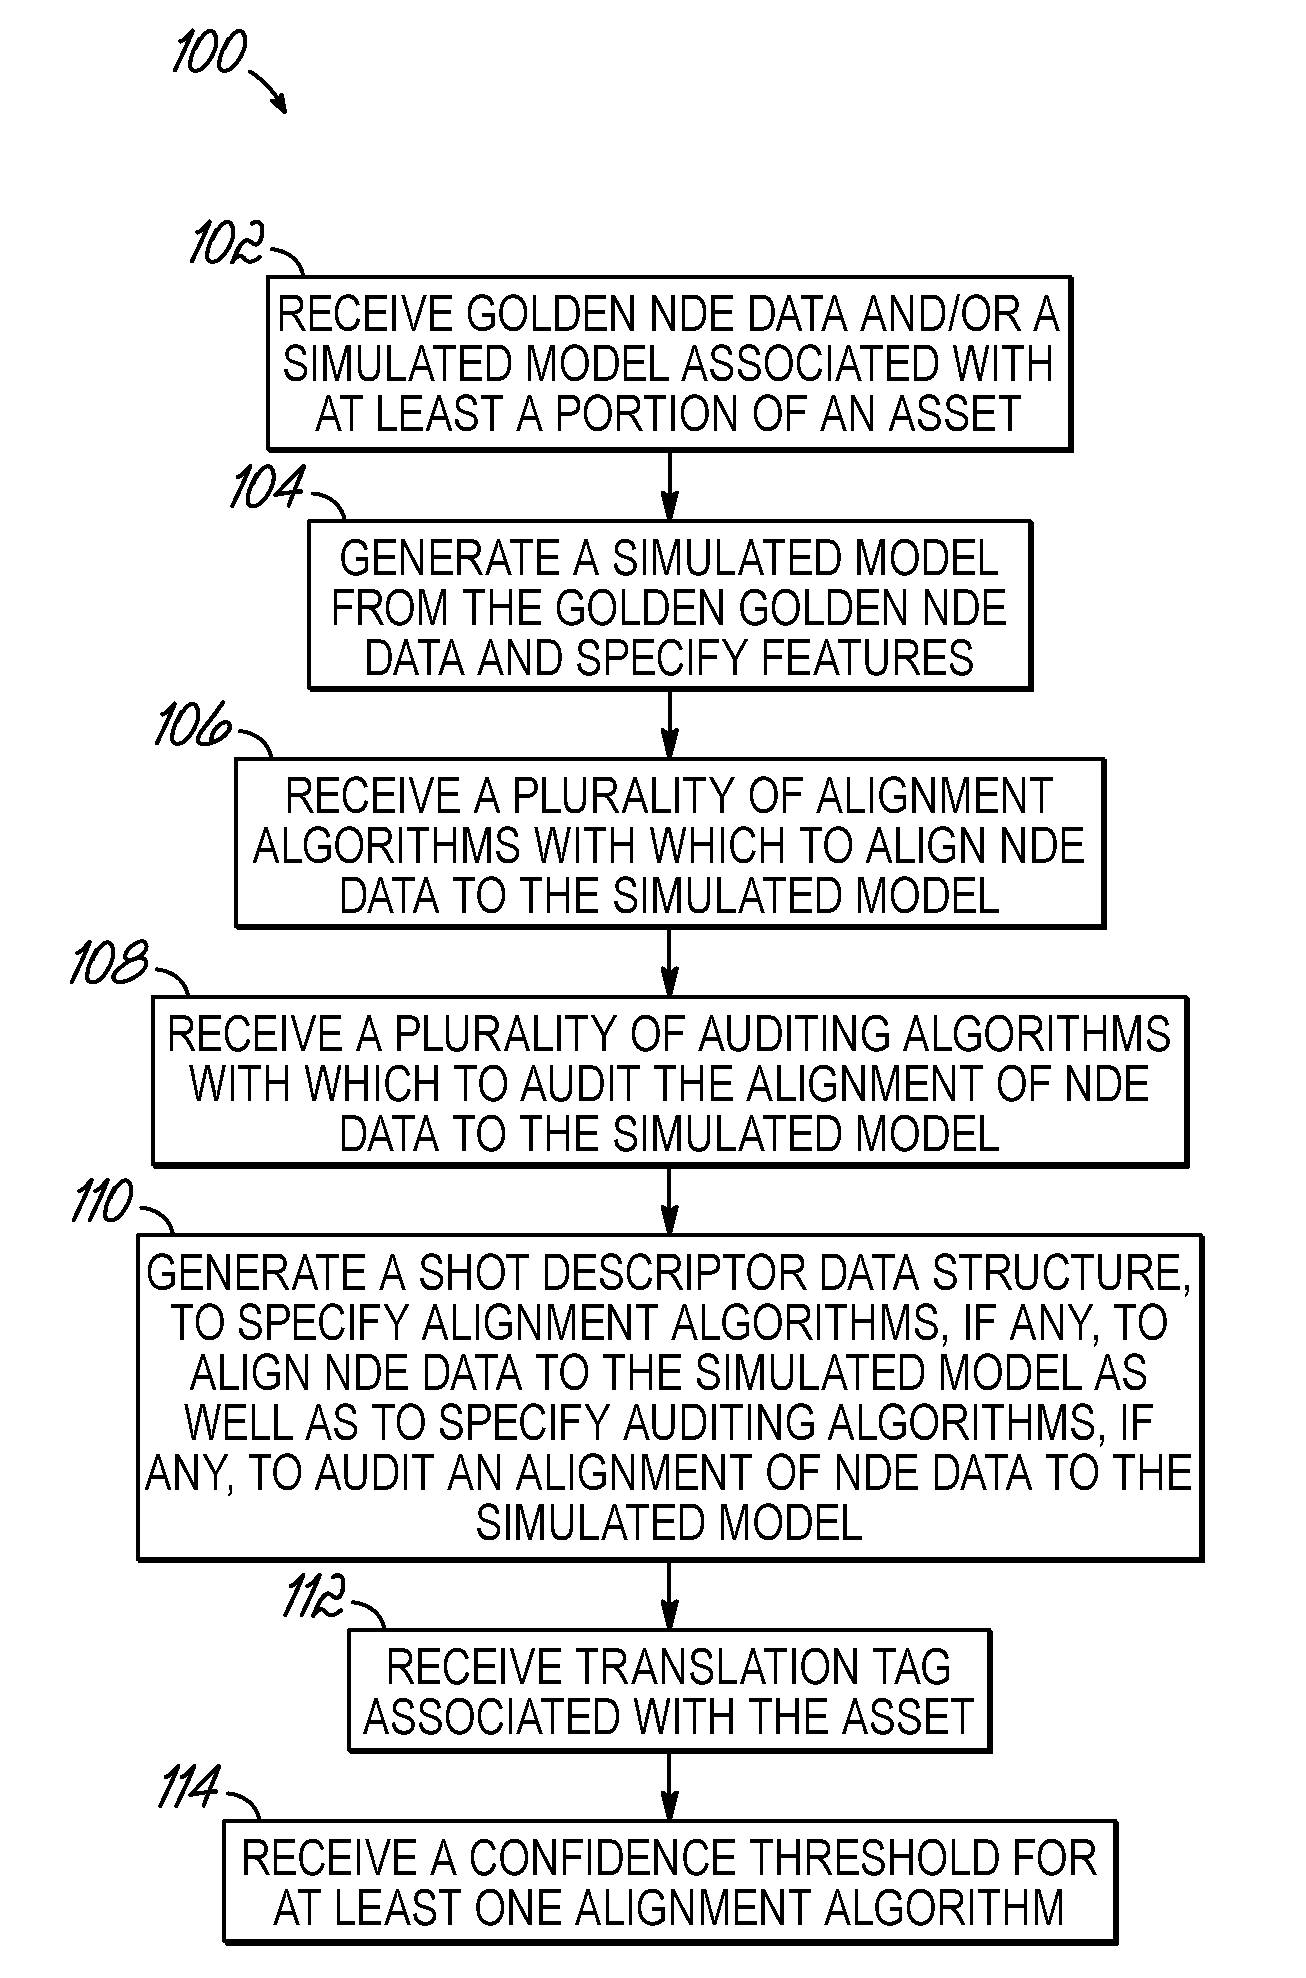
Methods manage non-destructive evaluation (“NDE”) data. NDE data for an asset is received and at least one alignment algorithm to align the NDE data to a simulated model associated therewith is determined. The NDE data is automatically aligned to the simulated model, a display representation that visually represents the aligned NDE data on the simulated model is generated, and information about the aligned NDE data is exported. Additionally, second NDE data associated with the at least a portion of the asset may also be received, at least one alignment algorithm to align the data determined, and the second NDE data aligned. Respective indications associated with the first and second NDE data may be determined and visually represented on the simulated model. Moreover, a shot descriptor file may be analyzed to determine whether additional NDE data is required to complete an alignment of NDE data.

Description

CROSS-REFERENCE TO RELATED APPLICATION [0001]This application is a continuation of U.S. application Ser. No. 12 / 403,274 to Joseph M. Kesler et al., entitled “MANAGING NON-DESTRUCTIVE EVALUATION DATA,” filed Mar. 12, 2009 (SDL / 08), which application is incorporated by reference herein.FIELD OF THE INVENTION [0002]The present invention relates to computing systems, and more particularly to the management and automatic alignment of non-destructive evaluation (“NDE”) data.BACKGROUND OF THE INVENTION [0003]Non-destructive Evaluation and Inspection (“NDE / I”) technologies generally provide ways to nondestructively scan, image, sense or otherwise evaluate characteristics of materials and / or components. In particular, NDE / I technologies may be used to detect minute flaws and defects in those materials and / or component parts. As such, NDE / I technologies have become increasingly used to help assure structural and functional integrity, safety, and cost effective sustainment of various assets, d...

Claims


Application Information

Patent Timeline
IPC IPC(8): G06G7/48
CPCG06Q10/04G06F17/10G06Q10/06
Inventor SHARP, THOMAS D.ROTH, II, RICHARD A.LIGGETT, URIAH M.KESLER, JOSEPH M.
Owner ETEGENT TECH
Why Eureka
Try Eureka