Method for computing a color-coded analysis image

a color-coded analysis and image technology, applied in the field of color-coded analysis images, can solve the problem of no longer identifying areas, and achieve the effect of facilitating the identification of time-continuous information

Active Publication Date: 2010-12-30
SIEMENS HEALTHCARE GMBH
View PDF7 Cites 23 Cited by
  • Summary
  • Abstract
  • Description
  • Claims
  • Application Information

AI Technical Summary

Benefits of technology

[0012]The object of the present invention is to create possible means for making it easier to identify time-continuous information on the embolization in the blood vessels.

Problems solved by technology

Another consequence is that the pressure rises in the veins, which can cause them to enlarge and potentially result in hemorrhaging.
This can be a disadvantage, however, because after the mask is re-initialized, the doctor can no longer identify the areas that have already been embolized.

Method used


Image

  • Method for computing a color-coded analysis image
  • Method for computing a color-coded analysis image
  • Method for computing a color-coded analysis image

Examples


Embodiment Construction

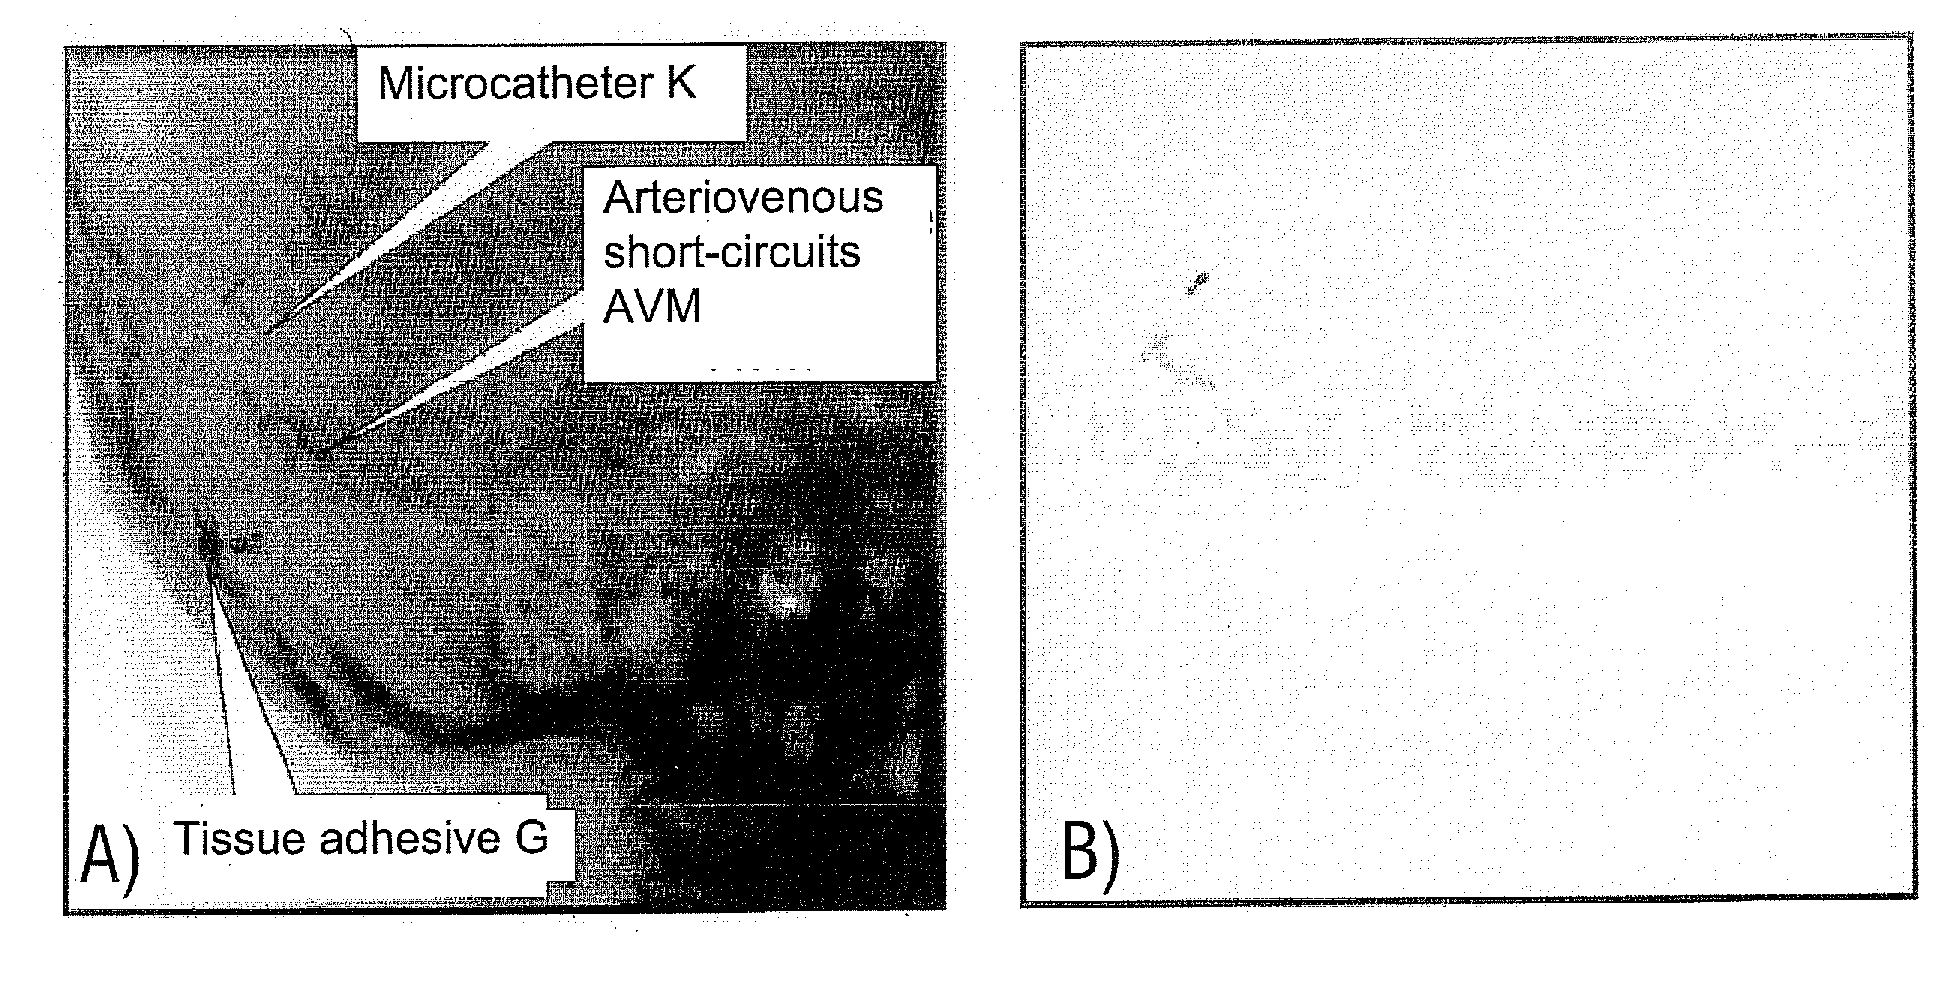
[0030]Arteriovenous malformations AVM are identified in FIG. 1A). A microcatheter K inserted selectively into the supplying artery introduces tissue adhesive G (e.g. onyx) in order to close the arteriovenous short-circuits or malformations. A) shows the native fluoroscopic image, FIG. 1B) shows the correspondingly subtracted frame (roadmap), on which are visible only the differences from a specific mask image. Roadmap images are mainly composed of “neutral” background (namely the parts in which the live image (image frame during the intervention) is identical to the mask and which hence “cancel themselves out”), and the changes in the live image compared with the mask, which stand out as dark areas (see illustration B). Artifacts may also show up as white points.

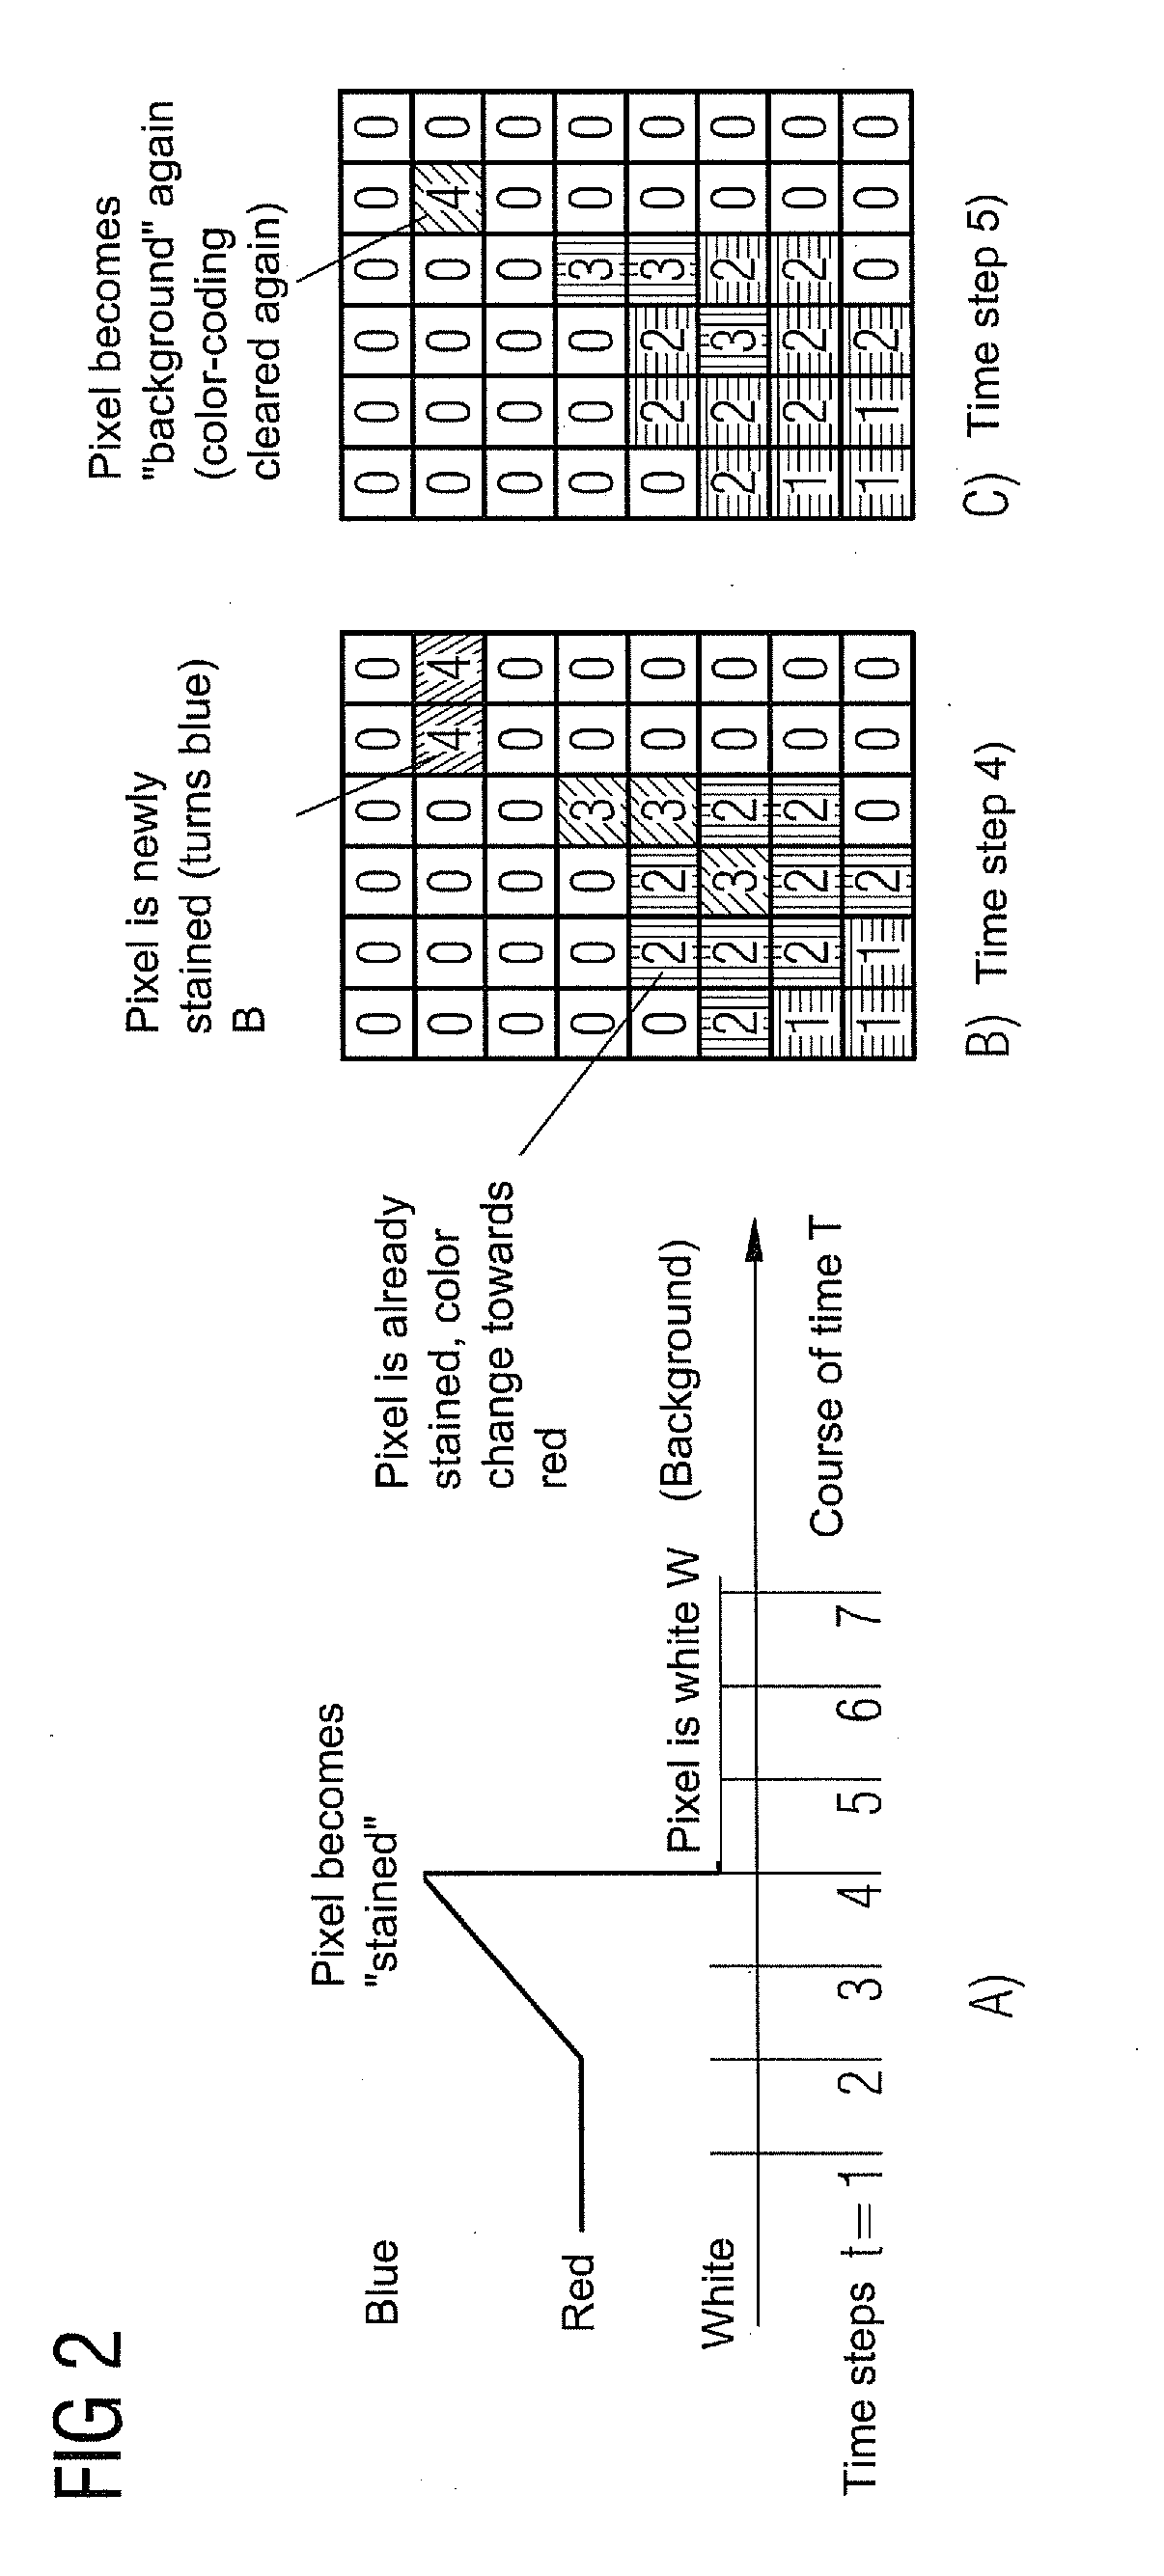
[0031]According to the invention, it is noted for each image pixel the time instant at which the image pixel becomes “dark” for the first time, which in the intervention corresponds to an accumulation of embolizing material ...


PUM


Abstract

A method for computing a color-coded analysis image of an examination area of an examination object from a temporal sequence of fluoroscopic images of the examination area comprising a vascular system containing arteries and/or veins is provided. An acquisition time instant has been assigned to each of the fluoroscopic images representing a given distribution of a material embolizing some of the vascular system. The fluoroscopic image spatially corresponds to an analysis image pixel by pixel. A computer receives the fluoroscopic images with a color attribute assigned to each pixel of the analysis image at an image point and a time instant. If a pixel differs from a pixel at a preceding time instant, the color attribute assumes a color attribute of the time instant and the difference. If a pixel corresponds to a background color of the analysis image, the color attribute assumes a background color.

Description

CROSS REFERENCE TO RELATED APPLICATIONS[0001]This application claims priority of German application No. 10 2009 031 141.6 filed Jun. 30, 2009, which is incorporated by reference herein in its entirety.FIELD OF THE INVENTION[0002]The present invention relates to a method for computing a color-coded analysis image of an examination area of an examination object from a temporal sequence of x-ray images of the examination area. The examination area comprises a vascular system comprising arteries and / or veins as blood vessels. The x-ray images and the analysis image corresponding spatially with each other pixel by pixel. the invention also relates to corresponding device.BACKGROUND OF THE INVENTION[0003]During an intervention on an angiography system, for instance in order to navigate the instruments (e.g. in the head or heart), real-time images are obtained using fluoroscopy. An intervention that is frequently performed on such a system is the embolization of tumors or arteriovenous mal...

Claims


Application Information

Patent Timeline
Patent Type & Authority Applications(United States)
IPC IPC(8): G06K9/00
CPCA61B6/463A61B6/503G06T11/001A61B6/5235A61B6/504
Inventor OSTERMEIER, MARTINPFISTER, MARCUSREDEL, THOMAS
Owner SIEMENS HEALTHCARE GMBH
Why Eureka
Try Eureka