Apparatus, systems and methods for determining and displaying pre-event and post-event analyte concentration levels

a technology of analyte concentration and analyte concentration information, applied in the field of apparatus, systems and methods for calculating and displaying analyte concentration information, can solve problems such as difficulty in performing sophisticated assessments of data

Active Publication Date: 2011-06-23
ASCENSIA DIABETES CARE HLDG AG
View PDF14 Cites 320 Cited by
  • Summary
  • Abstract
  • Description
  • Claims
  • Application Information

AI Technical Summary

Problems solved by technology

However, current graphical display and processor capabilities make it difficult to perform sophisticated assessment

Method used


Image

  • Apparatus, systems and methods for determining and displaying pre-event and post-event analyte concentration levels
  • Apparatus, systems and methods for determining and displaying pre-event and post-event analyte concentration levels
  • Apparatus, systems and methods for determining and displaying pre-event and post-event analyte concentration levels

Examples


example 1

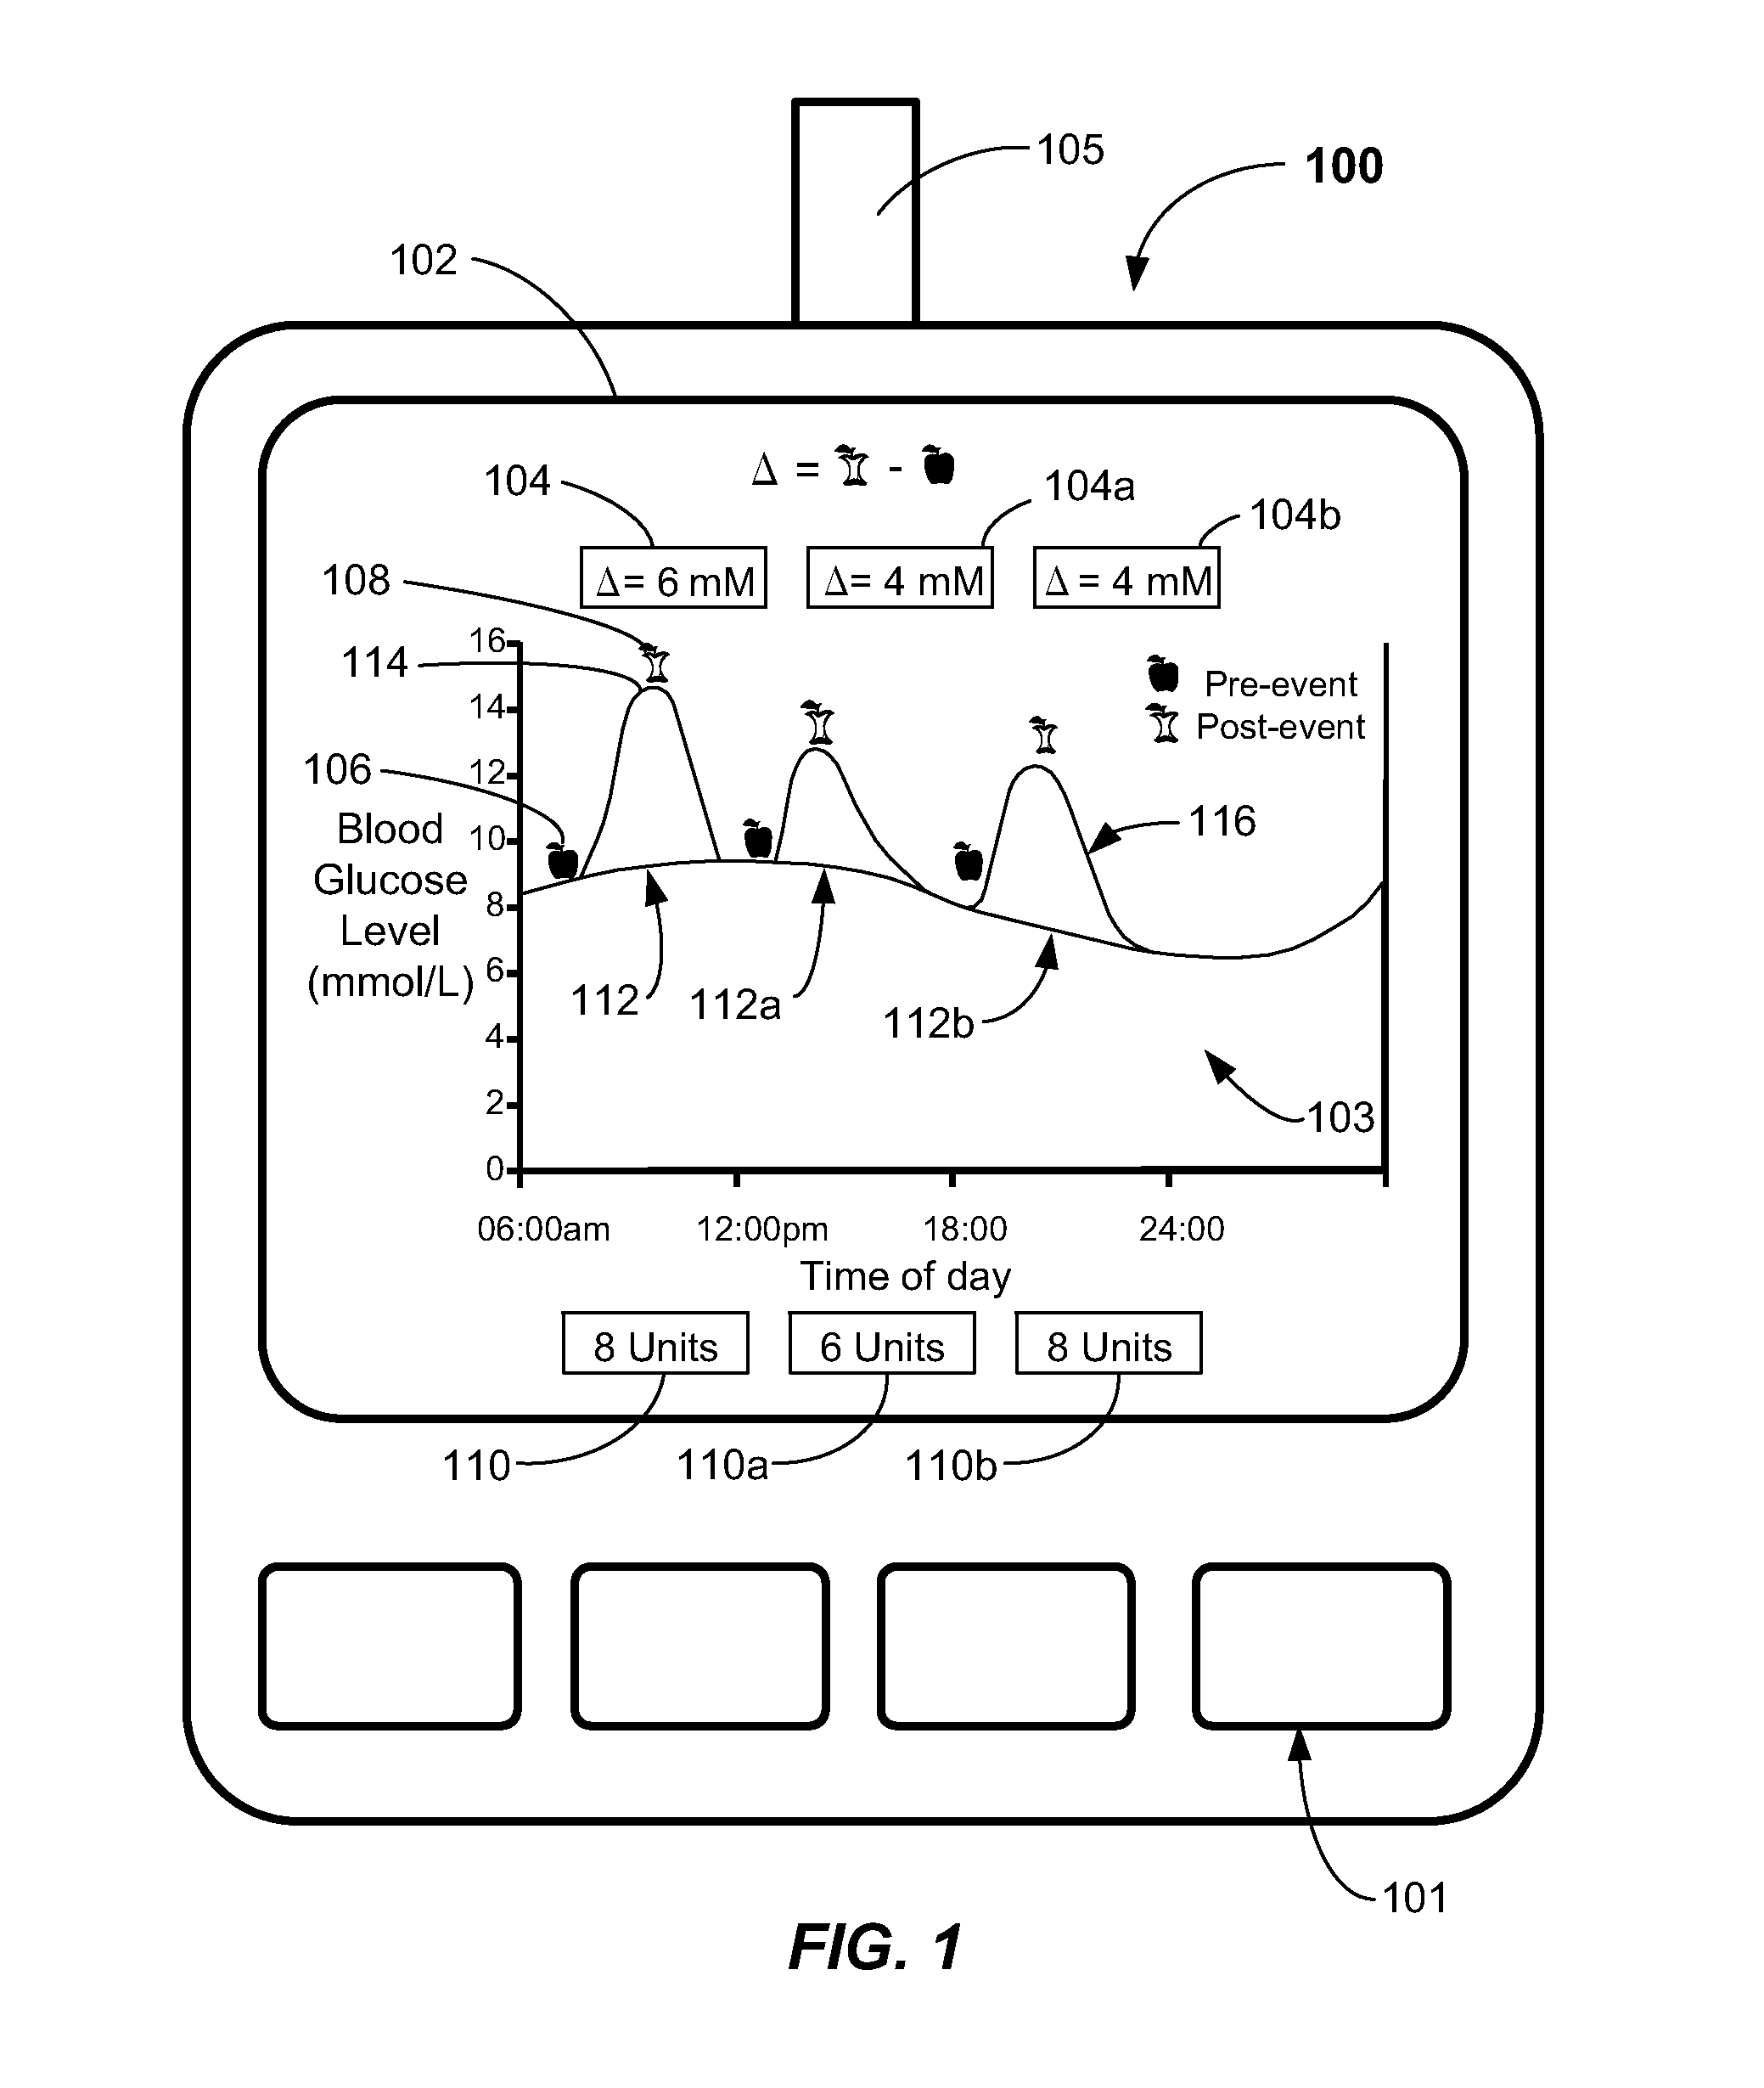
[0034]Associated with a meal event (e.g., lunch) a user takes a pre-prandial and post-prandial glucose readings and such readings are stored in memory of the analyte meter apparatus. Each reading is associated with a time and date stamp automatically stored in memory. The actual time and date of the meal event may be manually entered by the user. If the user administers medicine and / or insulin, then the user may also manually enter that dosage data into the analyte meter apparatus. For example, if the user administers a dosage of eight units of insulin, that data may be manually entered by the user and stored in memory. A date and time stamp may be associated with the dosage, such as through manual entry of the date and time of administering the dosage by the user. An internal software program then associates the pre-prandial and post-prandial glucose concentration level readings with the meal event (based on the time of day of the meal event and the closest proximity of the pre-pra...


PUM


Abstract

Embodiments of the invention provide apparatus, systems and methods wherein pre-event and post-event analyte concentration readings associated with an event are collected and processed to determine a numerical delta. The numerical delta may be displayed on a visual display to aid in a ready determination of the affect that the event (alone or in combination with medication and/or insulin dosages) had on the analyte concentration levels. Medication and/or insulin dosages may be displayed alongside the numerical delta to gauge immediate relationships between numerical delta, dosage and/or an associated event. Apparatus and systems for calculating and displaying the numerical delta are described, as are other aspects.

Description

RELATED APPLICATIONS[0001]This application claims priority to U.S. Provisional Application Ser. No. 61 / 287,550 entitled “APPARATUS, SYSTEMS AND METHODS FOR DETERMINING AND DISPLAYING PRE-EVENT AND POST-EVENT ANALYTE CONCENTRATION LEVELS” filed on Dec. 17, 2009, the disclosure of which is hereby incorporated by reference in its entirety herein.FIELD OF THE INVENTION[0002]The present invention relates generally to apparatus, systems and methods for calculating and displaying analyte concentration information.BACKGROUND OF THE INVENTION[0003]The quantitative determination of analytes in body fluids may be important in the diagnoses and maintenance of certain physiological conditions. For example, individuals with diabetes frequently check glucose concentration levels in their bio-fluids (e.g., blood). The results of such tests may be used to regulate glucose intake in their diets and / or to determine whether insulin and / or other medication may be needed.[0004]Diagnostic systems, such as...

Claims


Application Information

Patent Timeline
IPC IPC(8): G06T11/20G09G5/02G06F19/00G01N33/48
CPCA61B5/14532A61B5/14546A61B5/743A63B2230/20A63B2230/202A63B71/0619
Inventor SIMMONS, DAVID A.REYNOLDS, JEFFERY S.RIPLEY, PAUL M.TELSON, STANLEY A.
Owner ASCENSIA DIABETES CARE HLDG AG
Why Eureka
Try Eureka