Ion detector and system

a detector and detector technology, applied in the field of ion detectors and systems, can solve the problems of inapplicability of coulometry, and inability to provide a total charge measurement in sample solution,

Active Publication Date: 2012-01-12
BOARD OF RGT THE UNIV OF TEXAS SYST +1
View PDF1 Cites 2 Cited by
  • Summary
  • Abstract
  • Description
  • Claims
  • Application Information

AI Technical Summary

Problems solved by technology

Conductivity however responds to all ionic solutes but cannot provide a measure of total charge.
However coulometry is inapplicable for a great variety of ionic species analytes, e.g., Na+ or SO42− whose redox potentials lie beyond a value where solvent breakdown occurs or, e.g., with dilute Cl−, where the redox process is not current efficient.
There is no known technique that provides a measurement of the total charge present in a sample solution.
Multiple standard preparations and calibrations can be cumbersome.
However other common ions such as fluoride, sulfate, phosphate do not absorb UV and so will not respond to direct UV detection.

Method used


Image

  • Ion detector and system
  • Ion detector and system
  • Ion detector and system

Examples


example 1

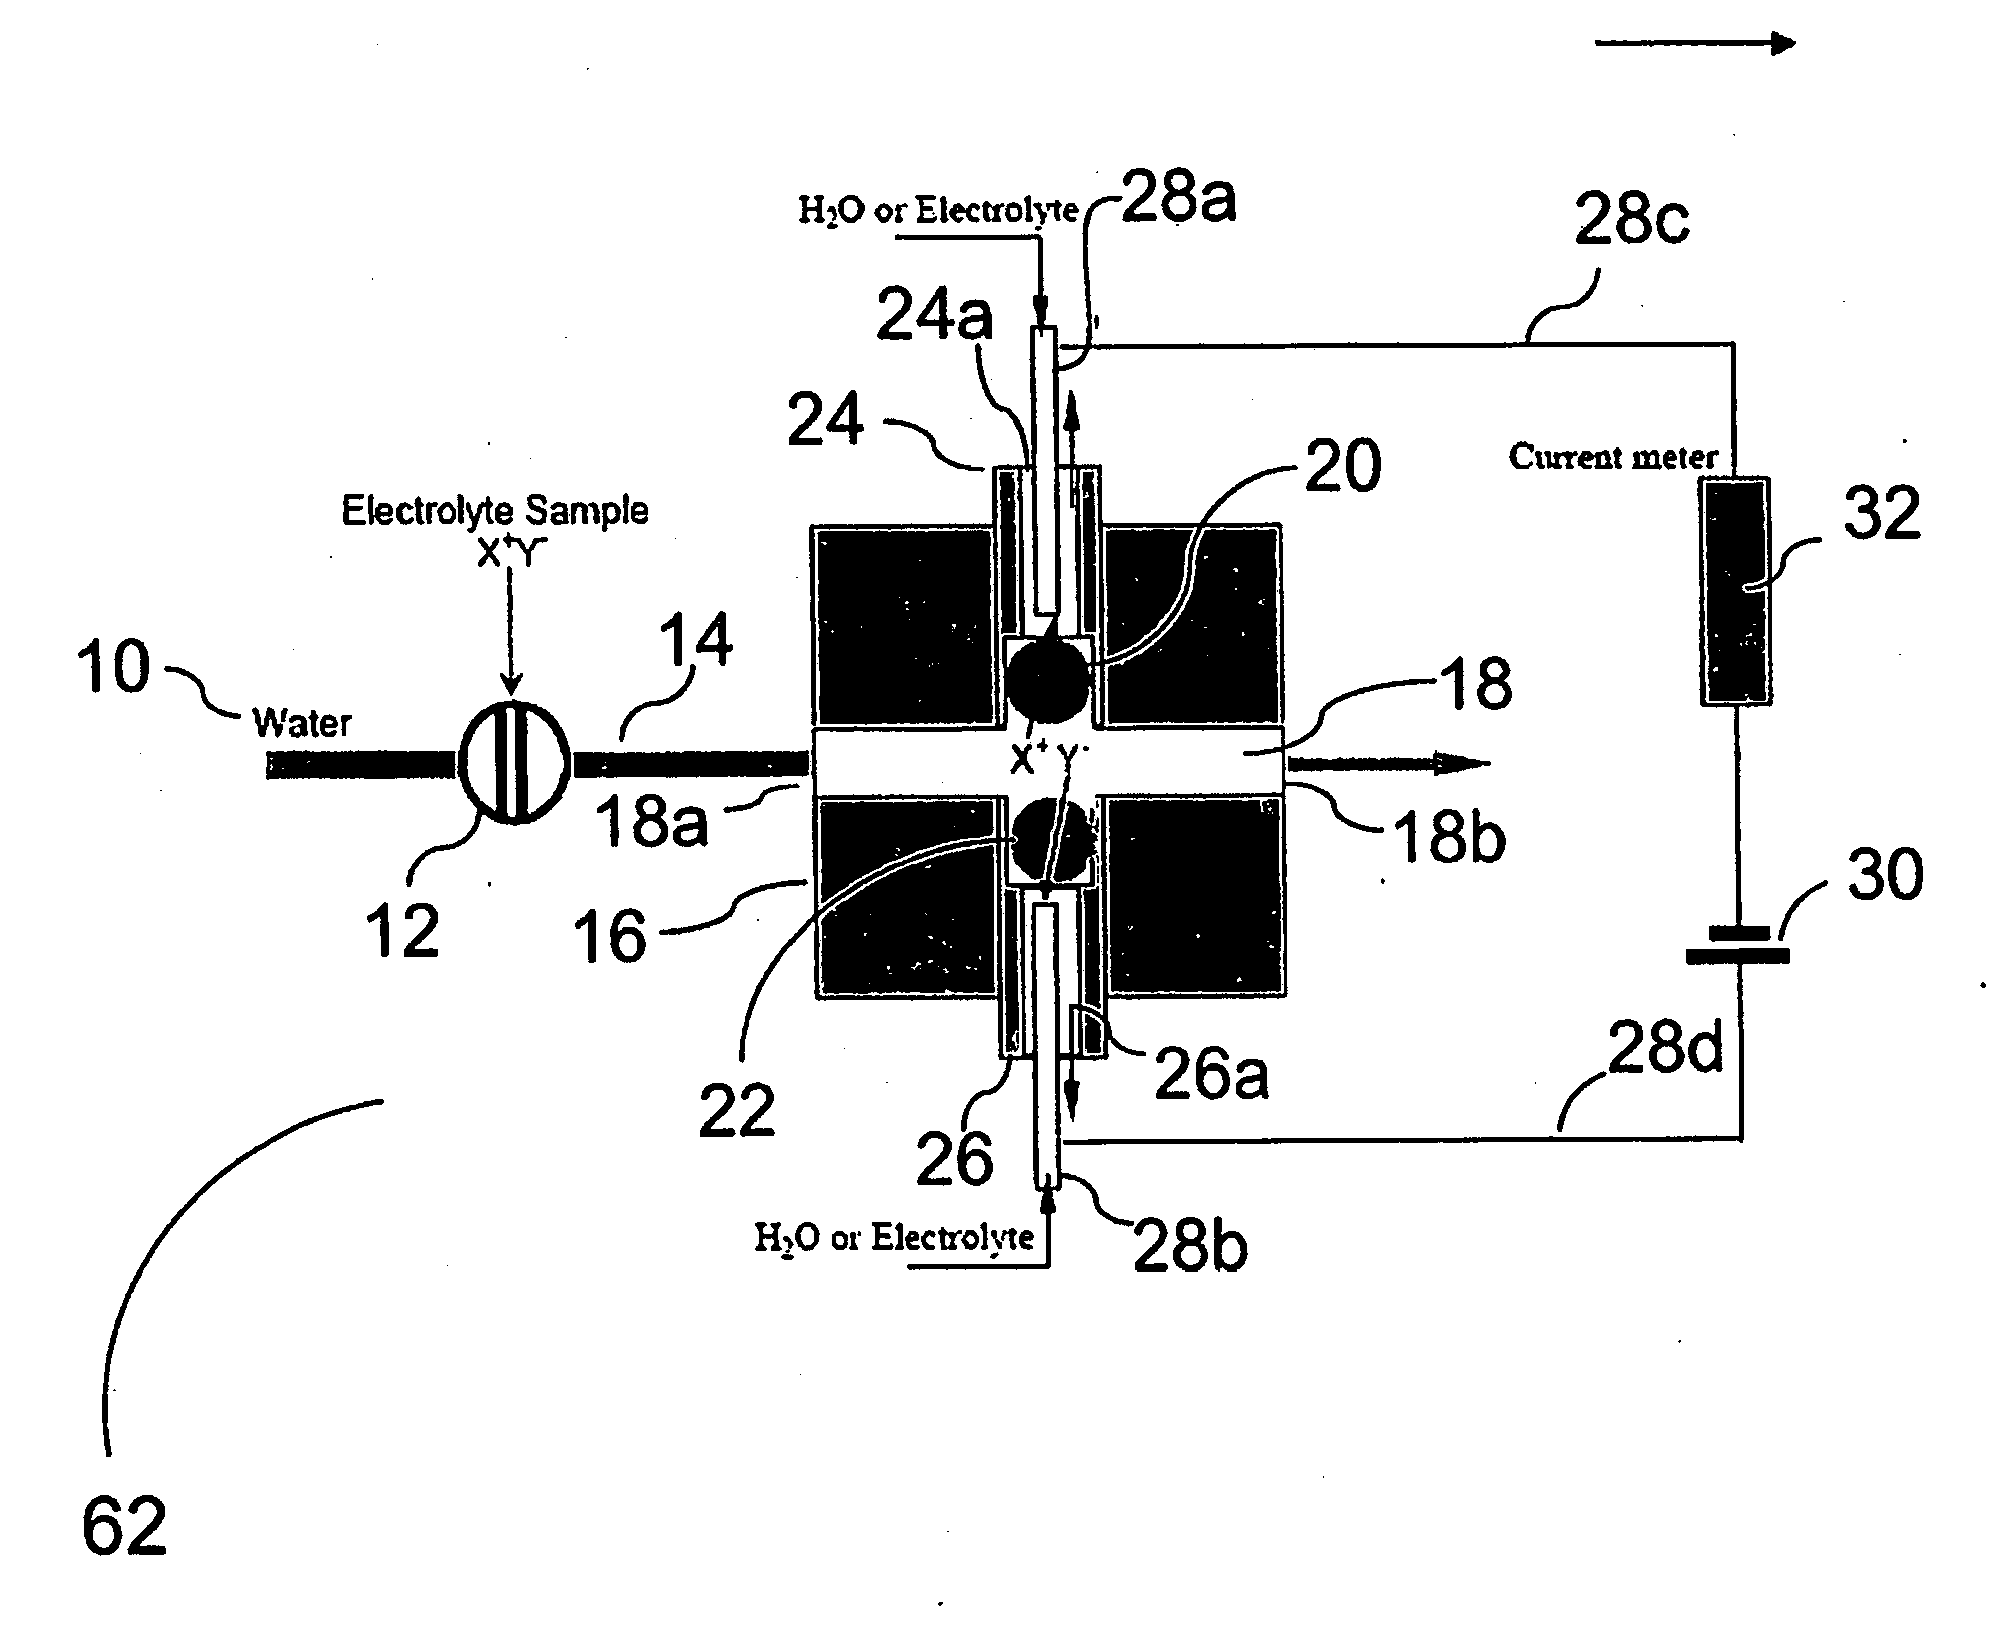
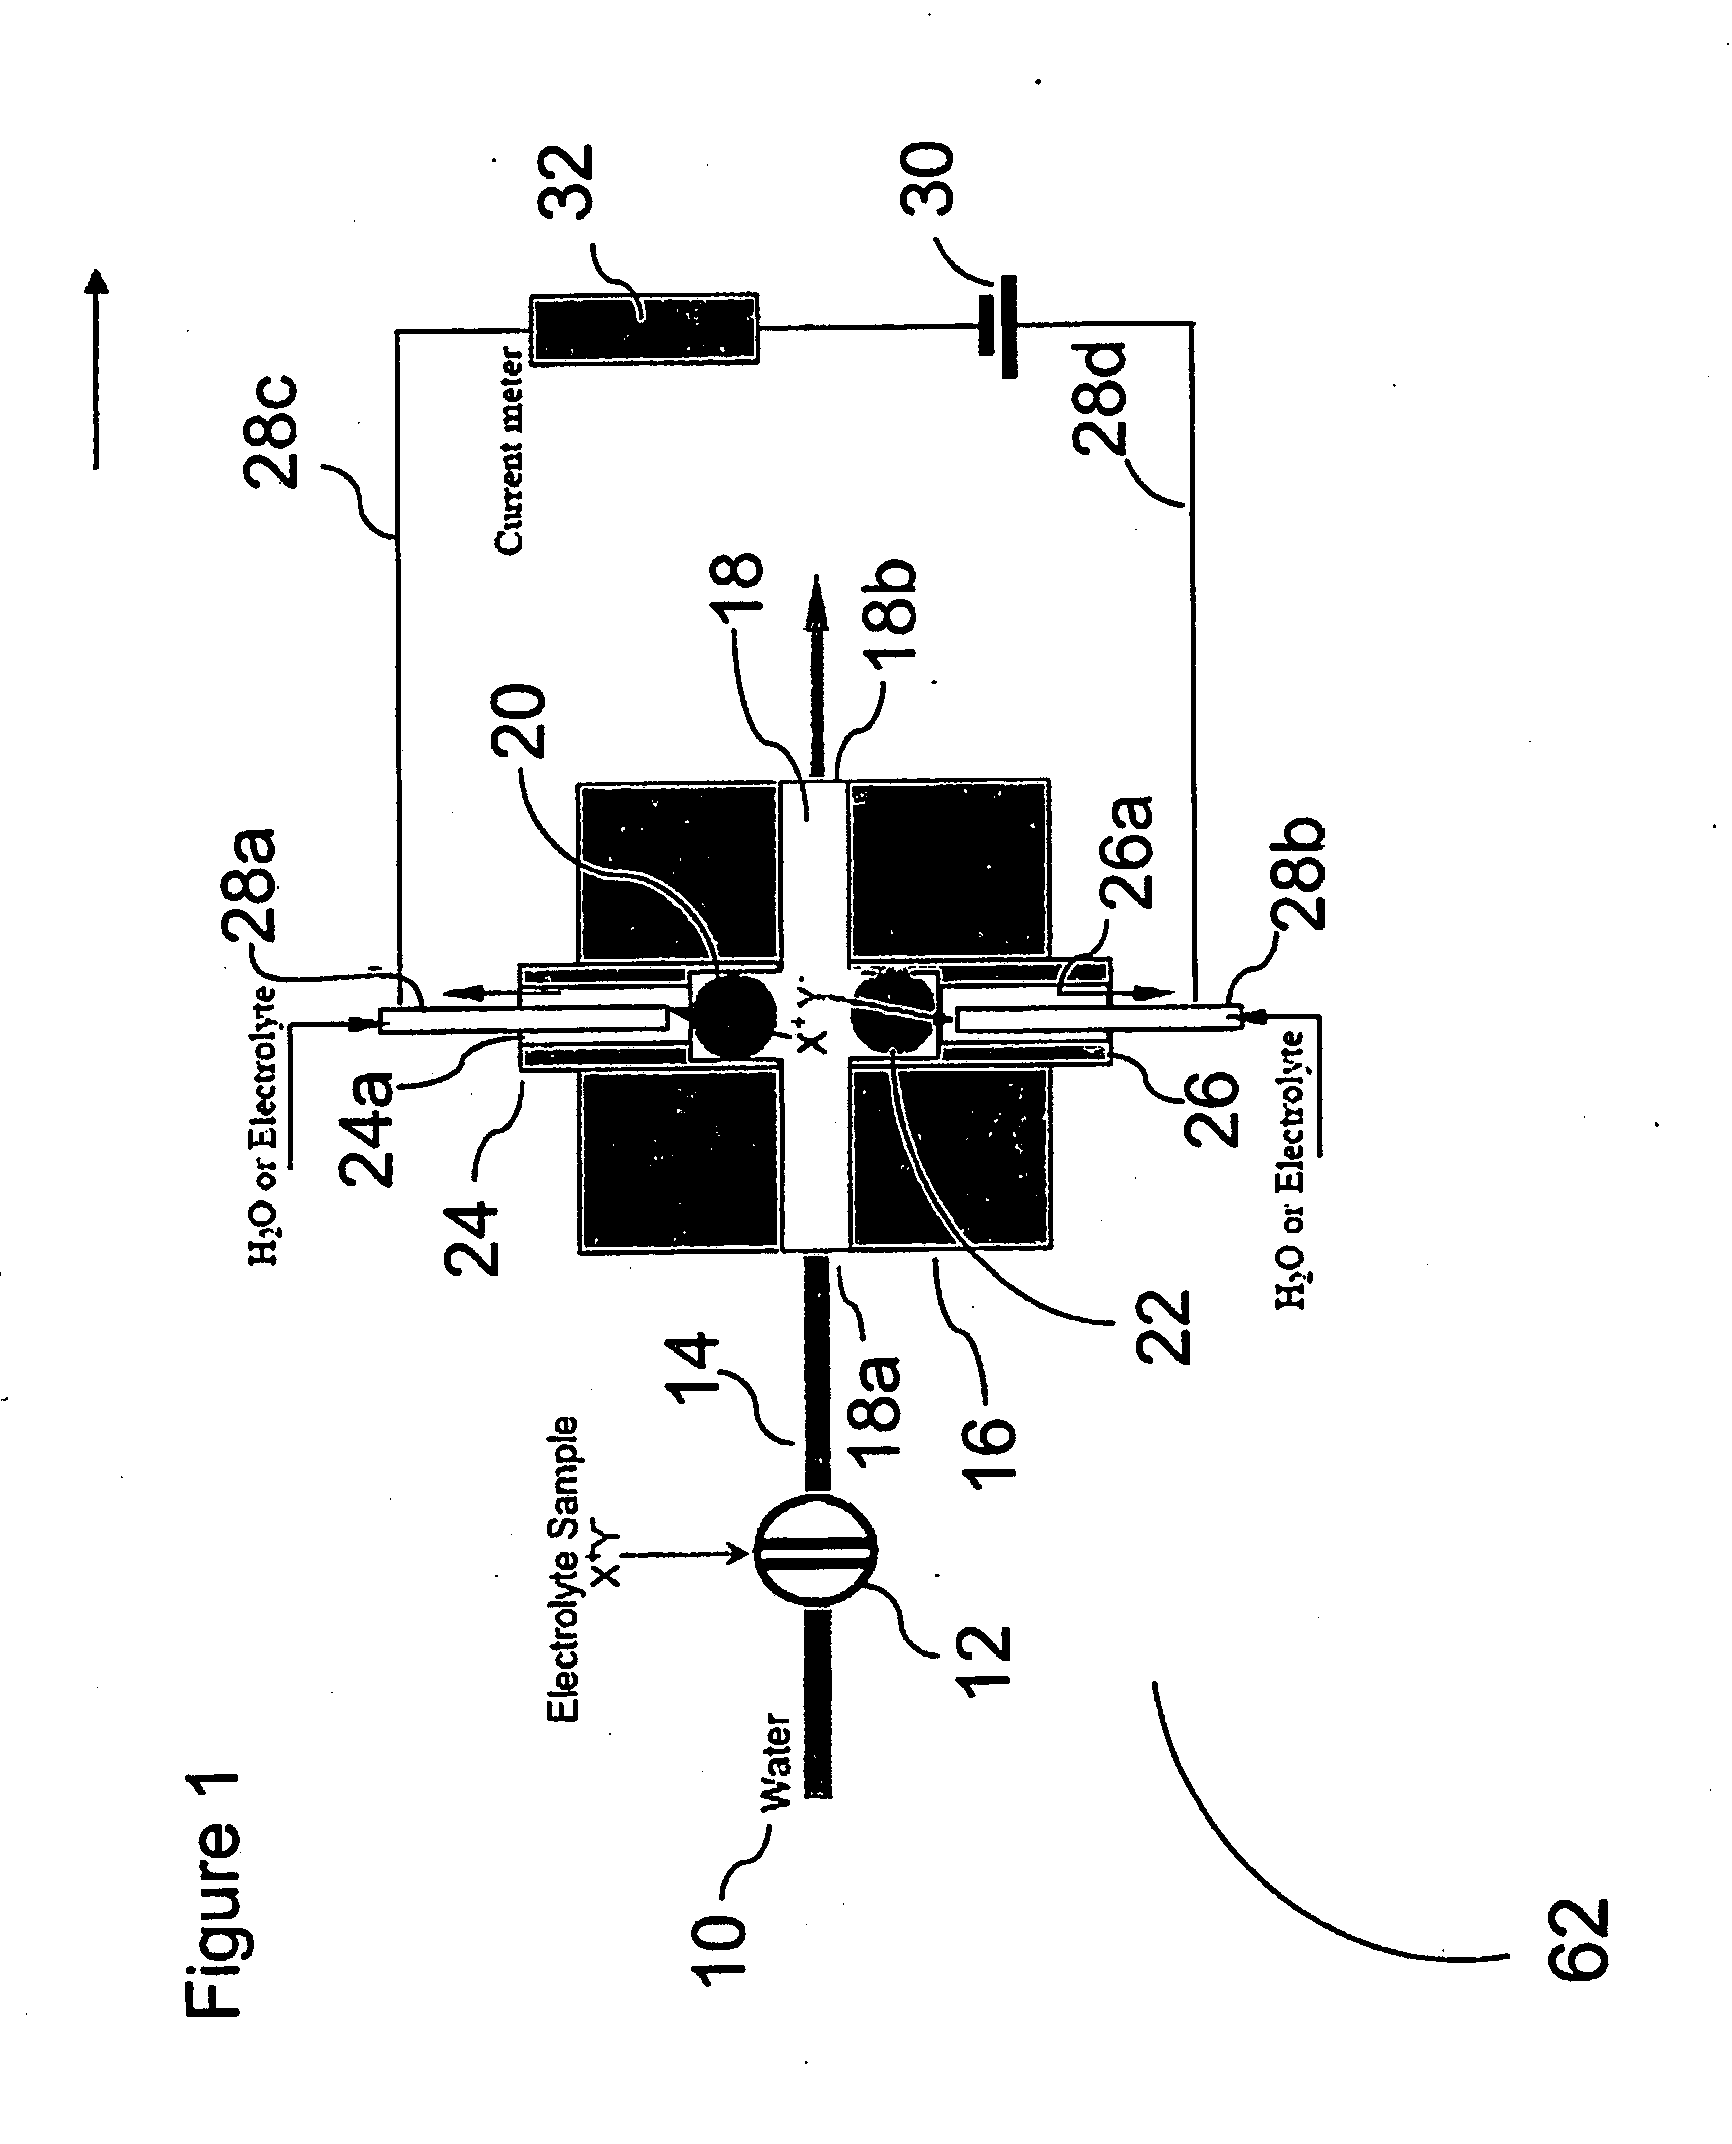
[0066]Using the device of FIG. 1, the arrangement as forward biased when the electrode behind the CER bead is positive with respect to the electrode behind AER bead and reverse biased with the opposite electrode polarity.

[0067]FIG. 10 shows the diode behavior of such devices. Trace (a) shows the i-V plot when 20 mM KOH and 1 mM H2SO4 are respectively present behind the AER / CER beads; (b) shows the case when the CERJAER electrolytes are both 10 mM KNO3. In both cases, water flows-through the central channel. (As illustrated, Trace (a) is the longer plotted line on the right side of the Y-axis.

[0068]Note that in both cases (a) and (b), the device behaves as a diode. In (b), under forward-biased conditions, H+ and K+ are respectively transported through the CER bead while OH− and NO3− are respectively transported through the AER bead to form water and product KNO3 in the central channel. The H+ or Predictably, if the AER and CER beads, representing the charge-selective gates, are remov...

example 2

[0069]FIG. 11 shows the behavior of the reverse-biased ionic diode. The same volume (1 μL) of different electrolyte samples are injected into the central sample flow channel in a DI water stream flowing at 4 μL / min. The applied voltage was 14 V and the CER / AER electrolytes were 20 mM KNO3. It will be noted that equivalent amounts of NaNO3, KCl, HNO3, BaCl2, or K3PO4 all have the same signal (the peak area of the individual responses shown are 194±16 microcoulombs), very different from that of a conductivity detector [10]. The advantage of the same response for equimolar quantities of various salts is that a universal calibration becomes feasible and only one analyte needs to be used for the calibration aspect. This greatly reduces the standard preparation and run time during calibration.

example 3

[0070]FIG. 12 shows optimization studies of response versus flow rate. A 1 μL sample of 0.8 mM KCl was injected. The effluent conductivity for 3 μL / min flow rate is shown. As the detector signal reaches a plateau, the effluent is deionized. For clarity, the standard deviation is shown only for the 3 μL / min data, others are comparable. At a given flow rate, the peak area increases with increasing electric field (applied voltage) and reaches a plateau value until all the charge is transferred. It will be understood that the necessary electric field to reach this plateau is dependent on the residence time and as shown in FIG. 12, the plateau is attained at lower applied voltages as the residence time increases. Not shown here is the corollary case that at a fixed applied voltage, peak area reaches a constant plateau value as flow rate is decreased.


PUM

PropertyMeasurementUnit
voltageaaaaaaaaaa
voltageaaaaaaaaaa
voltageaaaaaaaaaa

Abstract

Apparatus and method for detecting current or potential generated in a liquid sample suitable for use in a chromatography or other liquid sample analytical system. One embodiment is an electrolytic ion transfer device with a signal detector in communication with the electrodes of the transfer device. Another is a combination ion transfer device / electrolyte generator. Another substitutes a detector for the ion transfer device in the combination.

Description

CROSS-REFERENCE TO RELATED APPLICATION(S)[0001]This application is a divisional application of pending U.S. application Ser. No. 12 / 039,695 filed on Feb. 28, 2008.BACKGROUND OF THE INVENTION[0002]The present invention relates to apparatus for detecting current or potential generated by ionic species in a liquid sample solution.[0003]Conductivity detection is a bulk property detection and the total conductance depends on the nature of the ions via the charge on the ion and the mobility and the concentration in a sample. The specific conductance of a solution is the sum of the concentration-mobility product of the different ions present. It is well known that equal concentrations of specific different compounds, e.g. NaCl and HCl, have vastly different specific conductance. Conductivity however responds to all ionic solutes but cannot provide a measure of total charge.[0004]Coulometry is an analytical method for determining an unknown concentration of an analyte in a sample solution b...

Claims


Application Information

Patent Timeline
Patent Type & Authority Applications(United States)
IPC IPC(8): G01N30/22G01N27/42
CPCG01N30/64Y02E60/366G01N30/96Y02E60/36
Inventor DASGUPTA, PURNENDU K.YANG, BINGCHENGSRINIVASAN, KANNAN
Owner BOARD OF RGT THE UNIV OF TEXAS SYST
Why Eureka
Try Eureka