Apparatus and method for generating a condition indication

a condition indication and apparatus technology, applied in the field of medical instruments and systems for monitoring, displaying, controlling and interpreting, can solve the problems of increasing the risk of diabetic micro- and macrovascular complications, increasing the risk of long-term complications, and affecting the accuracy so as to improve the quality of diagnosis and treatment, improve the effect of observation, interpretation and decision-making

Inactive Publication Date: 2012-08-16
DIABETES TOOLS SWEDEN
View PDF1 Cites 55 Cited by
  • Summary
  • Abstract
  • Description
  • Claims
  • Application Information

AI Technical Summary

Benefits of technology

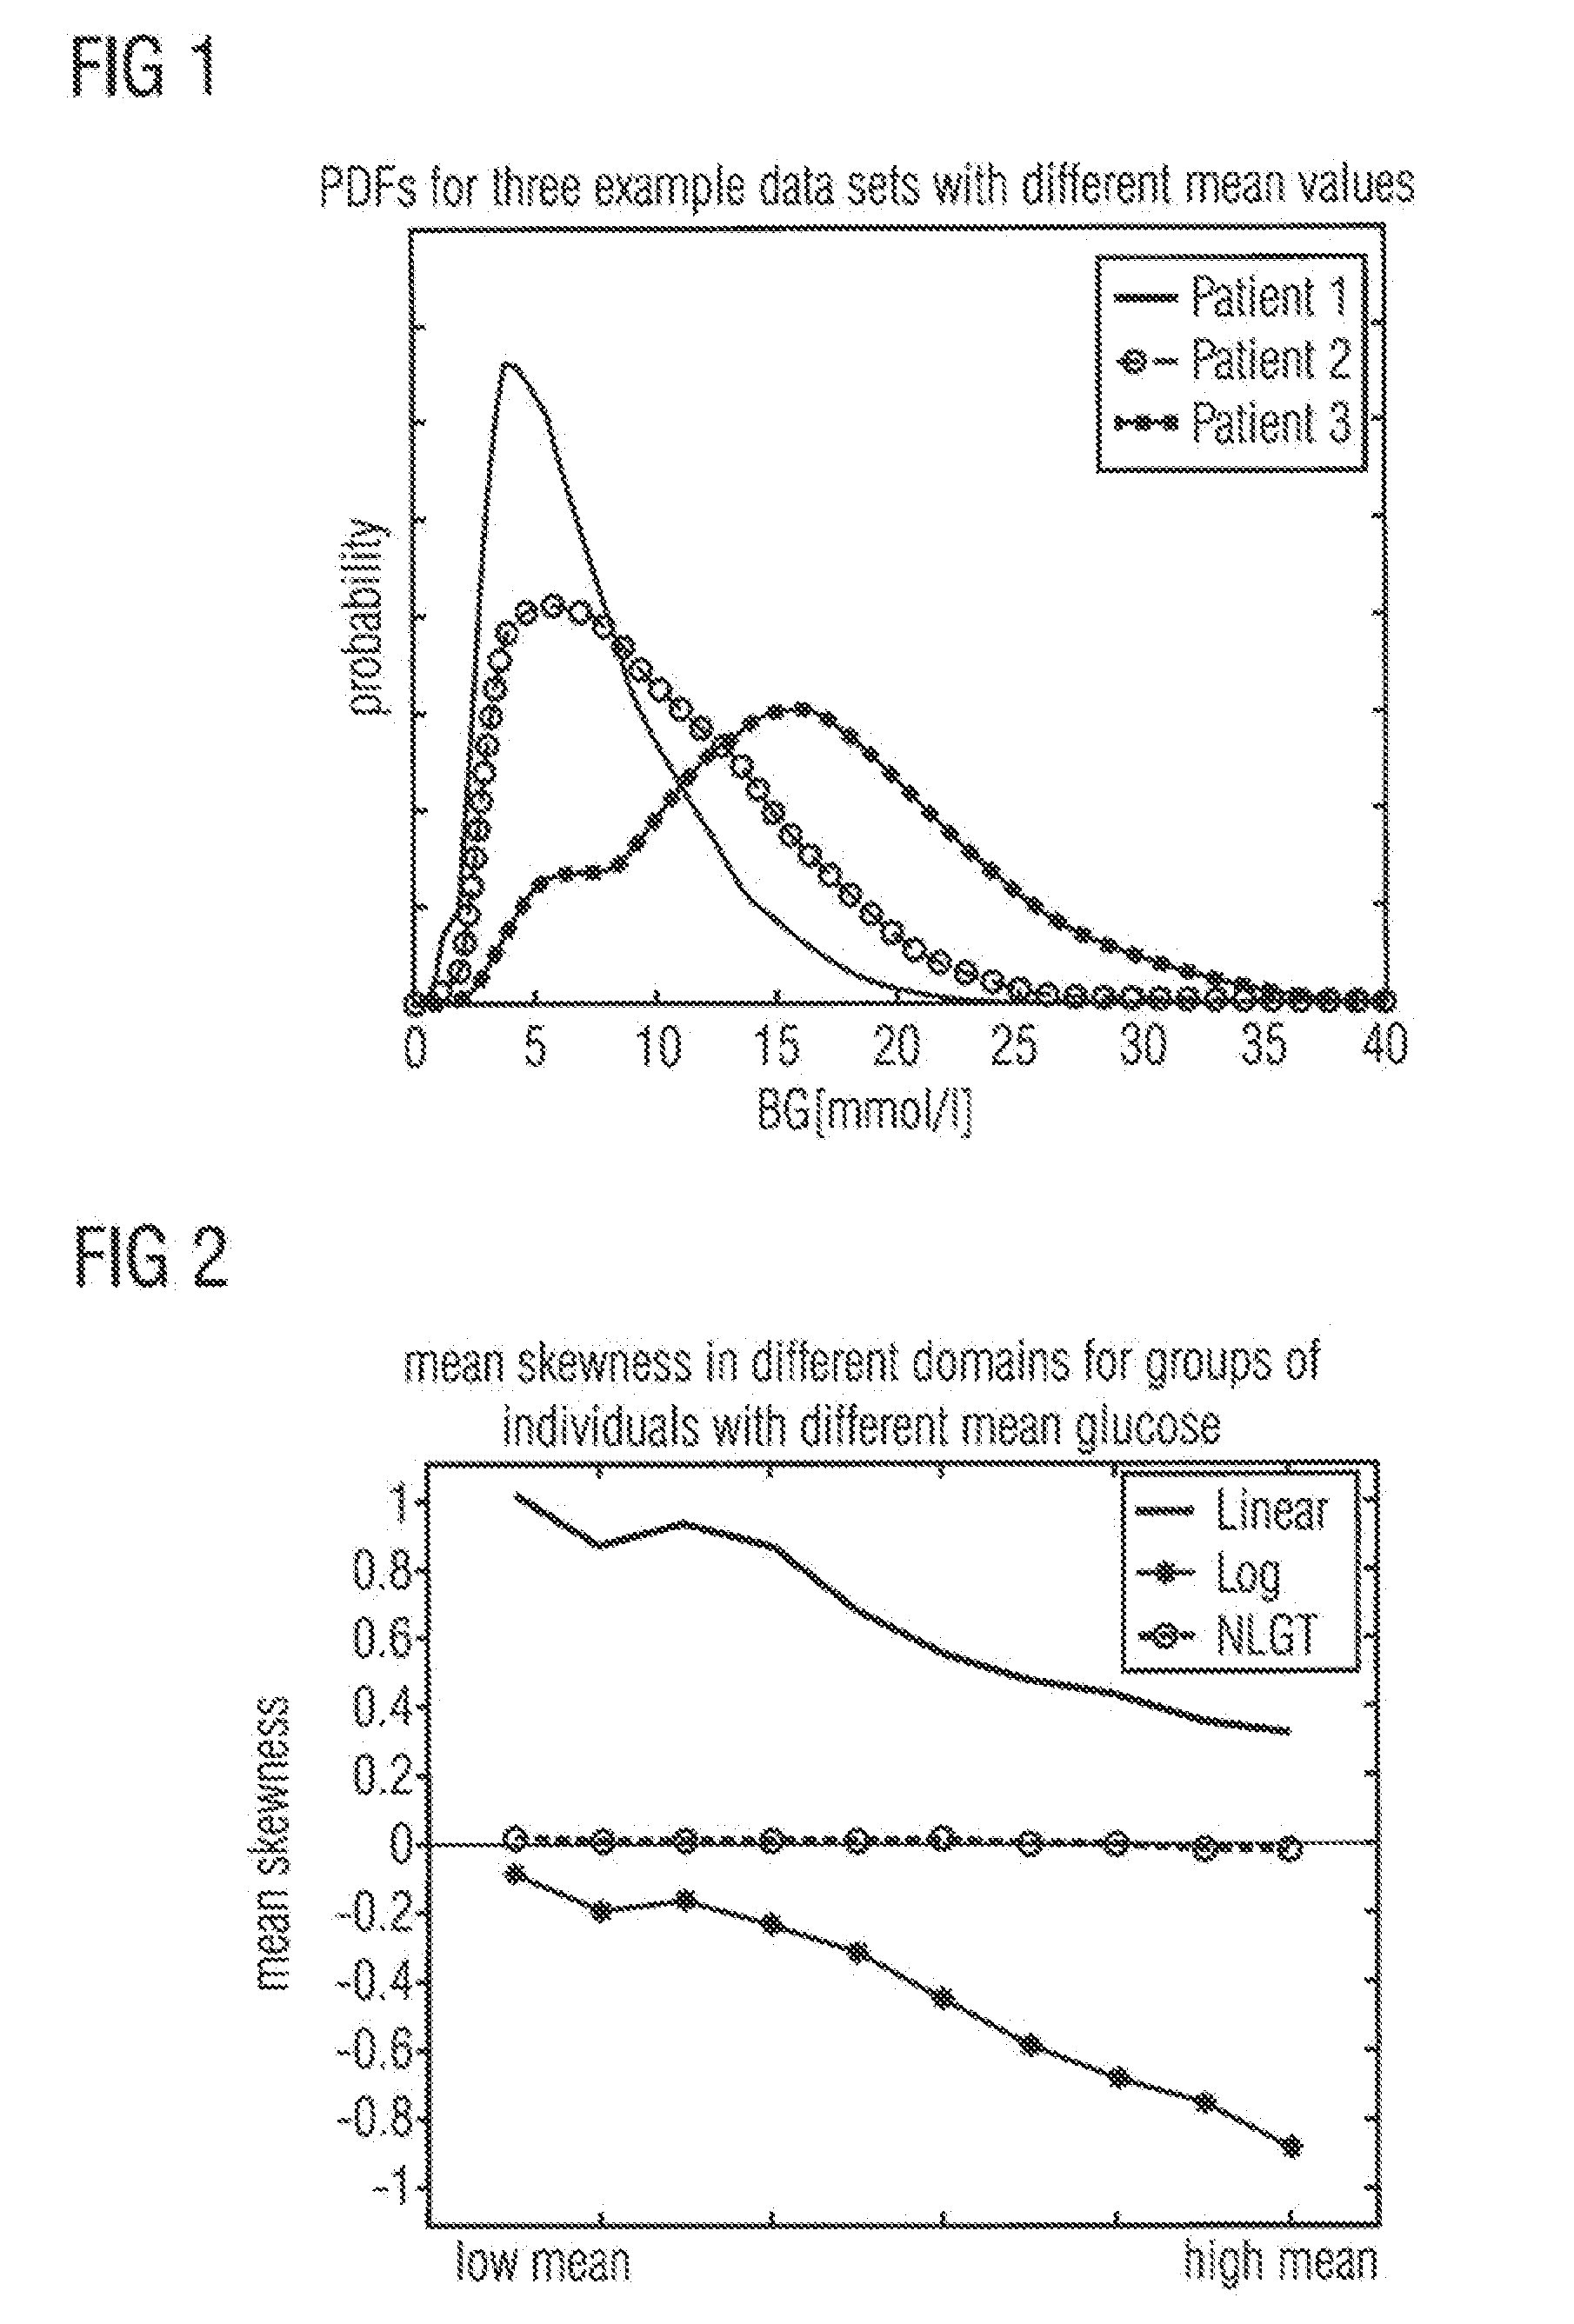
[0027]The theoretical research behind the present invention demonstrates that every individual has a unique and—over time—changing glucose probability distribution vastly affected by DM type, DM stage, glucose control and treatment regimen, see FIG. 1. The invention and the embodiments described herein, teaches a novel transform method for improving presentation, interpretation, self-care, clinical decision-making and glycemic control from stored, displayed and / or measured glycemic data.
[0051]Aspects of the present invention relate to a transform method and embodiments used to display, present, interpret, control and / or convert glycemic values in a novel and substantially improved way. Specifically aspects of the invention teach how to apply a transform method that is optimized for a large or small population, or even for an individual, in order to improve and enhance observation, interpretation and decision-making when presenting, reading, interpreting, controlling or making decisions from stored, displayed and / or measured glycemic data. The non-linear glucose transform (NLGT) according to aspects of the present invention, offers a physiologically and statistically more accurate way of representing glycemic information. In addition it offers higher accuracy compared to conventional methods, when interpreting and evaluating the effect, impact and risk from glycemic information.

Problems solved by technology

Elevated levels of glucose, hyperglycemia, gradually induce or increase the risk of developing diabetic micro- and macrovascular complications.
Long term risk and complications increase approximately exponentially in relation to a glucose mean level.
Additionally, other complications include infections, metabolic difficulties, impotence, autonomic neuropathy and pregnancy problems.
This means staying below hyperglycemic levels but above the critical concentration level at which the amount of glucose is not sufficient for vital energy supply, hypoglycemia.
When the glucose concentration is too low, symptoms like unconsciousness, confusion or seizure that preclude self-treatment set in.
Recurring severe hypoglycemic events increase the risk of brain damage.
For patients with diabetes, self-management is a lifelong struggle trying to achieve treatment targets while balancing between the short term risk of hypoglycemia and the risk of long-term medical complications due to hyperglycemia.
The dynamics and complexity of DM with multiple influencing factors, in combination with insufficient options for treatment, make successful therapy a difficult challenge.
While CGM has proven useful, its use is still limited, partly due to high costs, accuracy and reliability issues.
Despite pharmaceutical and technical advances in treatment of diabetes the means to reach satisfactory blood glucose levels are neither adequate nor sufficient.
Treatment feedback from typical instruments and tools exhibit serious limitations that hampers understanding of the problems involved in the control of diabetes.
As of today, there are no commercially available instruments or tools based on the assumption of glucose data being log-normally distributed or any other distribution, besides the normal Gaussian distribution.
Thus, presentation, indication and statistics of glucose data are often biased and therefore impairing interpretation, treatment and potential feedback to the observer.
Consequently, current methods, instruments and tools do not take this into account and typically suffer from incorrect bias.
The typical cluster of glucose readings will generally not be symmetrically distributed around the mean—making interpretation of changes in glucose levels difficult and sometimes misleading or obscured for the observer.
Additionally, a universal presentation scale based on the assumption of a typical distribution (normal or even log-normal), will for many patients suppress the resolution in important areas of the blood glucose range such as in the hypo- or hyperglycemic regions, thus obscuring potential risk assessment.
As the detector driving the tilt angle of the arrow usually does not take into account the non-linear glucose propagation, the indication is often misleading.
Thus such indicators fail to properly demonstrate the magnitude of the risk posed by a certain glucose level change.
Furthermore, the non-linear glucose propagation impairs the accuracy and reliability of typical alarm prediction algorithms.
This results in unnecessitated and irrelevant alarms and indications in the hyperglycemic range, and too few alarms and too small indications in the hypoglycemic range for certain types of DM patients.
Thus, the true clinical value of this feature has been somewhat limited.
For asymmetric glucose distributions this renders unreliable results.
From a treatment perspective, the disadvantages of these standard measures imply a reduced accuracy in diagnosis, improper interpretation and inaccurate results.
In conclusion, user feedback from measurements, diagnosis, analysis, treatment and self-care in the field of diabetes has since its inception been plagued with problems originating from the assumption that blood glucose data is normally distributed (or by some, logarithmically distributed).
Unfortunately, this applies to everything from clinical lab equipment and self-management devices for glucose measurements, to results and statistics presented in clinical studies and scientific research.
Importantly, both terms influence more or less the transformed value, since a piecewise transform having a first portion until a certain border value which is a logarithmic function and having a second portion for higher values than the border value which is a linear function does not accurately reflect the statistics within glycemic data so that such a “piecewise” transform will not result in a high quality transform having a set of transformed values showing a more accurate Gaussian normal distribution than the set of values had before the transform.

Method used


Image

  • Apparatus and method for generating a condition indication
  • Apparatus and method for generating a condition indication
  • Apparatus and method for generating a condition indication

Examples


Embodiment Construction

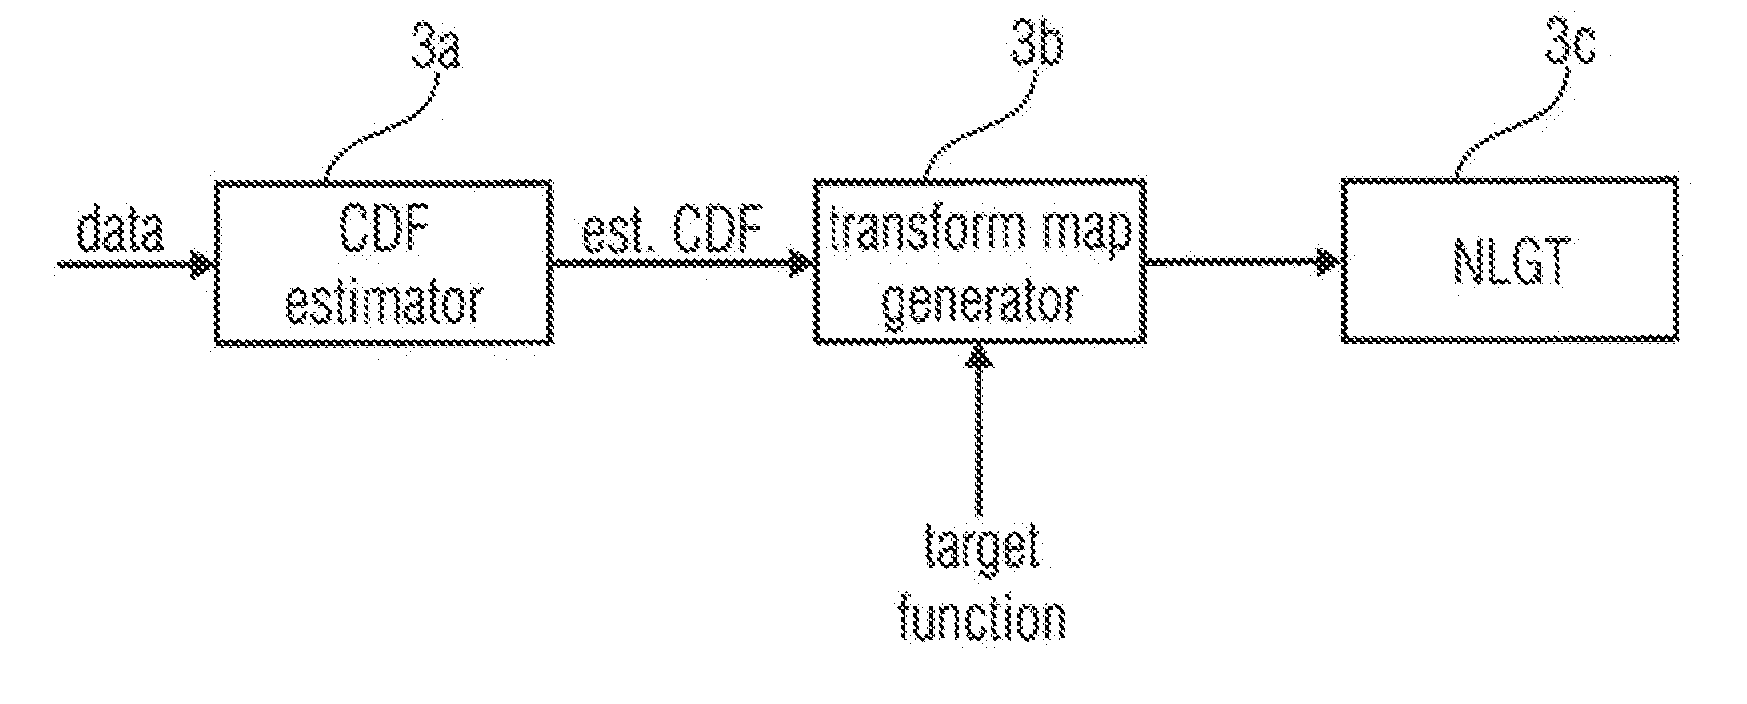
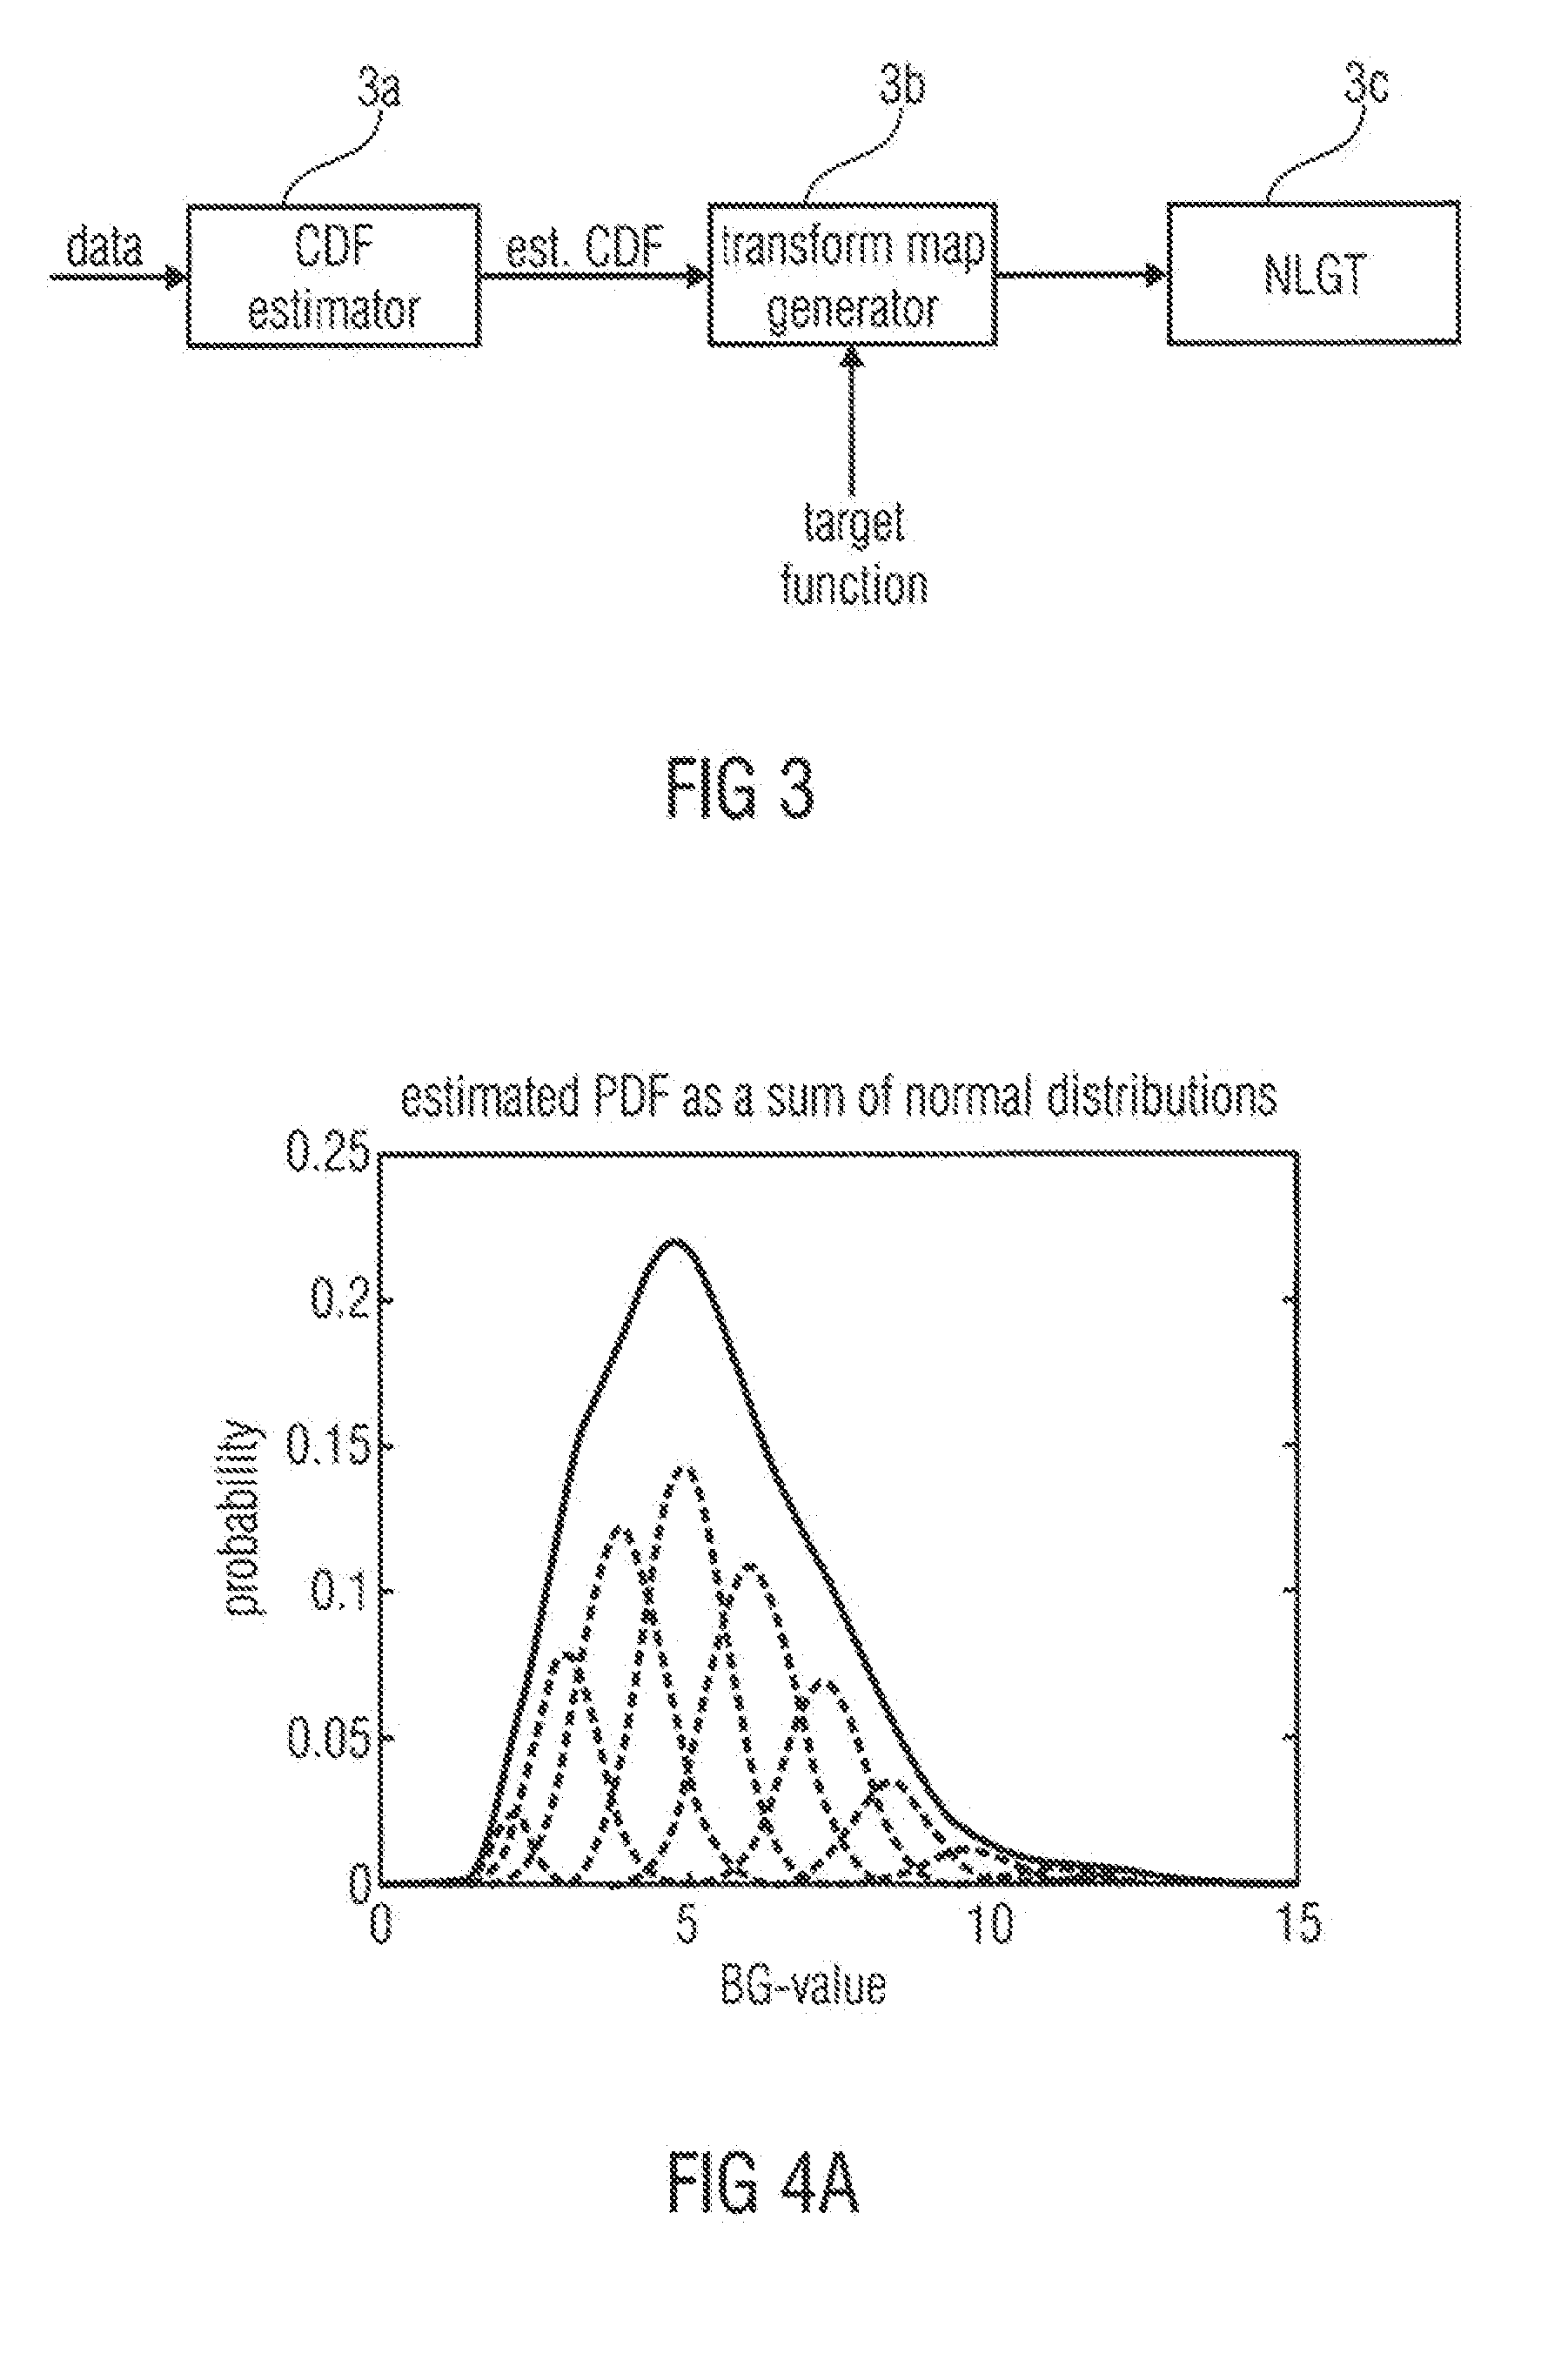
[0096]It is to be noted that the above and subsequently described aspects can be used in combination or separately from each other. Furthermore, the other different features of the invention related to the CDF smoothing, target function, generating the transform map / transform function, transforming data, universal transform for a collection of data sets, a simplified universal transform for a collection of data sets, a graphical interpretation, predictive alarms and glucose dynamics interpretation, estimation of central tendency, estimation of variability, or artificial pancreas can be used in combination or separately from each other, i.e. as alternatives, in accordance with the present invention.

[0097]FIG. 1 illustrates PDFs for three example patients with different glucose mean values.

[0098]FIG. 2 illustrates a mean skewness for glucose data sets with different glucose mean values. The diagram is based on 520 data sets from the well-known DCCT study. The skewness has been calcula...


PUM


Abstract

An apparatus for generating a condition indication using a time sequence of data values, each data value representing a physiological measure of a condition of a subject at a time, includes: a transformer for transforming the time sequence of data values into a transformed sequence of data values using a transform rule, wherein the transform rule is such that a certain characteristic in a time course of the physiological measure is represented by the transformed sequence of data values is more linear than the time course before the transform; a rate of change calculator for calculating an estimated rate of change for the transformed sequence of data values; and a processor for processing the estimated rate of change to output the condition indication.

Description

CROSS-REFERENCE TO RELATED APPLICATIONS[0001]This application is a continuation of copending International Application No. PCT / EP2010 / 061638, filed Aug. 10, 2010, which is incorporated herein by reference in its entirety, and additionally claims priority from U.S. Application No. 61 / 232,697, filed Aug. 10, 2009, which is incorporated herein by reference in its entirety.BACKGROUND OF THE INVENTION[0002]The present invention relates to medical instruments and systems for monitoring, displaying, controlling and interpreting data typically extracted from bodily fluid analytes of mammalians.[0003]Diabetes mellitus (DM) is the common name for a series of metabolic disorders caused mainly by defects in the glucose regulatory system leading to a partial or total destruction of the insulin producing beta cells. Insulin resistance, insufficient amount or total loss of insulin, reduce or inhibit counter regulatory means to achieve glucose homeostasis. Impaired glucose regulation is reflected i...

Claims


Application Information

Patent Timeline
Patent Type & Authority Applications(United States)
IPC IPC(8): A61B5/145A61B5/00G16H10/60
CPCA61B5/14532A61B5/4839G06F19/3456G06F19/3437G06F19/345G06F19/322G16H10/60G16H20/10G16H40/63G16H50/20G16H50/30G16H50/50A61B5/7253A61B5/7275A61B5/746A61M5/1723A61M2230/005A61M2230/201
Inventor LJUHS, MICHAEL KJELLRIBACK, JACOB LARS FREDRIKLILJERYD, LARS GUSTAF
Owner DIABETES TOOLS SWEDEN
Why Eureka
Try Eureka