Occupant centric capture and visualization of building performance data

a technology of building performance and data capture, applied in computing, instruments, electric digital data processing, etc., can solve problems such as data access, difficult for users to understand complex interacting factors that affect overall building performance, and limited 2d graphs or abstract numerical outputs

Active Publication Date: 2012-11-22
AUTODESK INC
View PDF23 Cites 113 Cited by
  • Summary
  • Abstract
  • Description
  • Claims
  • Application Information

AI Technical Summary

Problems solved by technology

Although visualization techniques have been used to interpret BIM data models, such techniques have been limited to 2D graphs or abstract numerical outputs.
In particular, existing building dashboard systems, that visualize information collected from sensors distributed throughout a building, typically show the raw data values as simple text labels on 2D floor plans, this reduction is data access makes it very difficult for users to understand complex interacting factors that affect overall building performance.
Furthermore, current visualization techniques generally do not directly relate spatial and non-spatial data.
Another limitation of a typical building performance data visualization methodology is that occupants are generally treated as “passive participants” within an environment controlled through a centralized automation system, and the entire interior space is generally treated as a homogenous environment.

Method used


Image

  • Occupant centric capture and visualization of building performance data
  • Occupant centric capture and visualization of building performance data
  • Occupant centric capture and visualization of building performance data

Examples


Embodiment Construction

[0023]In the following description, numerous specific details are set forth to provide a more thorough understanding of the present invention. However, it will be apparent to one of skill in the art that the present invention may be practiced without one or more of these specific details. In other instances, well-known features have not been described in order to avoid obscuring the present invention.

[0024]Reference throughout this disclosure to “one embodiment” or “an embodiment” means that a particular feature, structure, or characteristic described in connection with the embodiment is included in at least one embodiment of the present invention. Thus, the appearances of the phrases “in one embodiment” or “in an embodiment” in various places throughout this specification are not necessarily all referring to the same embodiment. Furthermore, the particular features, structures, or characteristics may be combined in any suitable manner in one or more embodiments.

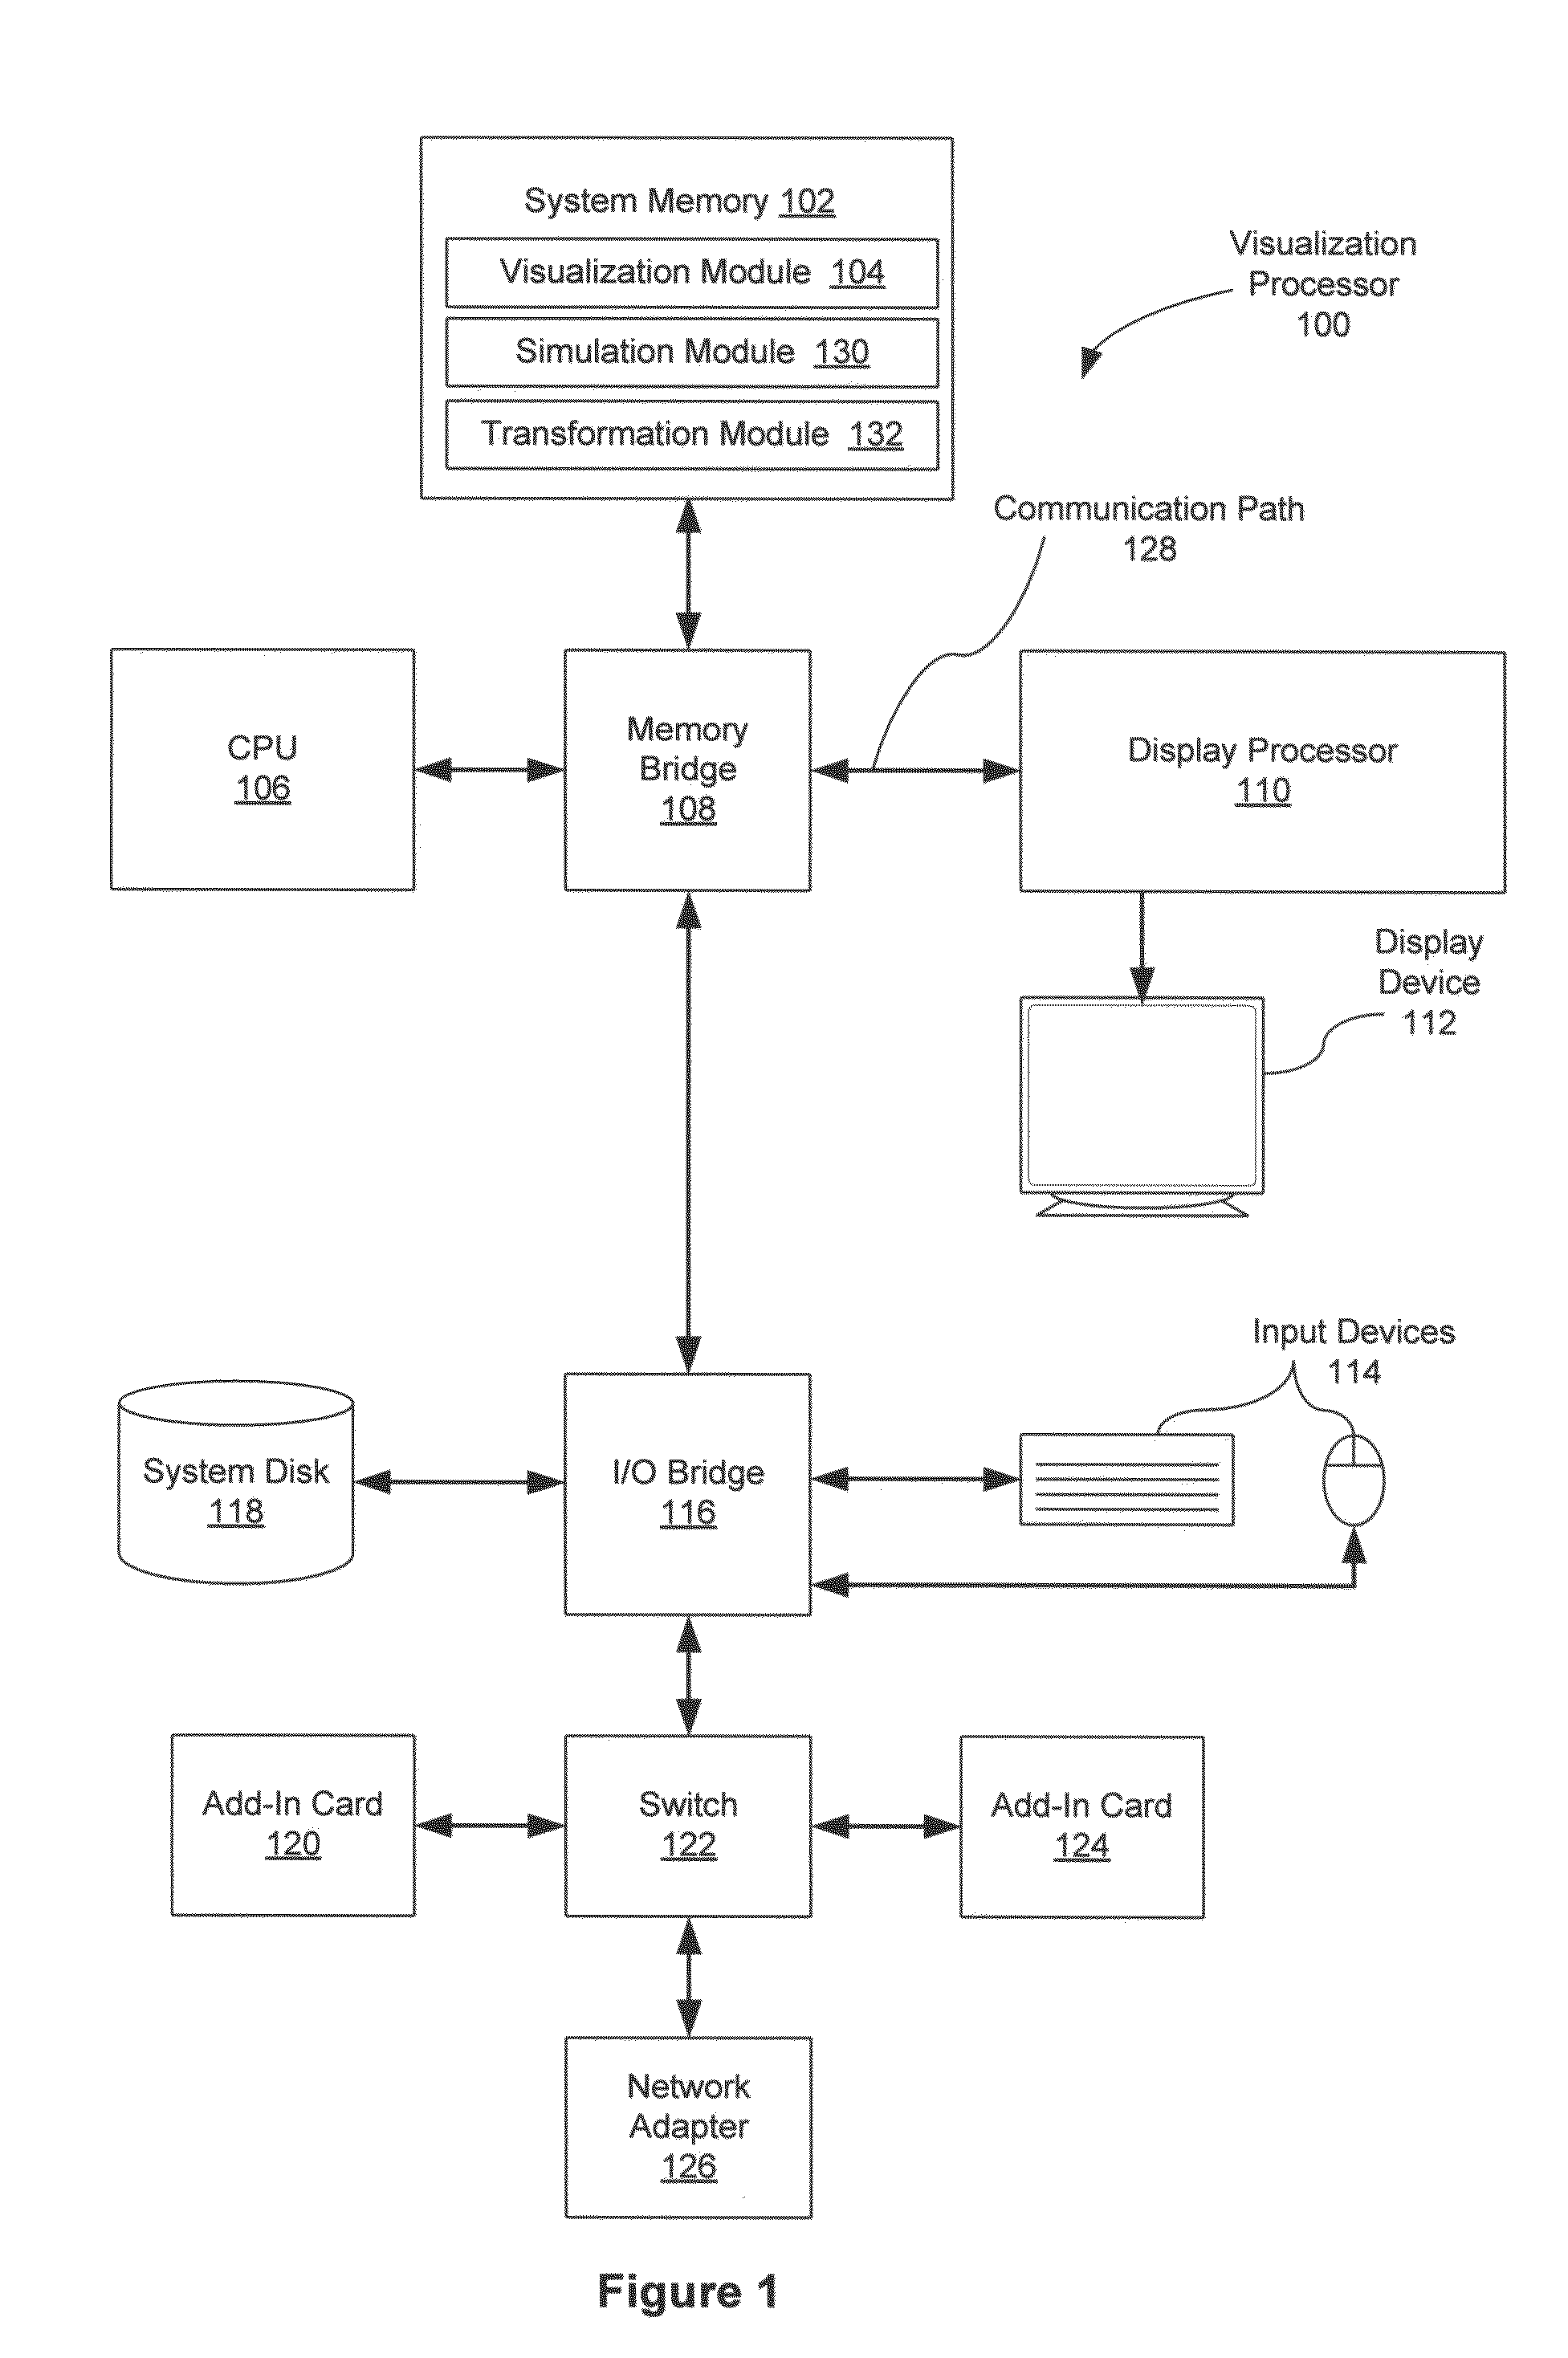
[0025]FIG. 1 illustr...


PUM


Abstract

A computer implemented method for 3-D visualization of a building module and building related data includes receiving attributes of a plurality of building modules from a building information model and receiving data inputs from a plurality of sensors located in at least a subset of the plurality of building modules. The building related data is calculated for each of the plurality of building modules based on the data inputs. A 3-D visualization data of a selected building module in the plurality of building modules is generated for display on a computer screen.

Description

BACKGROUND OF THE INVENTION[0001]1. Field of the Invention[0002]Embodiments of the present invention relate generally to a computer-implemented method for generating visual representations of building modules and more particularly creating computing dashboard for displaying 3-D visualization of building related data.[0003]2. Description of the Related Art[0004]Building Information Model (BIM) is a building design methodology characterized by the creation and use of coordinated, internally consistent computable information about a building project in design and construction. BIM methodology employs objects that may be abstract or conceptual, and produces data models that include building geometry, spatial relationships, geographic information, and quantities and properties of building components.[0005]Many BIM authoring tools or software tools are available to create the BIM data models for buildings. A building architect may use these tools to create modular objects representing bui...

Claims


Application Information

Patent Timeline
Patent Type & Authority Applications(United States)
IPC IPC(8): G06F17/50
CPCG06T2210/04G06T19/00
Inventor HAILEMARIAM, EBENEZERKURTENBACH, GORDKHAN, AZAMATTAR, RAMTINTESSIER, ALEXANDER
Owner AUTODESK INC
Why Eureka
Try Eureka