
Determining hemodynamic performance

a technology of hemodynamic performance and determining method, which is applied in the field of determining method, system and software product for determining hemodynamic performance, can solve the problems of heart failure, subject will often enter a state of shock, and worsening of patient's condition, and achieve the effect of restoring non-optimal hemodynamic performan

Active Publication Date: 2013-01-24
HUMAN CHIMP PTY LTD
View PDF5 Cites 23 Cited by
  • Summary
  • Abstract
  • Description
  • Claims
  • Application Information

AI Technical Summary

Benefits of technology

[0017] In one embodiment, the processor processes the data to produce a second display signal causing the display device to present simultaneously a second visual mapping. The visual mapping produced by the second display signal plots data according to the relationship CO=HR H SV. This mapping can provide insight into the elderly circulation.
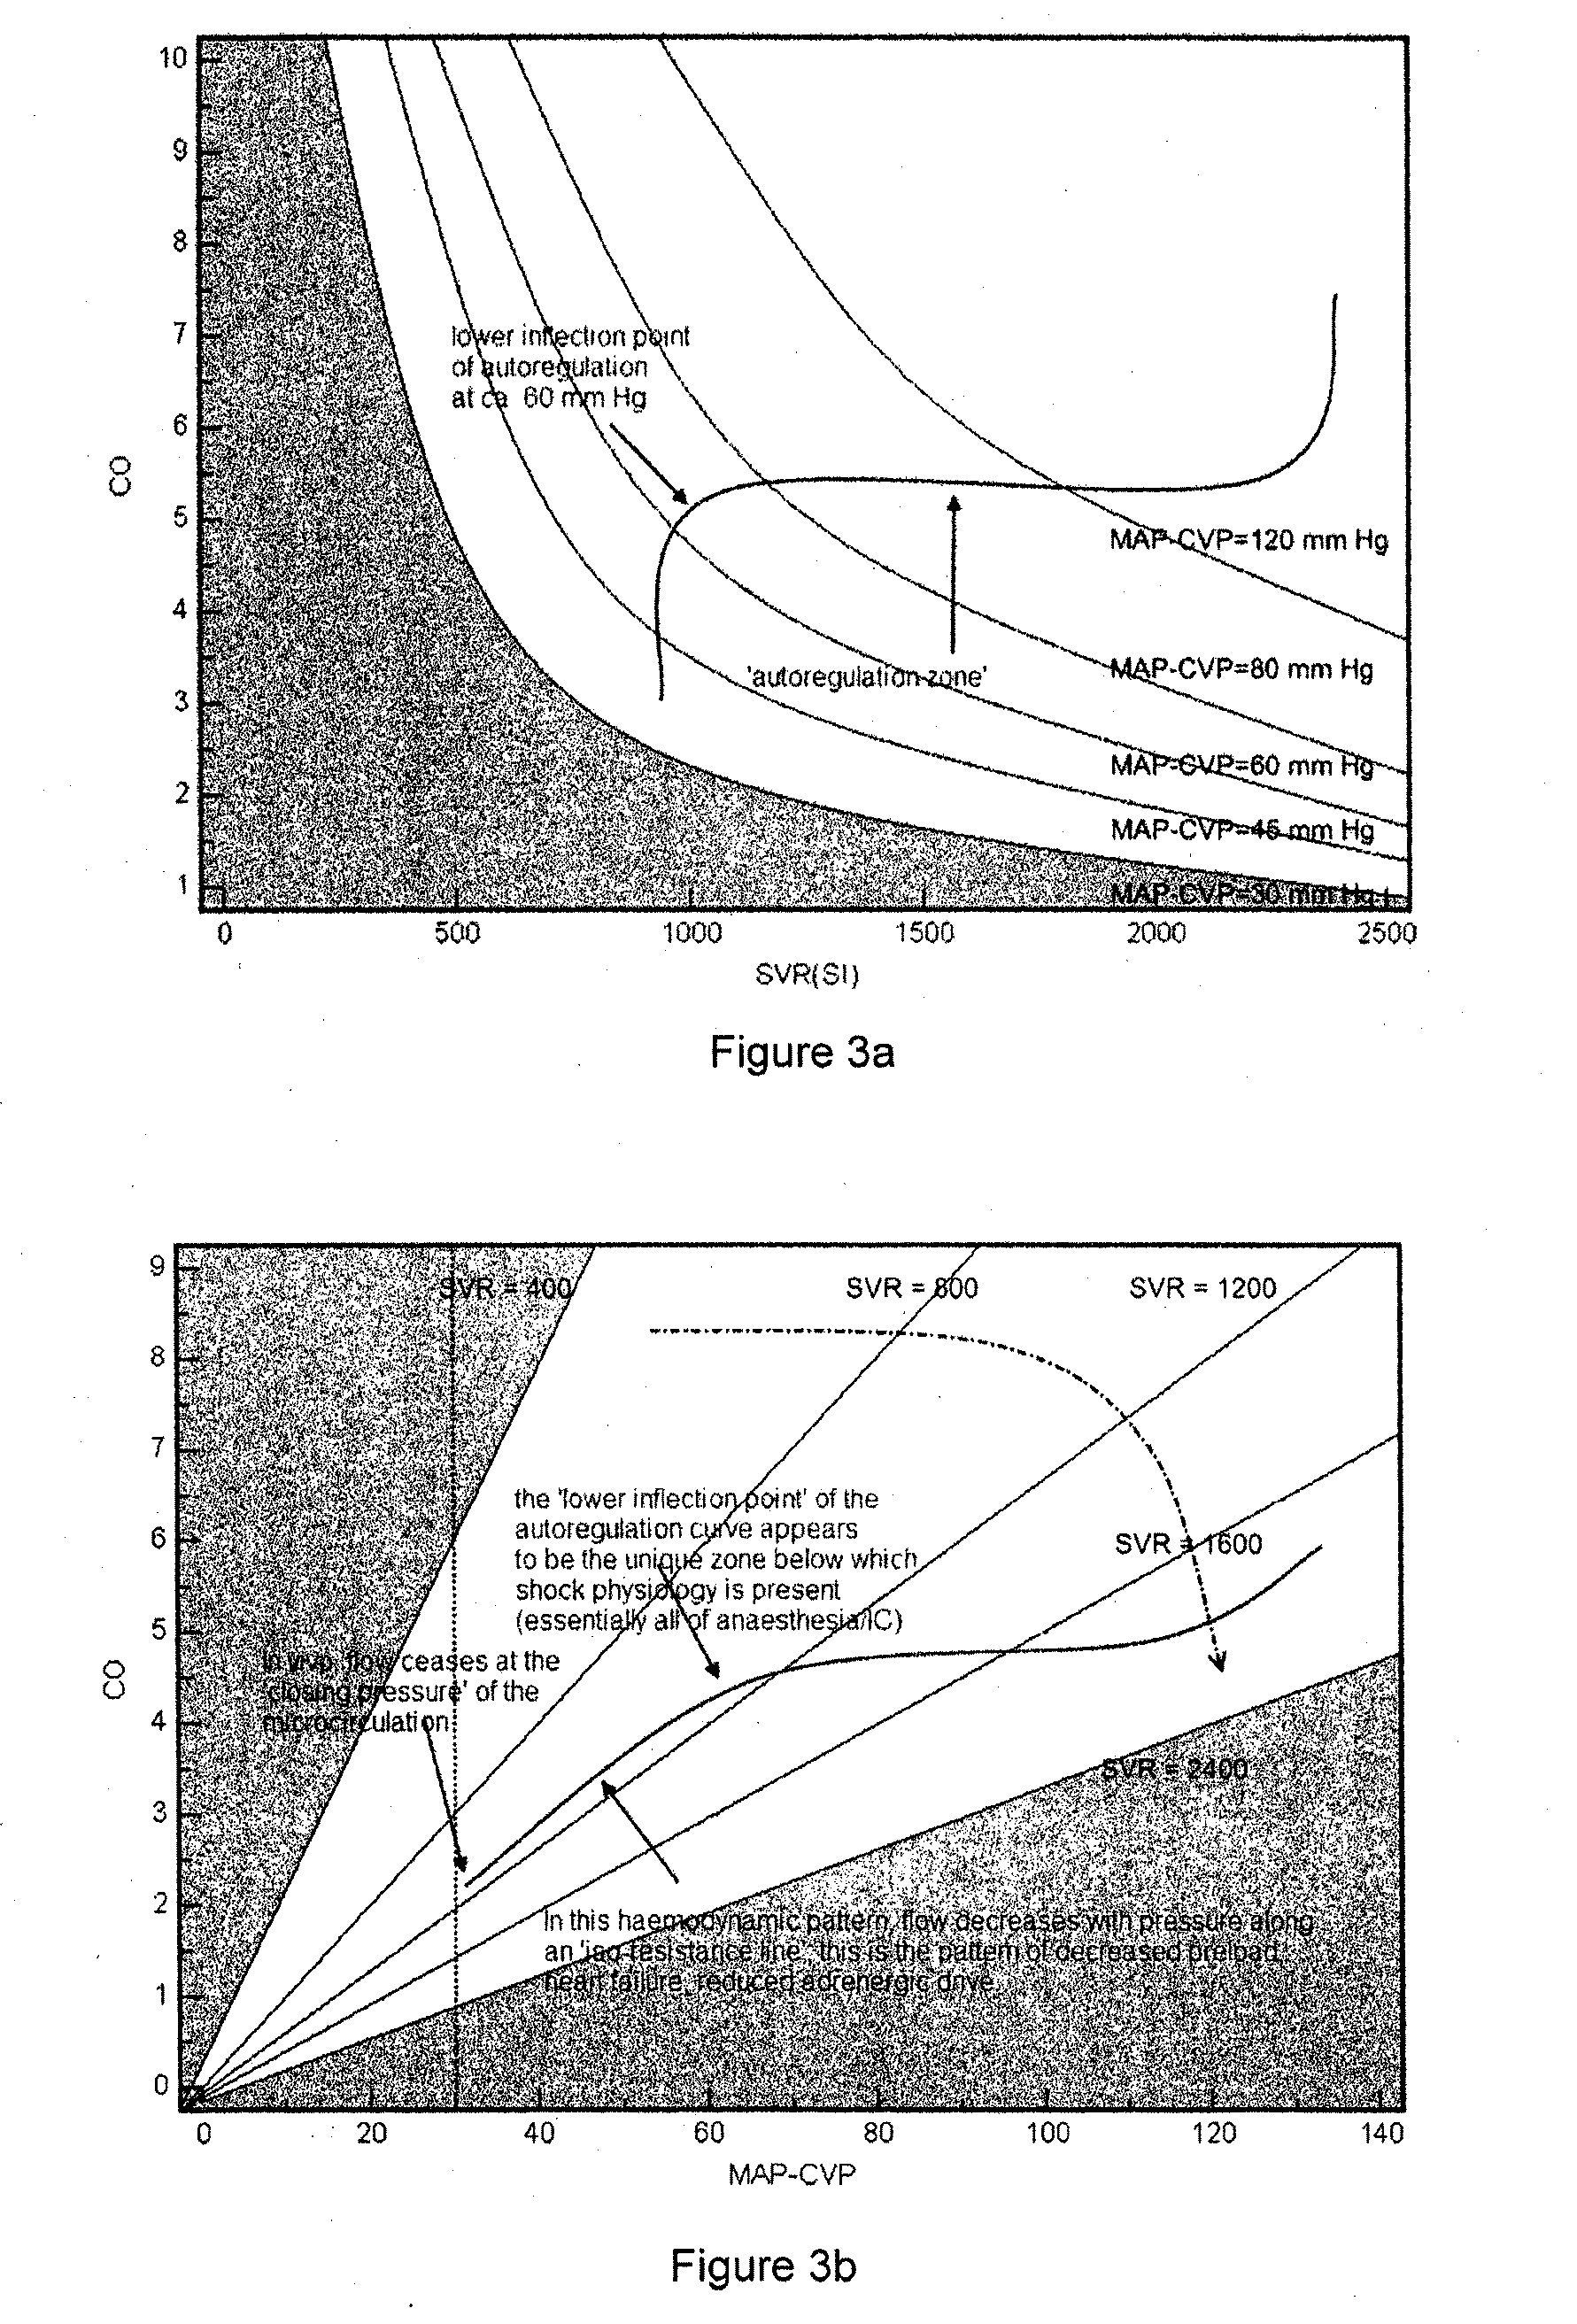
[0019] It is to be understood, however, that an autoregulation zone to which a subject's therapy may be directed during resuscitation need not be unique to that subject. For example, in ambulatory or emergency scenarios there may be no data available which represents that subject's haemodynamic performance when in a state of health at rest and so that subject's unique autoregulation zone may not be known. Thus, the autoregulation zone referred to during resuscitation may be obtained from mapped data collected from a range of representative subjects having similar demographic characterisation. Indeed this approach may achieve significant improvements in clinical outcomes. Demographic characterisation may include matching one or more of e.g. age, gender, body mass index, body surface area and the like.

Problems solved by technology

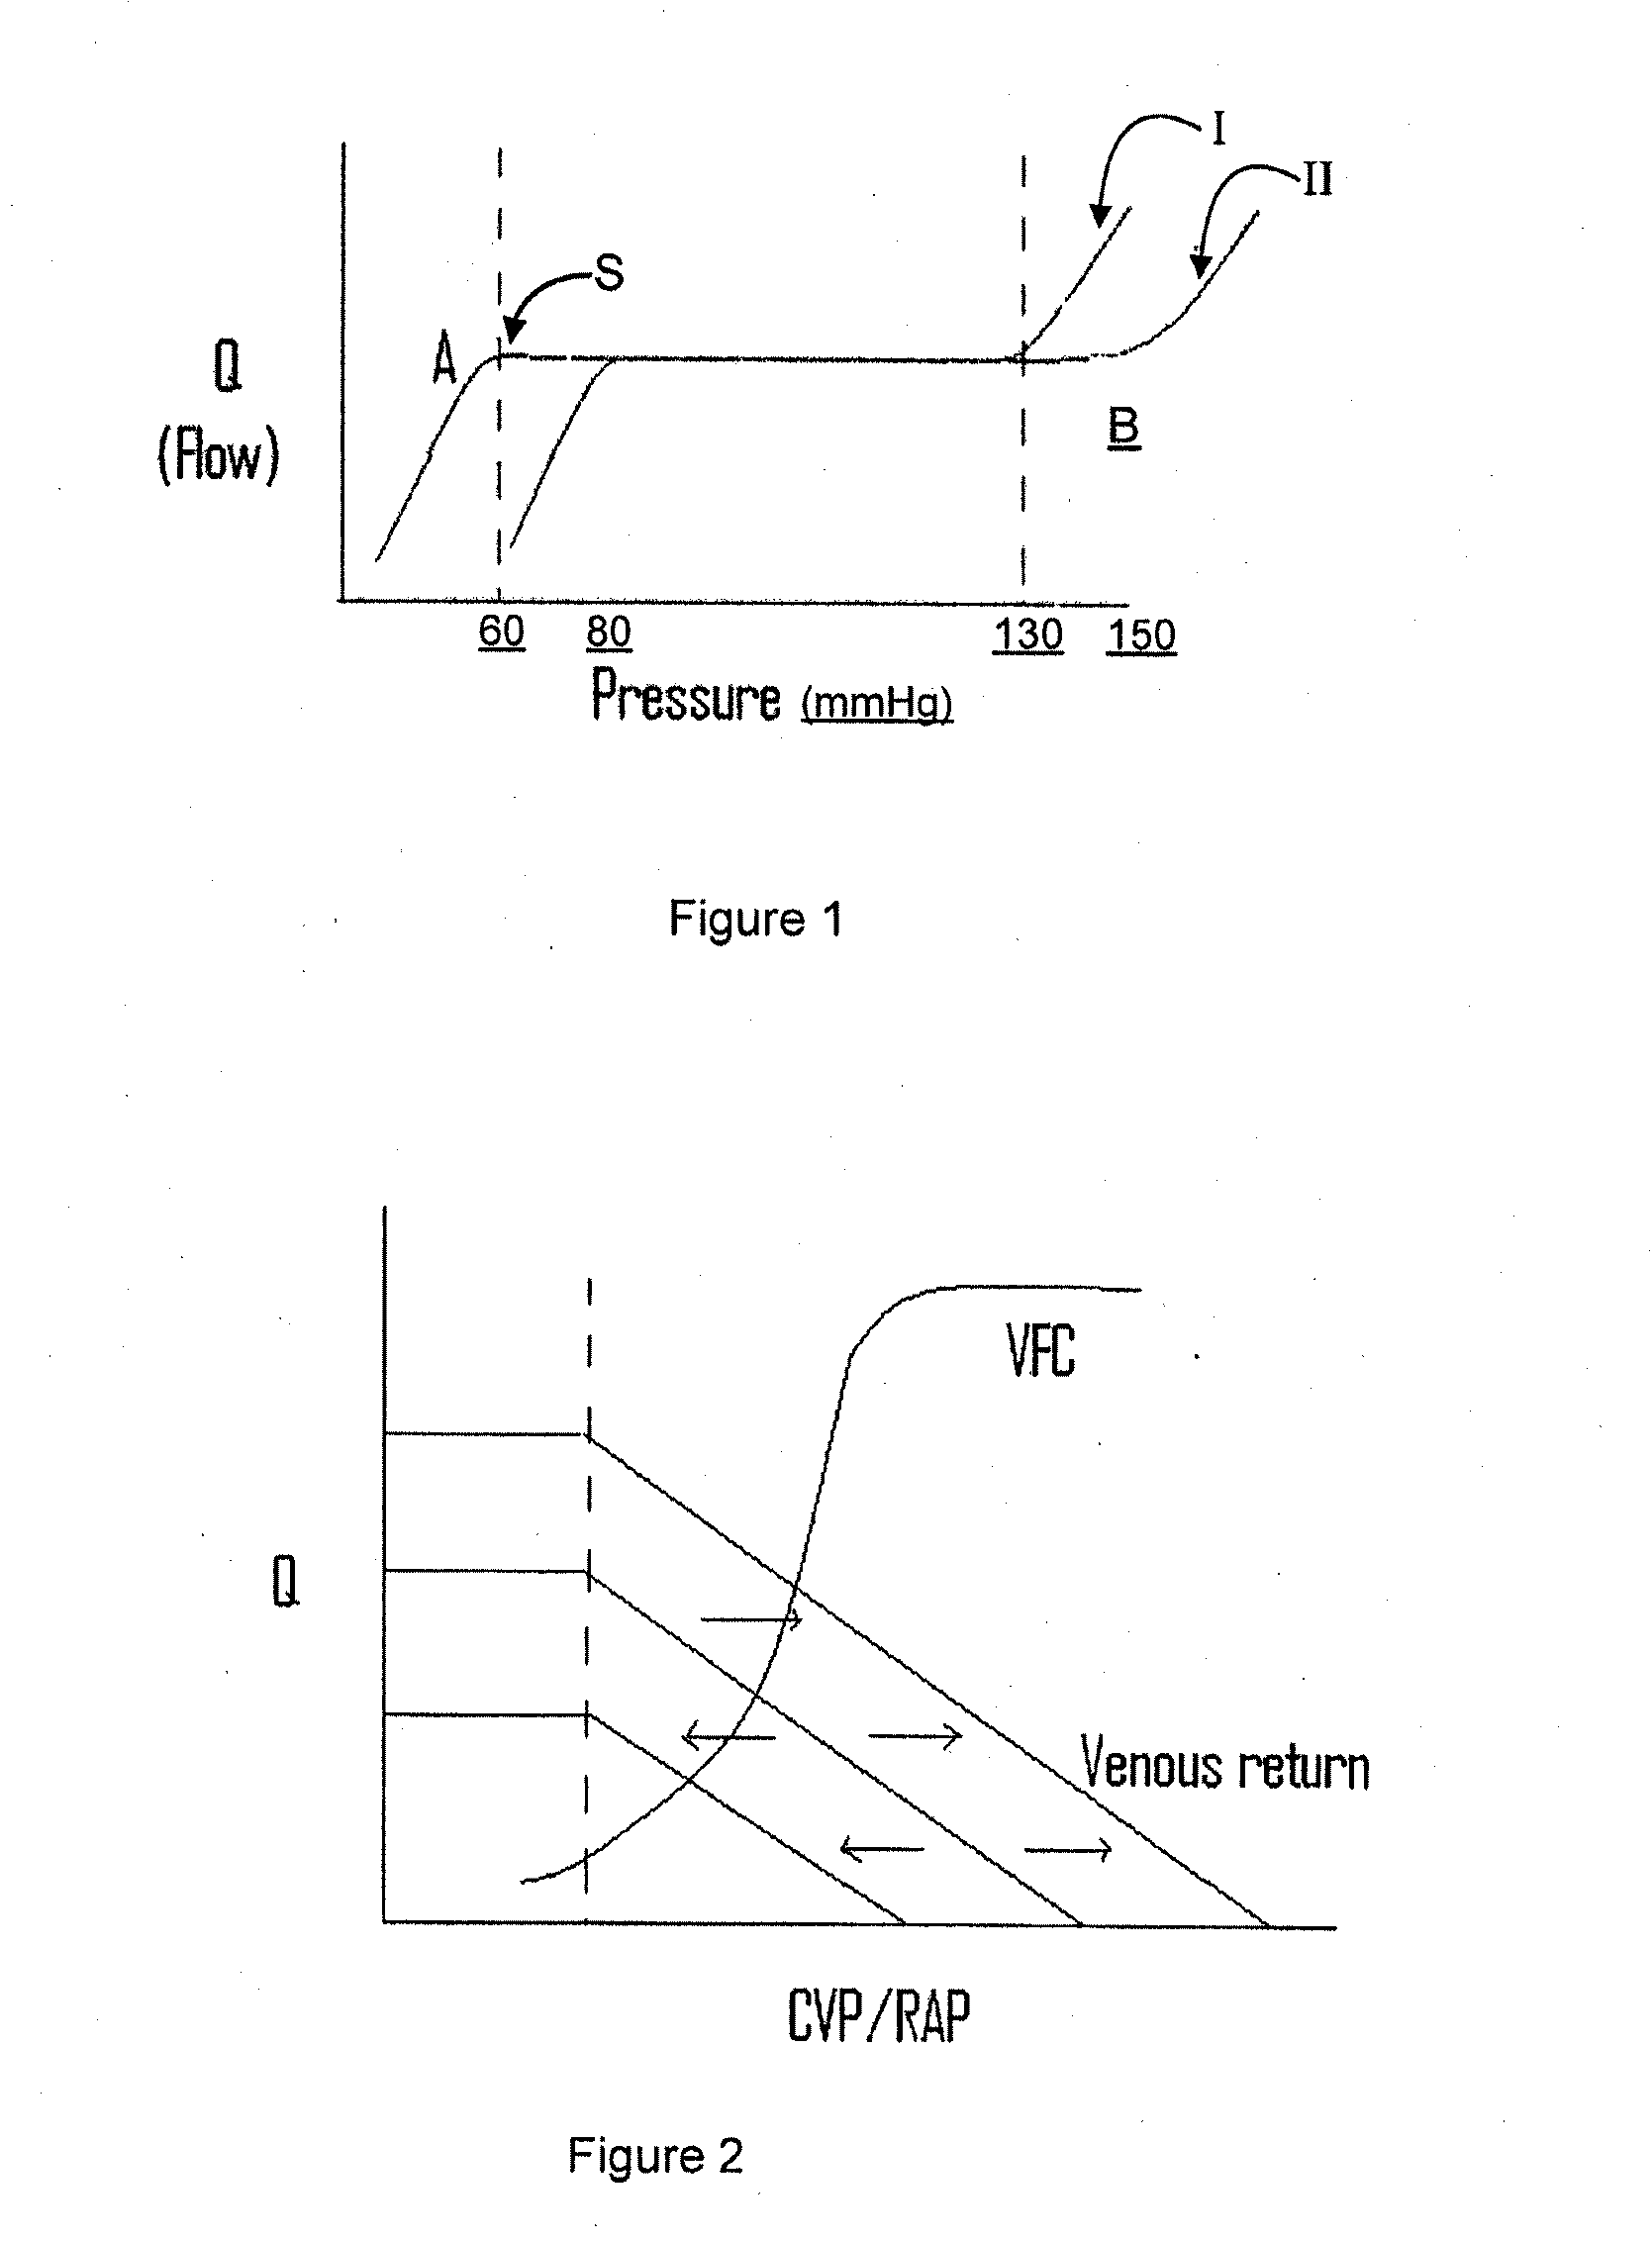
In a non-optimal state of haemodynamic performance and where autoregulation has become impaired, the subject will often enter a state of shock manifesting in low blood pressure.
Failure to administer appropriate therapy leads to worsening of the patient's condition, ultimately leading to heart failure.
Given the complexity and interaction of the organs of circulatory system, it is difficult for physicians to determine appropriate treatment when the subject's haemodynamic performance is being monitored using a variety of distinct variables viewed subjectively and individually.
The principal obstacle to improving outcomes arises from the lack of a consensus about the appropriate haemodynamic goals in patient management.
There is broad agreement that all patients require the same haemodynamic goals, but there is disagreement about which goals (in blood pressure, cardiac output, oxygenation) are critically important.
However, these curves do not describe the subject having high output hypotension (as occurs in sepsis).
The Guyton model devised in the 1970s relied on the study of small numbers of laboratory animals and now inferior measurement techniques to explain how blood pressure and cardiac output were controlled, in order to devise treatments.
Although the Guyton model intuitively matches clinical observations in a steady state situation, it does not adequately explain shock states and fails to account for physiological differences in e.g. the fit versus obese individual and the young versus elderly adult.
Further, its use has prompted unproven theories that have been applied in the clinical setting, perhaps to the detriment of patients being treated.

Method used


Image

  • Determining hemodynamic performance
  • Determining hemodynamic performance
  • Determining hemodynamic performance

Examples


example 1

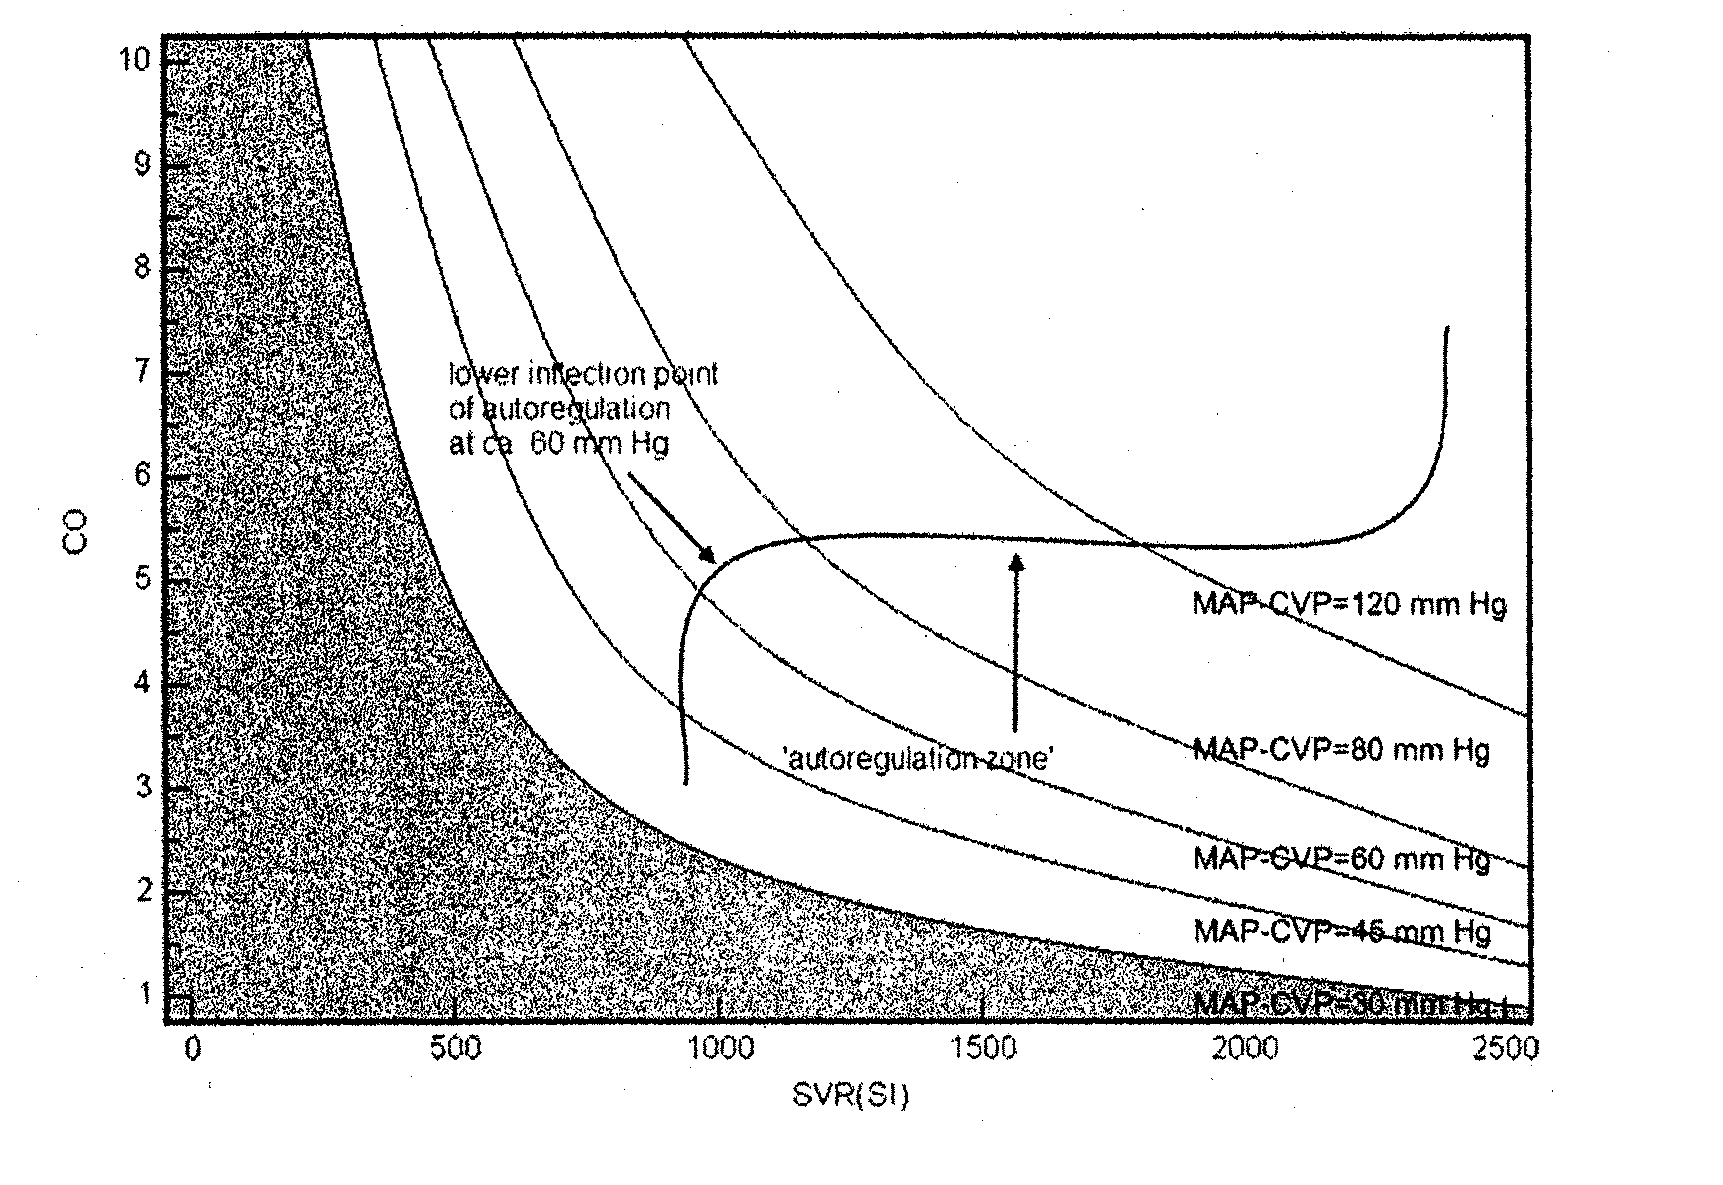
[0185] 80 year old male with dilated cardiomyopathy admitted with Pseudomonas, urinary tract infection (UTI) and worsening renal function. This patient illustrates sepsis with systolic dysfunction. The haemodynamic mapping in FIG. 9a shows that on admission the patient is in Circulatory failure (i.e. failure of the vascular pump) as is evident by the trend of day 1 data along the third isobar (compare with pattern represented in FIG. 8a). Because of a dilated cardiomyopathy, systolic dysfunction prevents the subject from maintaining the systemic perfusion pressure at his physiological autoregulation zone. As he responds to treatment, the mapping shows that his circulation returns to the zone of normal autoregulation (see day 3 and day 4 data) coinciding with normalization of renal function and cessation of inotropic support. The autoregulation zone when represented in flow-pressure format (iso-resistance nomogram in FIG. 9b) also shows progressive recovery over 3 days.

[0186] As dis...

example 2

[0187] 79 year old female undergoing right hemicolectomy and transabdominal oesophagectomy. Pre-induction CO at rest is 5.9 (the resting pre-induction CO is the physiologic autoregulation zone and is valuable in reading the ‘haemodynamic map’). The autoregulation zone in flow-pressure format (iso-resistance nomogram in FIG. 10a) shows a clear ‘heart failure’ pattern during anaesthesia in the operating theatre (OT data).

[0188] If this patient were in the normal autoregulation range, the data values in FIG. 10a would trend horizontally and to the right of the pre-induction value as shown by the solid line in FIGS. 6a-6d. However the data trends downward in FIG. 10a along an iso-resistance line corresponding to the representation of Type 3 shock as represented in the shock pattern of FIG. 6c. Knowing this value is also useful in interpreting the ‘isobar nomogram’ illustrated in FIG. 10b. Here, we see the patient data trending downward from the autoregulation zone again showing a patte...

example 3

[0189] Healthy 62 yr male with normal left ventricular function undergoing Coronary Bypass Surgery. The autoregulation zone in FIG. 11 a shows a ‘heart failure’ pattern pre-bypass and post-bypass (compare with Type 3 shock as represented in FIG. 6c), and an inflammatory pattern developing post-operation in ICU (compare with Type 1 shock as represented in FIG. 6a).

[0190] On arrival in intensive care, the patient is developing a systemic inflammatory response, so the pattern changes to a Type 1 (sepsis like) pattern. From the mapping in FIG. 10b, the autoregulation zone appears to be around 80 mmHg, at the inflection between the heart failure pattern and the inflammatory pattern. Postoperatively, this patient developed the usual inflammatory response pattern.

[0191] Two days after surgery, when he was hypotensive and oliguruc, the haemodynamic data was mapped again (FIG. 11b) and it unexpectedly showed a ‘heart failure’ pattern, even though the patient had no clinical signs of heart ...


PUM


Abstract

A method for determining haemodynamic performance in a human or animal subject comprises receiving at a processor data representing haemodynamic variables measured from the subject over time. The haemodynamic variables comprise at least two of Systemic Perfusion Pressure (SPP), Systemic Vascular Resistance (SVR), Cardiac Output (CO), Heart Rate (HR) and Stroke Volume (SV). The data are processed to produce a display signal for causing a display device to present a visual mapping relating the haemodynamic variables according to the relationship SPP=CO H SVR and the visual mapping is displayed on a display device. The visual mapping may be corrected Heart Rate (HR) or include a second mapping which facilitates an adjustment to take account of HR.

Description

CROSS-REFERENCE TO RELATED APPLICATIONS [0001] This application is a U.S. National Phase of International Application No. PCT / AU2010 / 000748, filed Jun. 17, 2010, designating the U.S. and published in English on Dec. 23, 2010 as WO 2010 / 1449961, which claims the benefit of U.S. Provisional Patent Application 61 / 218,053 filed Jun. 17, 2009.BACKGROUND OF THE INVENTION [0002] 1. Field of the Invention [0003] The present invention relates to a method, system and software product for determining haemodynamic performance in a human or animal subject. It relates particularly but not exclusively to a computer-implemented method, system and software product for generating a visual mapping of haemodynamic variables obtained from the subject, preferably in real time, for use in monitoring and improvement of therapeutic treatment. [0004] 2. Description of the Related Art [0005] In a normal state of health, the human or animal body system continuously maintains physiological balance. Even during ...

Claims


Application Information

Patent Timeline
Patent Type & Authority Applications(United States)
IPC IPC(8): A61B5/0205G06G7/58G16B45/00G16H15/00G16H40/60
CPCA61B5/0205A61B5/412G06F19/345A61B5/02028A61B5/743A61B5/024A61B5/029G06F19/3431A61B5/021G16H50/30G16H50/50G16H50/70G16H50/20G06F17/10G16B5/00G16B45/00G16H40/60G16H15/00
Inventor WOODFORD, STEPHEN
Owner HUMAN CHIMP PTY LTD
Learn More