
Utility consumption disaggregation using low sample rate smart meters

Active Publication Date: 2013-04-25
TERRACE LICENSING LLC
View PDF5 Cites 47 Cited by
  • Summary
  • Abstract
  • Description
  • Claims
  • Application Information

AI Technical Summary

Benefits of technology

The present invention provides techniques for analyzing utility consumption data, which can identify waste and inefficient use. By using low sample rates, relevant activity patterns can be discovered for understanding behavior and detecting anomalies. This is done by using minimal feature utility meters to provide sufficient data for disaggregation. Overall, the techniques can provide significant benefits in improving operational efficiency and customer service.

Problems solved by technology

Real-world deployments of smart meters are designed for utility billing and some basic analysis requirement, but many of them are not suitable for consumption disaggregation.
Smart meters transmit consumption readings using wireless protocols, which consume battery and have dependency on physical environments.
However, physical environment may still affect the data transmission.

Method used


Image

  • Utility consumption disaggregation using low sample rate smart meters
  • Utility consumption disaggregation using low sample rate smart meters
  • Utility consumption disaggregation using low sample rate smart meters

Examples


Embodiment Construction

[0036]Consumption activities disaggregated from meter readings may empower residents with appropriate insights to influence and shape their behavior. In addition, from disaggregated consumption, utility managers can design and assess conservation programs and prioritize energy-saving potential retrofits. A novel statistical framework is provided for disaggregation on coarse granular smart meter readings by modeling fixture characteristics, household behavior, and activity correlations.

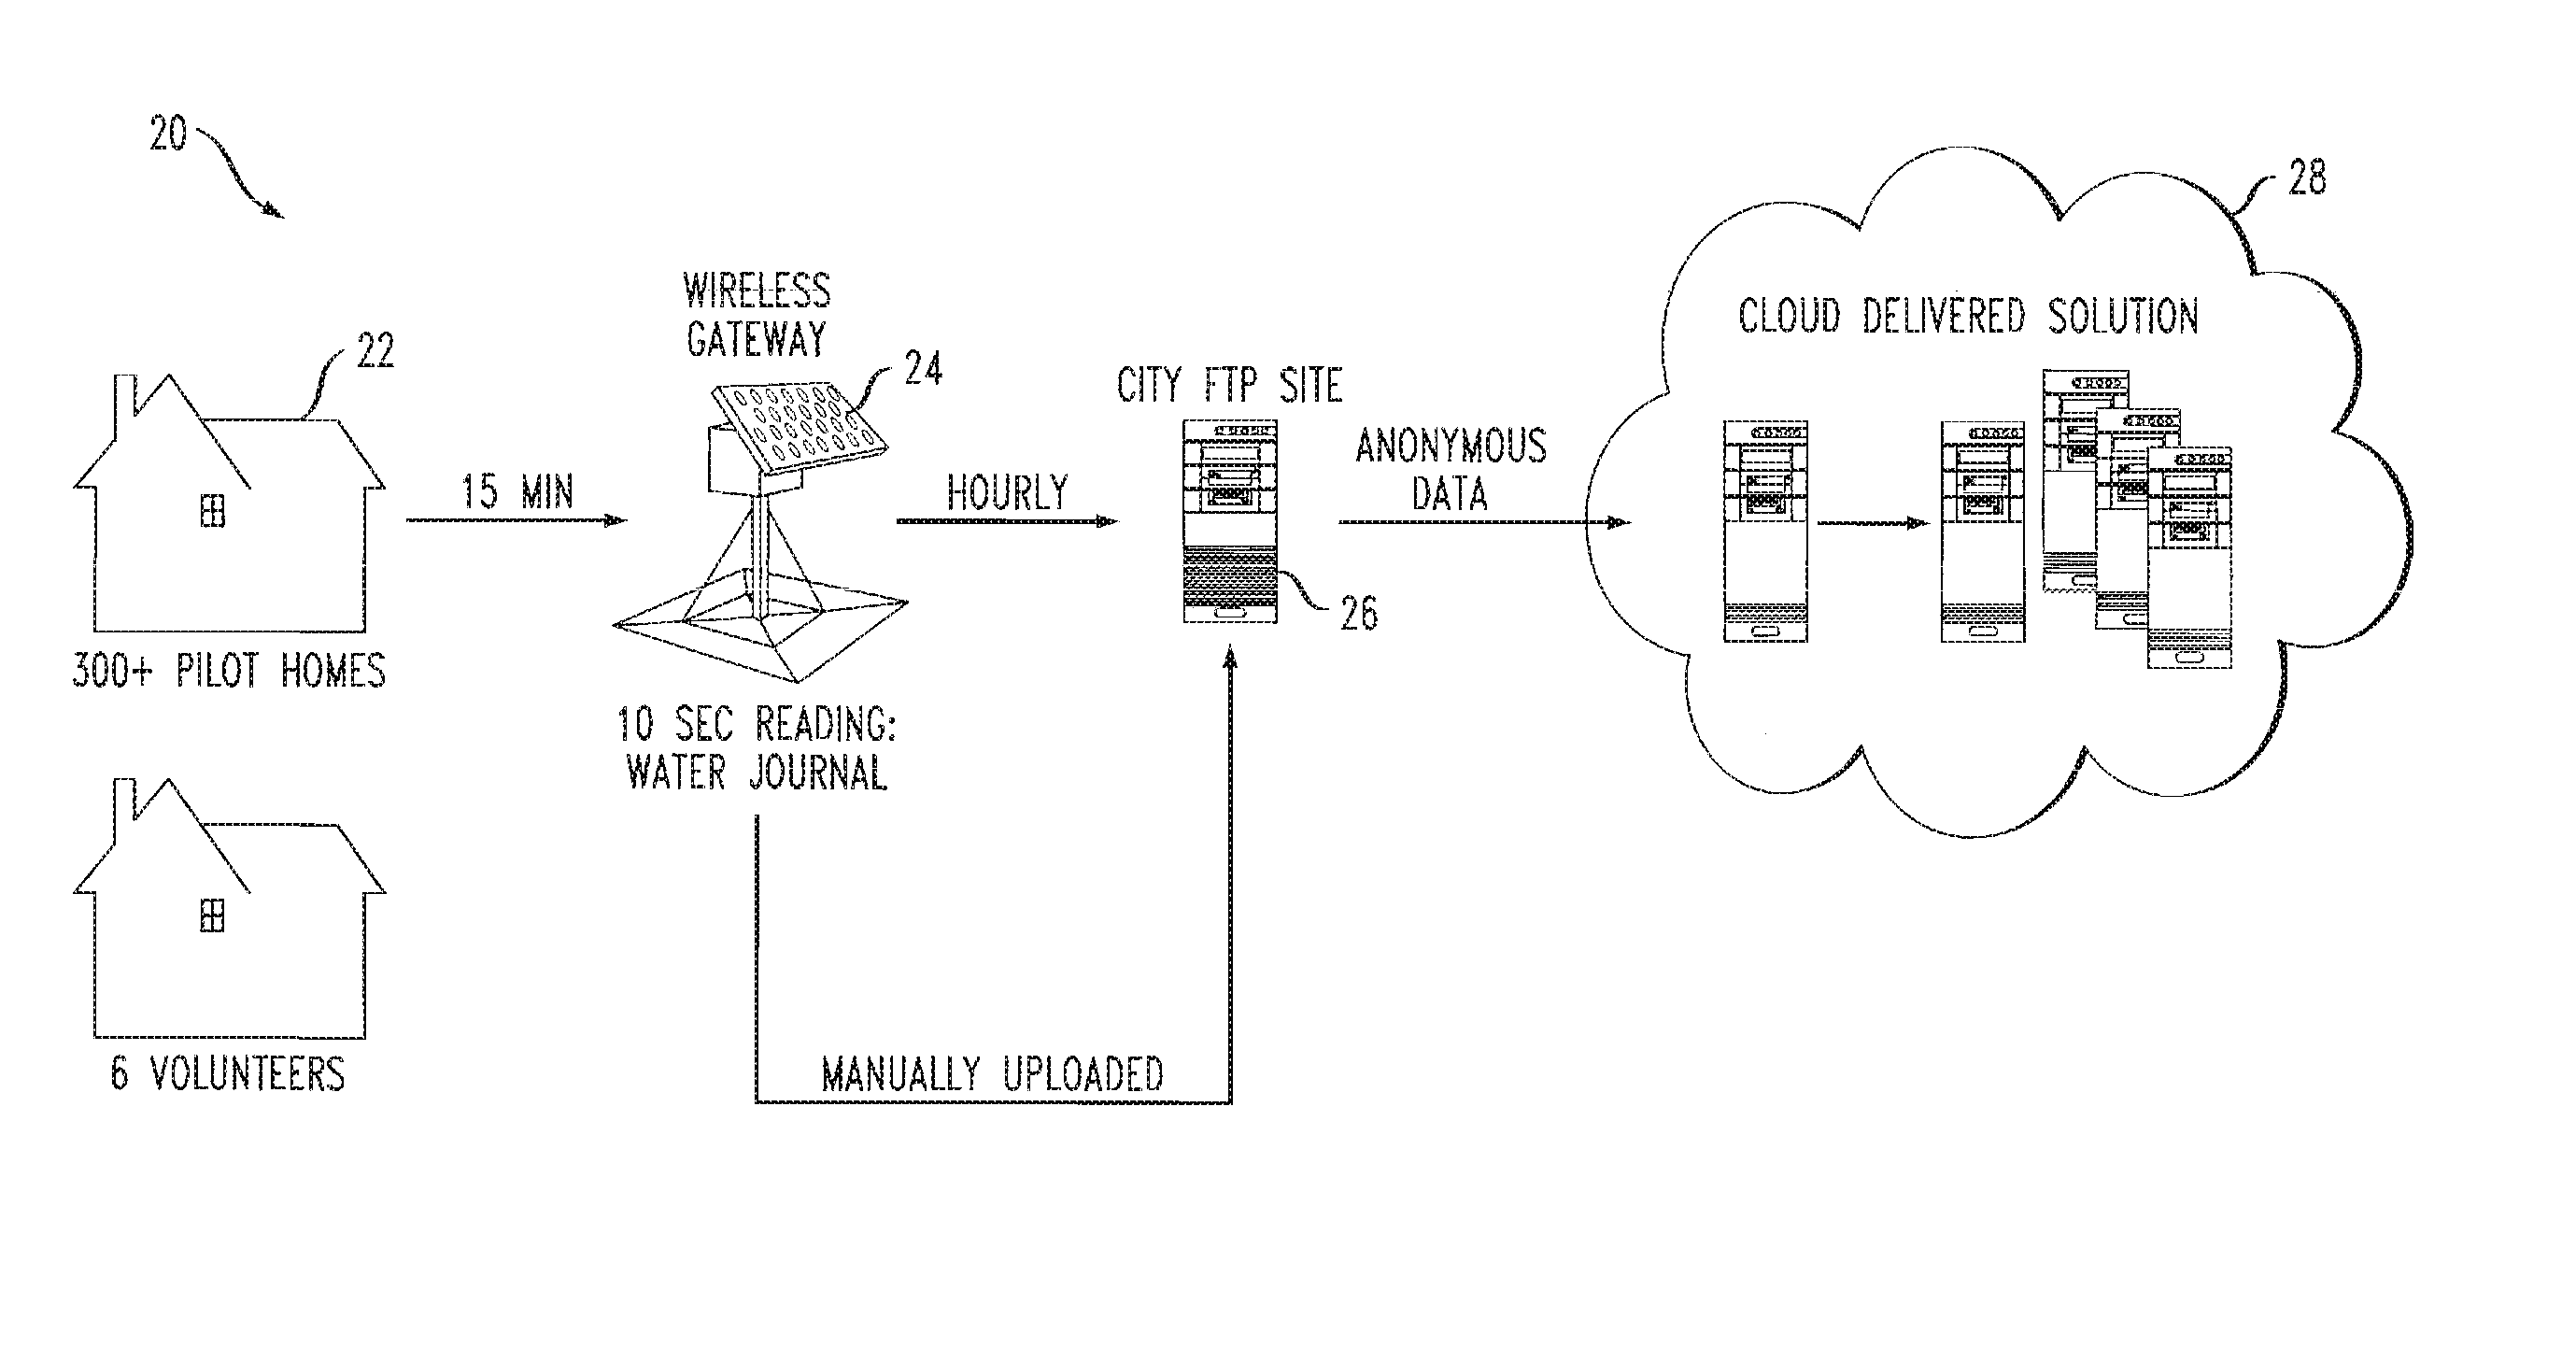
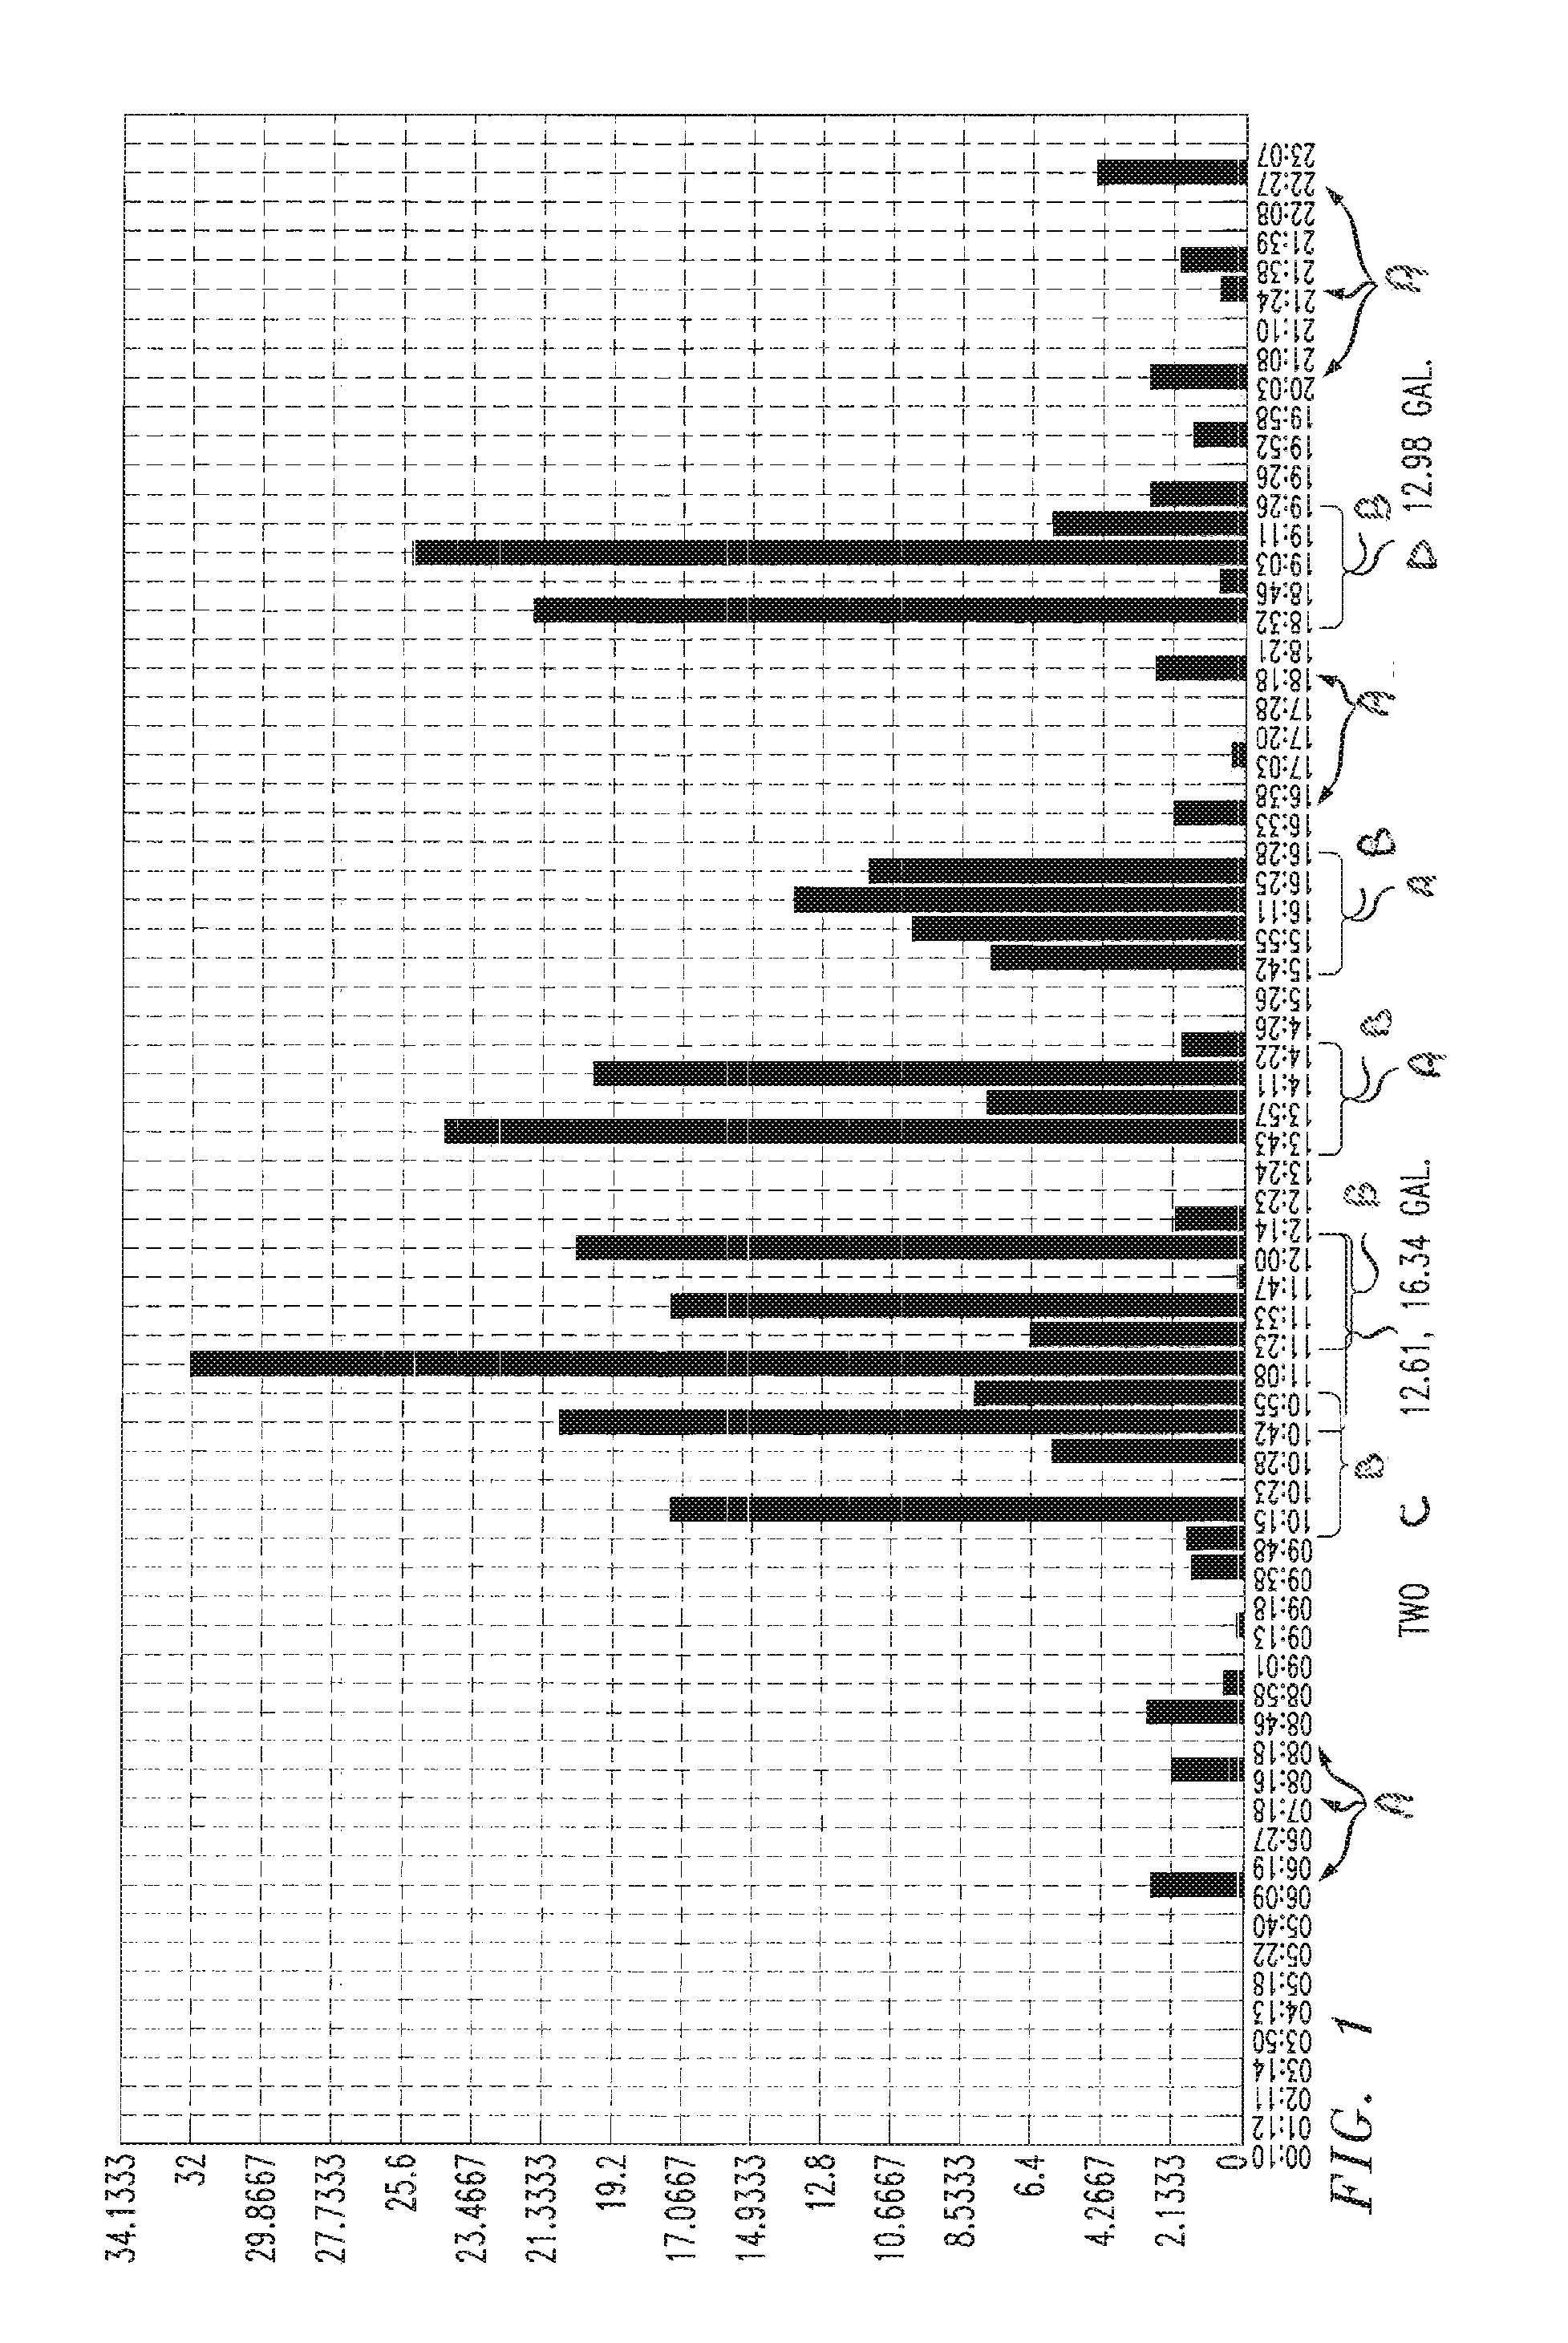
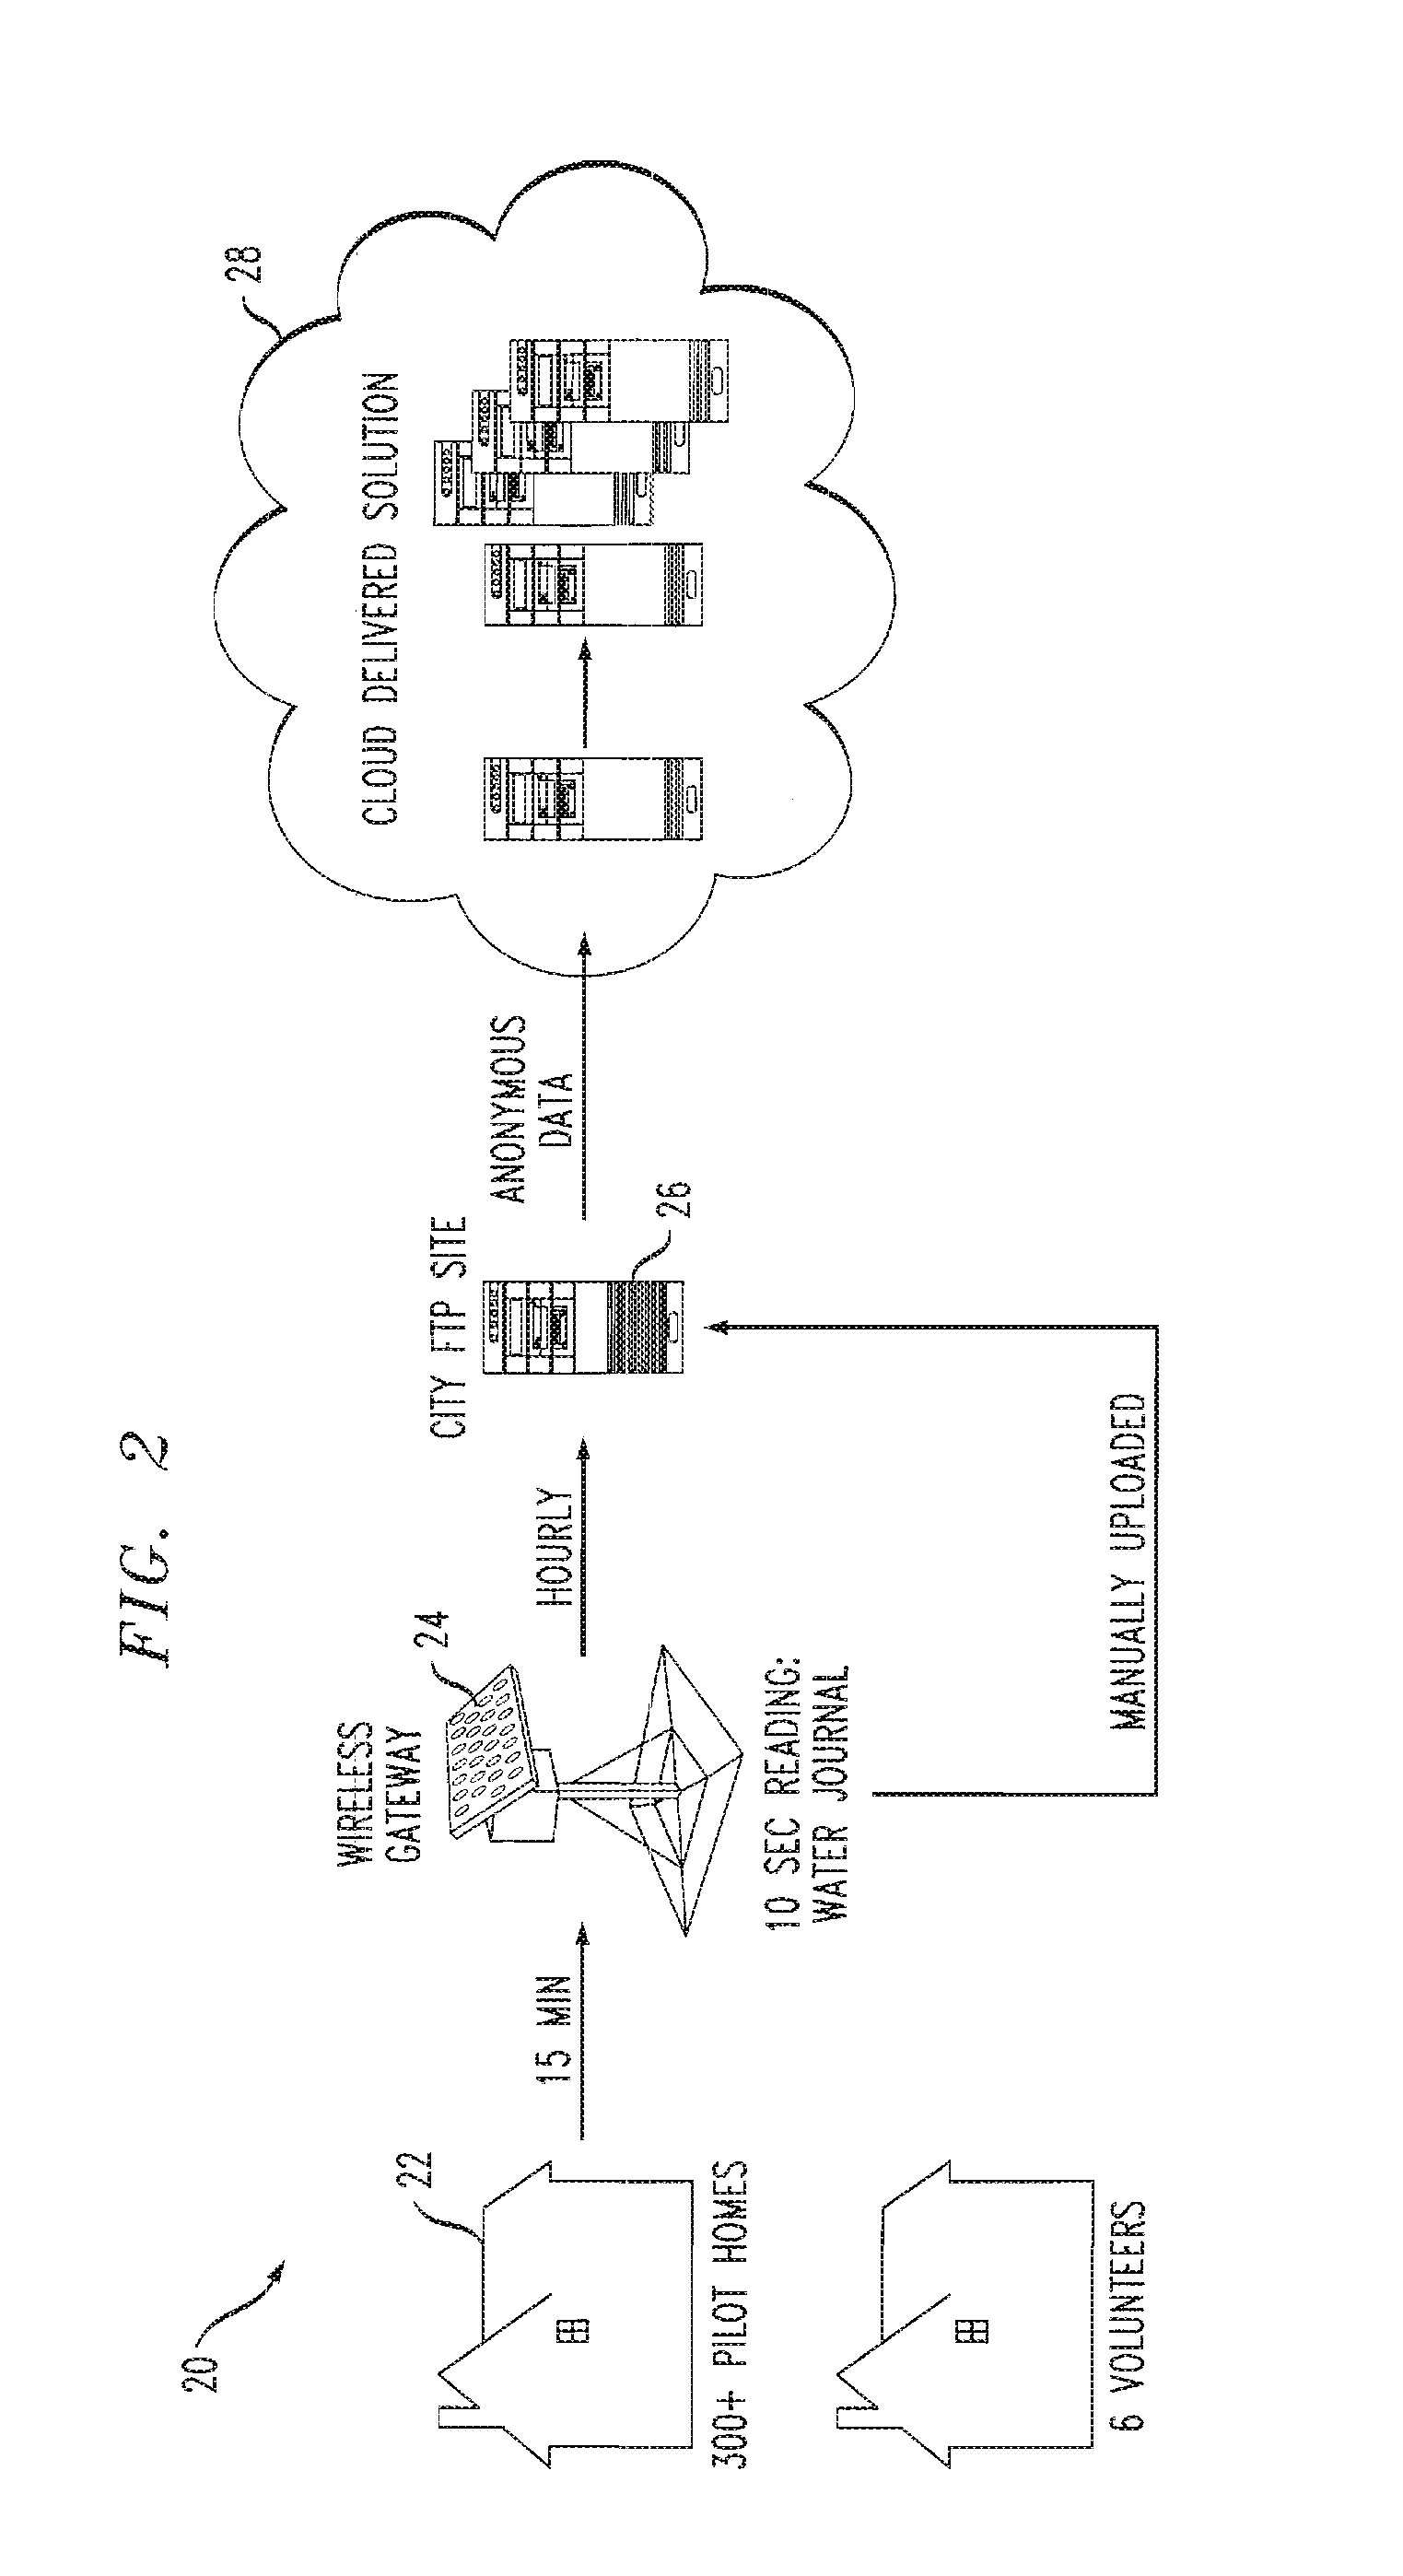
[0037]Consumption disaggregation as discussed herein addresses various conditions such as 1) parallel usage activities, e.g., a type A and C usages (see below) in the same 15 minute interval, 2) difficulty of aligning usage events temporally, e.g., a Type C use may appear in one or two intervals, 3) lack of features, i.e., only aggregated consumption and start time of each interval can be used to identify usage activity. An example of such water meter data and expected disaggregated activities is illus...


PUM


Abstract

Utility meter readings generated at low sampling rates are disaggregated to identify consumer usage activities. Time intervals between readings can include a plurality of consumer usage activities. By employing a model which recognizes associations among consumer usage activities, effective disaggregation is possible using only aggregated consumption data and interval start times. Consumers and utility managers can design and assess conservation programs based on the disaggregated consumption usage activities.

Description

CROSS REFERENCE TO RELATED APPLICATION[0001]This application claims the benefit of U.S. Provisional Application No. 61 / 525,310 filed on Aug. 19, 2011, the disclosure of which is incorporated by reference herein.FIELD OF THE INVENTION[0002]The present invention relates to activity analysis based on utility consumption, and more particularly to activity analysis based on low sample rate smart meters.BACKGROUND OF THE INVENTION[0003]Sustainability and design of sustainable technologies have become an important priority for cities given the unprecedented level of resource demand—water, energy, transit, healthcare, public safety—to most if not every service that makes a city attractive and desirable. At the same time, digital reification of the cyber-physical world has been possible with widespread penetration of sensing and monitoring technologies. These two important catalysts have fuelled significant interest and cross organizational collaboration among researchers, industries, urban ...

Claims


Application Information

Patent Timeline
IPC IPC(8): G06Q50/06
CPCG06Q50/06
Inventor DAI, JINGCHEN, FENGNAPHADE, MILIND R.SAHU, SAMBIT
Owner TERRACE LICENSING LLC
Learn More