System for Multivariate Climate Change Forecasting With Uncertainty Quantification

a multi-variate climate change and uncertainty quantification technology, applied in the field of multi-variate climate change forecasting with uncertainty quantification, can solve the problems of large uncertainty in extremes, increase in precipitation extreme severity and consequences, and general poorly characterized effects

Active Publication Date: 2017-06-22
NORTHEASTERN UNIV
View PDF9 Cites 34 Cited by
  • Summary
  • Abstract
  • Description
  • Claims
  • Application Information

AI Technical Summary

Benefits of technology

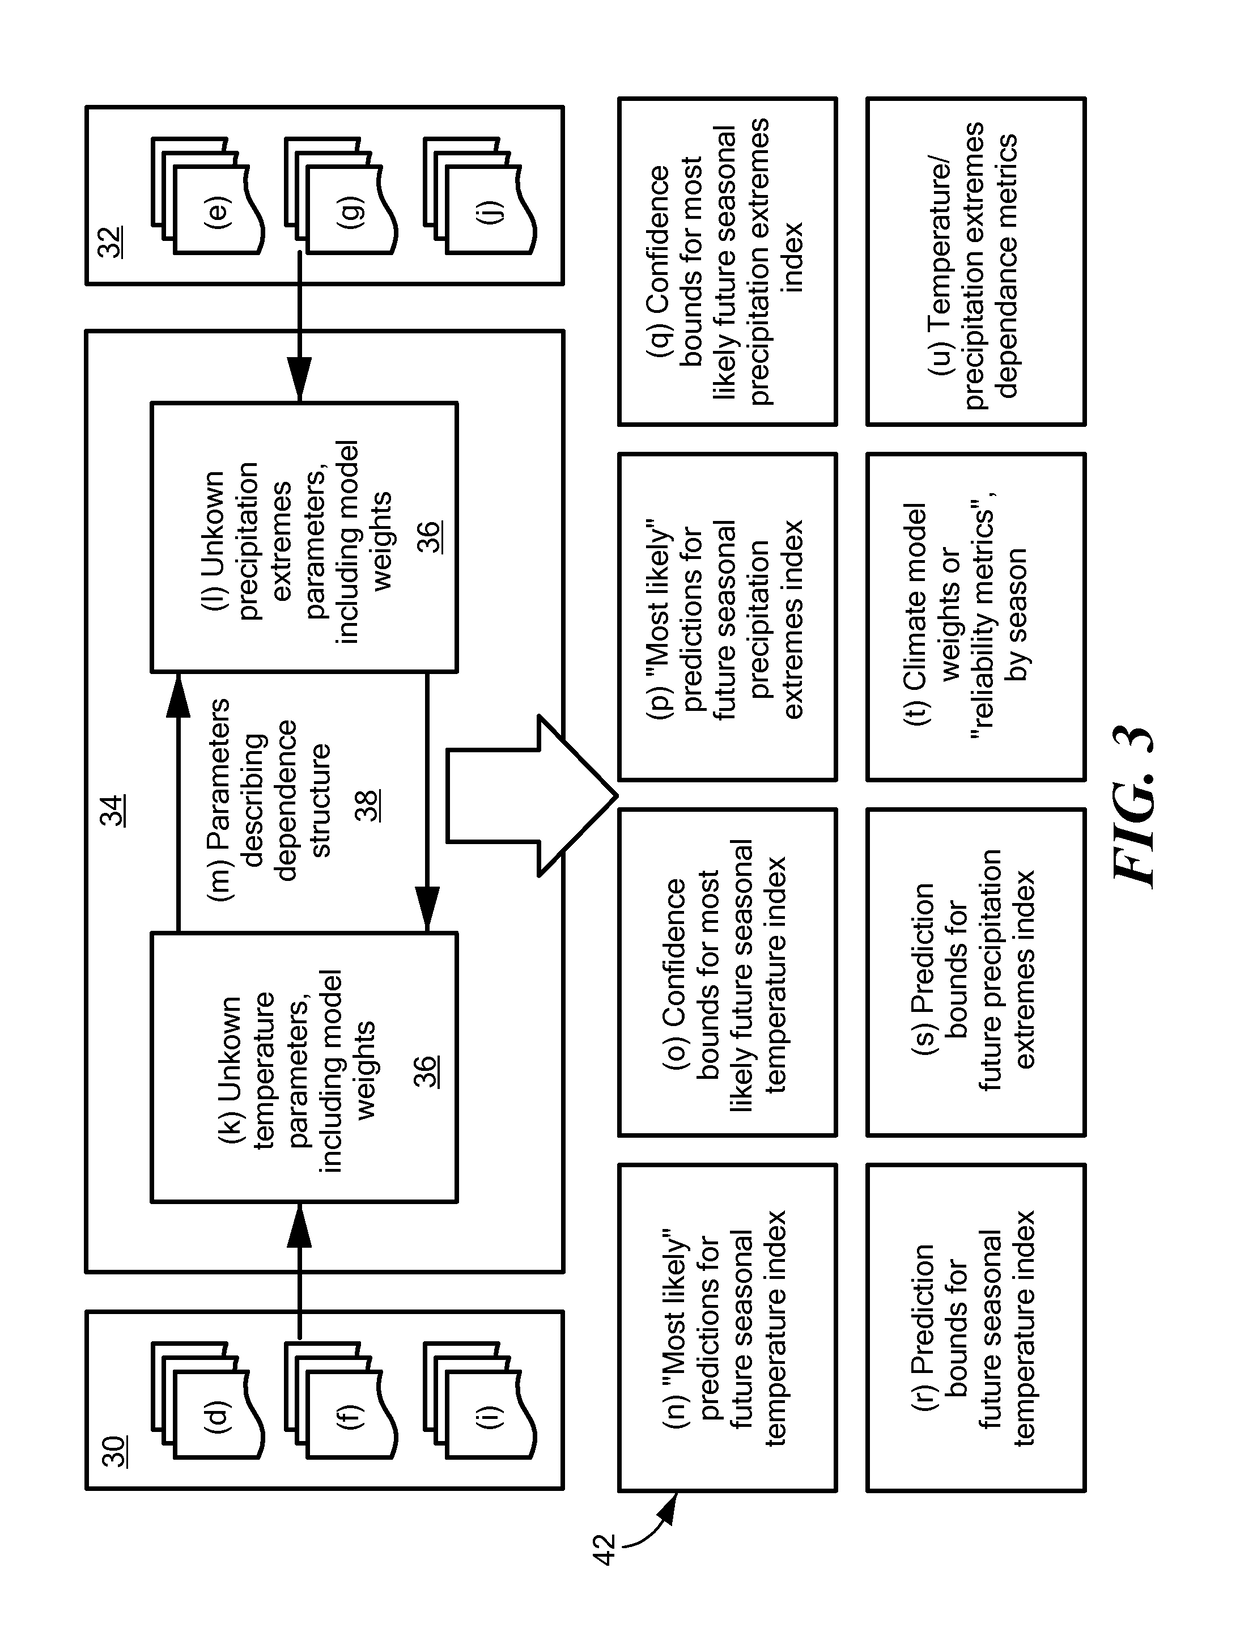
[0004]The present system and method are able to more rigorously quantify the uncertainty in extreme climate events and climate indices to provide stakeholders with best and worst case bounds in metrics used for impacts assessment, hazards planning, and engineering design. The system and method use a Bayesian model that combines and iteratively weights archived data ou...

Problems solved by technology

As the atmosphere warms, on average, atmospheric moisture holding capacity increases in many regions, which can increase the severity of precipitation extremes and consequences like flooding.
At the regional and loca...

Method used


Image

  • System for Multivariate Climate Change Forecasting With Uncertainty Quantification
  • System for Multivariate Climate Change Forecasting With Uncertainty Quantification
  • System for Multivariate Climate Change Forecasting With Uncertainty Quantification

Examples


example

[0106]Results using out-of-sample observations indicate that the model produces robust probability distributions for all considered quantiles of extremes and is more reliable than the equally weighted multi-model average projections that have often been considered to be the best choice in prior art literature and climate impact assessments reports.

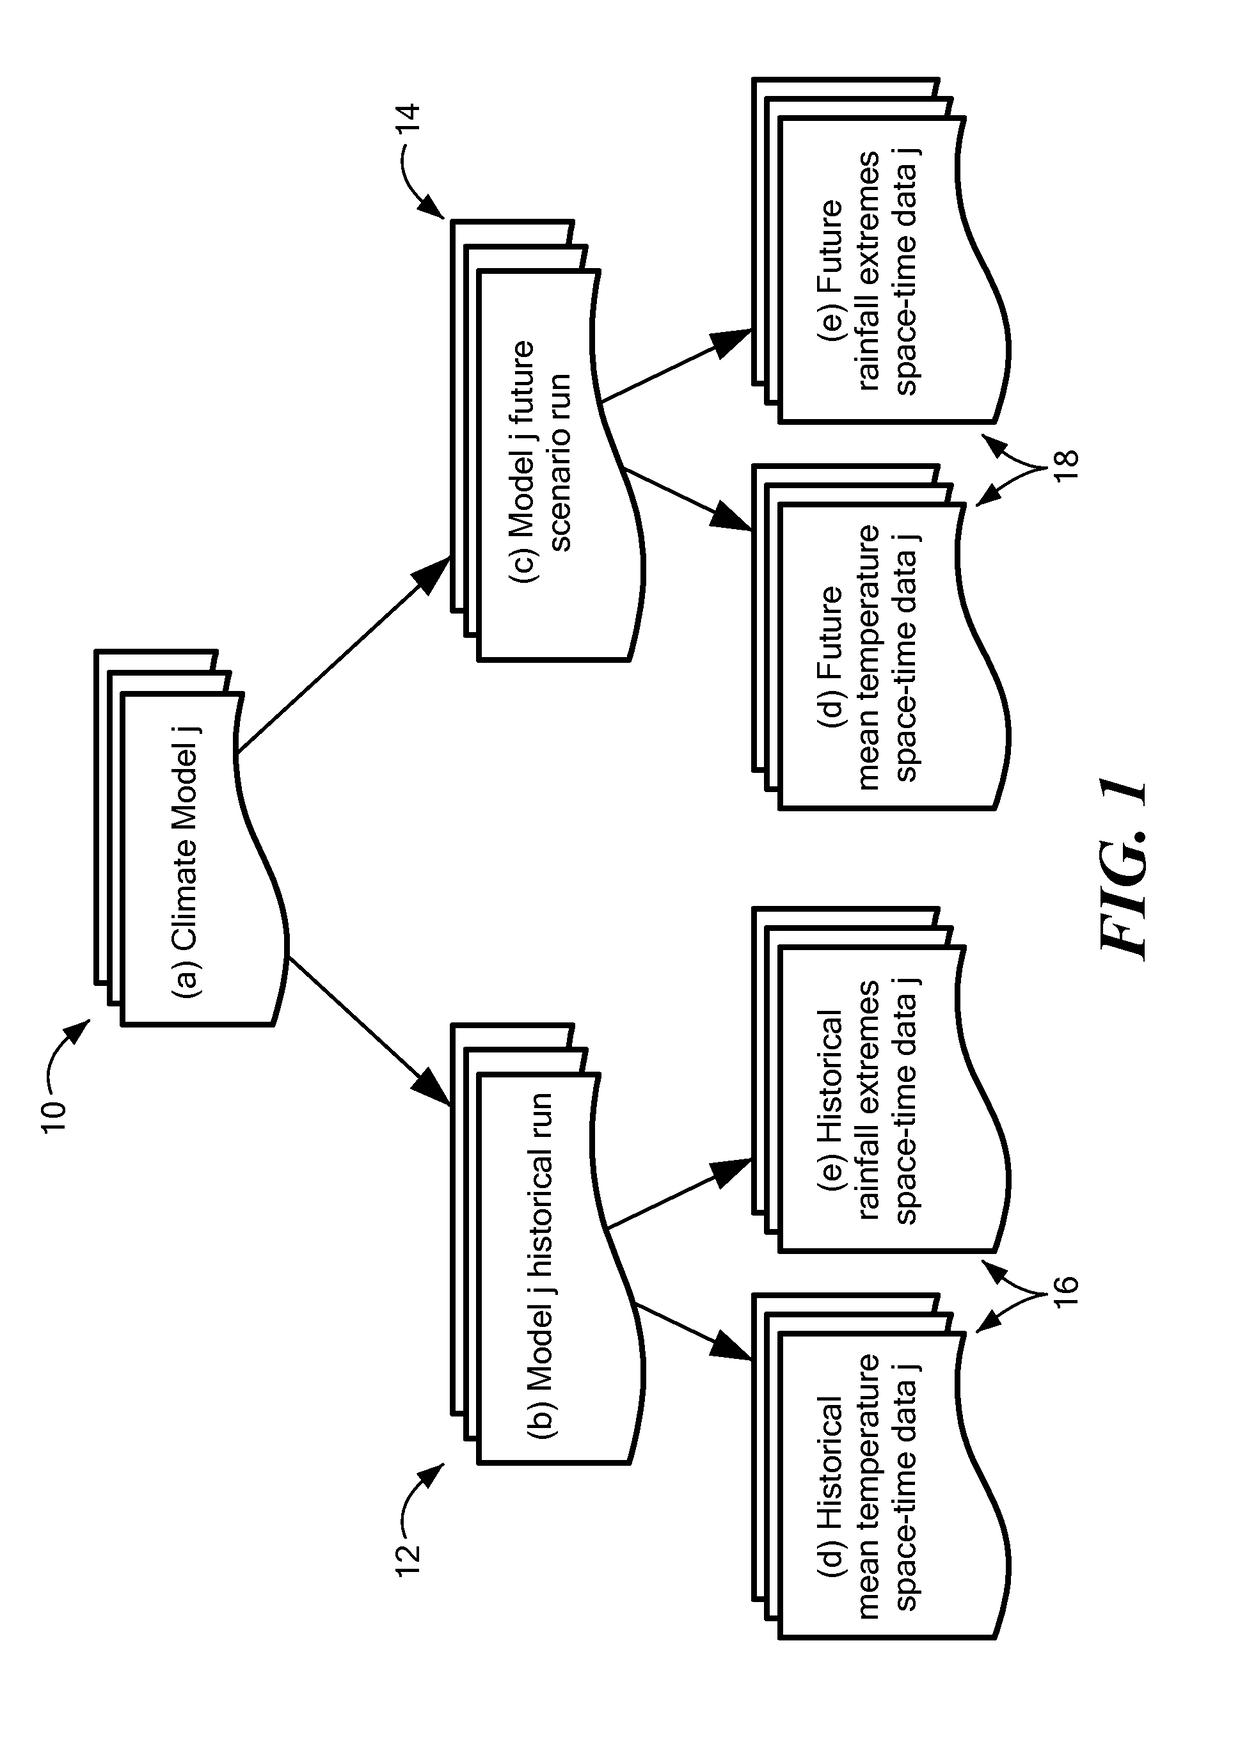
[0107]Reference is made to FIGS. 5-11. FIGS. 5-9 depict data, using 16 Global Climate Models (GCMs), from one watershed region, in Missouri (“Missouri Region”, as defined by the United States Geological Survey's Watershed Boundary Dataset, Hydrologic Unit 2. FIGS. 10-11 show analytics over 18 watersheds that encompass the continental U.S., to obtain a meta-analysis perspective.

[0108]FIG. 5 depicts one month—September—for the years 1950-1974. (For clarity of depicting the data in FIGS. 5, 6, and 7, only a single month is shown; it will be appreciated that similar graphs are generated for each month, January to December, for the same time pe...


PUM


Abstract

A system and method for providing multivariate climate change forecasting are provided that obtain, from one or more climate model datasets, simulated historical and future climate model data, and from one or more climate observational datasets, historical observed climate data. A statistical distribution, using a Bayesian model, is provided of extremes or climate indices for one or more variable climate features using the simulated climate model data and the observed climate data. One or more metrics are determined, including a prediction of a future climate variable for a determined future time period, a confidence bound of the prediction of the future climate variable for the determined future time period, and a prediction bound for the future climate variable for the determined future time period. The metrics can be transmitted to a variety of applications in a variety of formats.

Description

CROSS-REFERENCE TO RELATED APPLICATIONS[0001]This application claims the benefit under 35 U.S.C. §119(e) of U.S. Provisional Patent Application No. 61 / 971,932, filed Mar. 28, 2014, entitled System for Multivariate Climate Change Forecasting With Uncertainty Quantification, and U.S. Provisional Patent Application No. 61 / 972,919, filed Mar. 31, 2014, entitled System for Multivariate Climate Change Forecasting With Uncertainty Quantification, the disclosures of which are incorporated by reference herein in their entirety.STATEMENT REGARDING FEDERALLY SPONSORED RESEARCH OR DEVELOPMENT[0002]This invention was made with government support under grant No. 1029711, awarded by the National Science Foundation. The government has certain rights in the invention.BACKGROUND[0003]Physical theory and growing evidence suggests that under greenhouse gas driven global warming scenarios, extreme weather events will often become more intense. Heavy, regional precipitation events are among the principal...

Claims


Application Information

Patent Timeline
IPC IPC(8): G01W1/10G01W1/06
CPCG01W1/06G01W1/10Y02A90/10G06N7/08G06N7/01
Inventor KODRA, EVANGANGULY, AUROOP R.
Owner NORTHEASTERN UNIV
Why Eureka
Try Eureka