
Computer-Assisted Tumor Response Assessment and Evaluation of the Vascular Tumor Burden

a computer-aided tumor and tumor burden technology, applied in image enhancement, instruments, applications, etc., can solve the problems of inability to reliably reproduce the effects of some newer anti-cancer treatment therapies with the current tumor response criteria, inconsistent known tumor response criteria, and difficult implementation, so as to accurately assess the tumor response and effectively monitor the response

Active Publication Date: 2018-02-15
AI METRICS LLC
View PDF0 Cites 4 Cited by
  • Summary
  • Abstract
  • Description
  • Claims
  • Application Information

AI Technical Summary

Benefits of technology

This approach enables reliable and direct quantification of vascular tumor burden changes, effectively monitoring responses to anti-angiogenic therapies and predicting long-term outcomes, while minimizing errors and variability in tumor response classification.

Problems solved by technology

However, there are issues with the known tumor response criteria being inconsistent, difficult to implement, narrowly tailored, expensive, and not reliably reproducible across multiple different institutions and readers.
Further, the effects of some newer anti-cancer treatment therapies are difficult to determine with the current tumor response criteria.
Accordingly, there are a number of disadvantages in the art of data collection and management that can be addressed.

Method used


Image

  • Computer-Assisted Tumor Response Assessment and Evaluation of the Vascular Tumor Burden
  • Computer-Assisted Tumor Response Assessment and Evaluation of the Vascular Tumor Burden
  • Computer-Assisted Tumor Response Assessment and Evaluation of the Vascular Tumor Burden

Examples


example 1

[0139]The following Table 1 lists abbreviations / acronyms used in any of Tables 2-4 together with their meaning.

TABLE 1List of Acronyms / AbbreviationsAcronym / AbbreviationMeaningRECISTResponse Evaluation Criteria inSolid TumorsPFSProgression-Free SurvivalOSOverall SurvivalCIConfidence IntervalPRPartial ResponseSDStable DiseasePDProgressive DiseaseHRHazard RatioFRFavorable ResponseIRIntermediate ResponseURUnfavorable Response

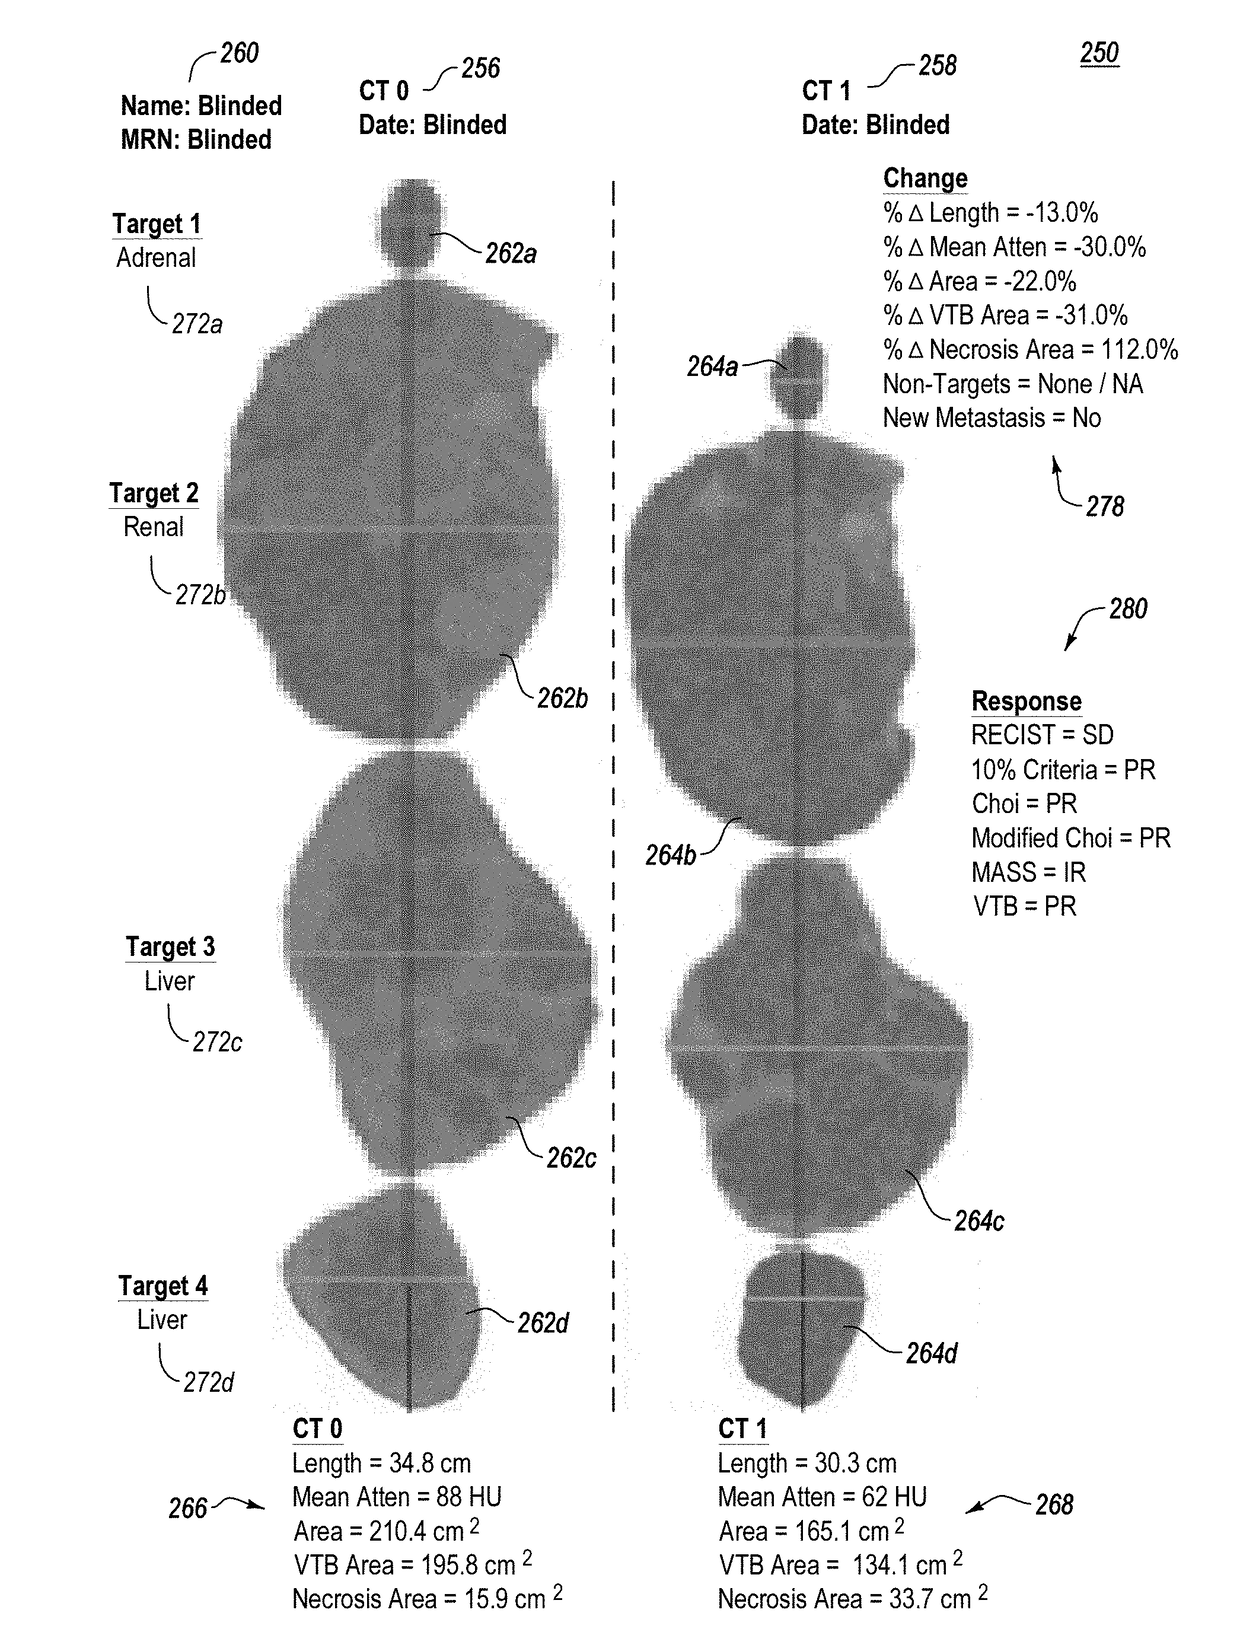
[0140]Tables 2-4 include experimental and / or clinical data described immediately below and within FIG. 11. Particularly, the disclosed hazard ratio (HR) is the ratio of the hazard rates corresponding to the responder and nonresponder groups. The hazard rates indicate the likelihood of progression-free survival (PFS) of the entire group. The VTB Criteria has a HR of 5.7, indicating that the nonresponders were 5.7 times more likely to progress than the responders. In Table 2, the p-values are calculated with respect to the indicated comparison.

[0141]In patients with m...

example 2

[0142]In a large inter-observer analysis study with 11 different readers from 10 different institutions assessing cross-sectional images from 20 patients with metastatic renal cell carcinoma treated with AAG therapy, mean tumor assessment time with computer-assisted tumor response assessment, as disclosed herein, and measurement of the VTB was 50% faster than a routine image viewer and manual data entry (7 vs. 14 min, p<0.001), and patient-level errors were significantly less common (0% vs. 31%, p<0.001). Using the computer-assisted tumor response assessment as disclosed herein, inter-observer agreement was very good for measuring the VTB vs. good for measuring tumor length (intra-class correlation coefficient=0.96 vs. 0.68,p=0.021). These findings suggest that tumor response assessment using the computer-assisted tumor response assessment disclosed herein and measurement of the vascular tumor burden is significantly faster, associated with a marked reduction in errors, and associat...


PUM


Abstract

A computerized method for determining an objective tumor response to an anti-cancer therapy using cross-sectional images includes receiving a cross-sectional image of digital medical image data, identifying a set of pixels within the cross-sectional image corresponding to a target lesion, and analyzing the set of pixels with an image processing module to identify an upper and lower threshold of pixel intensities within a total range of pixel intensities, define a subset of pixels from the set of pixels that correspond to vascularized tumor and that have pixel intensities greater than or equal to the lower threshold and lower than or equal to the upper threshold, and derive a vascular tumor burden for the set of pixels. The method further includes determining the objective tumor response for the target lesion, wherein the objective tumor response is based on the vascular tumor burden.

Description

CROSS-REFERENCE TO RELATED APPLICATIONS[0001]This application is a continuation of U.S. patent application Ser. No. 15 / 407,662, which is a continuation of International Application No. PCT / US2016 / 030823, filed May 4, 2016, which claims the benefit of U.S. Provisional Patent Application No. 62 / 156,836 filed May 4, 2015, the disclosures of which are incorporated by reference in their entirety.BACKGROUNDTechnical Field[0002]The present invention relates generally to the collection, evaluation, and transformation of digital image files.Background and Relevant Art[0003]Advances in computing technology have resulted in a concomitant advance in medical device technologies, including within the field of diagnostic medicine. Particularly, the past century has demonstrated significant advances in medical imaging devices. Such advances have been hallmarked by the advent of radiologic devices such as computed tomography (CT; also known as x-ray computed tomography (x-ray CT) and computerized ax...

Claims


Application Information

Patent Timeline
Patent Type & Authority Applications(United States)
IPC IPC(8): A61B6/00G06T7/00
CPCG06T2207/30101G06T2207/20072A61B6/5211G06T7/90G06T7/0016G06T2207/30096G06T2207/10072G06V2201/032
Inventor SMITH, ANDREW DENNIS
Owner AI METRICS LLC
Learn More