X-ray fluorescence analysis method, x-ray fluorescence analysis program, and x-ray fluorescence spectrometer

a fluorescence analysis and fluorescence analysis technology, applied in the field of x-ray fluorescence analysis methods, x-ray fluorescence analysis programs, x-ray fluorescence spectrometers, can solve problems such as significant analysis errors

Active Publication Date: 2020-01-02
RIGAKU CORP
View PDF9 Cites 16 Cited by
  • Summary
  • Abstract
  • Description
  • Claims
  • Application Information

AI Technical Summary

Benefits of technology

[0020]A second aspect of the present invention is an X-ray fluorescence analysis program for causing an X-ray fluorescence spectrometer to execute the X-ray fluorescence analysis method according to the first aspect. A third aspect of the present invention is an X-ray fluorescence spectrometer provided with the X-ray fluorescence analysis program according to the second aspect. Also in the X-ray fluorescence analysis program according to the second aspect and the X-ray fluorescence spectrometer according to the third aspect, the same operation and effect as those of the X-ray fluorescence analysis method according to the first aspect can be obtained.

Problems solved by technology

However, in the FP method, when a sensitivity constant is obtained by using a standard sample in which the sum of the mass fractions of known components is 0.98 and an unknown sample having the same composition is analyzed, an inadequate analysis result indicating that the sum of the mass fractions of all the components is substantially 1 is obtained because of the aforementioned reason regarding the theoretical intensity formula, which may result in a significant analysis error.

Method used


Image

  • X-ray fluorescence analysis method, x-ray fluorescence analysis program, and x-ray fluorescence spectrometer
  • X-ray fluorescence analysis method, x-ray fluorescence analysis program, and x-ray fluorescence spectrometer
  • X-ray fluorescence analysis method, x-ray fluorescence analysis program, and x-ray fluorescence spectrometer

Examples


first embodiment

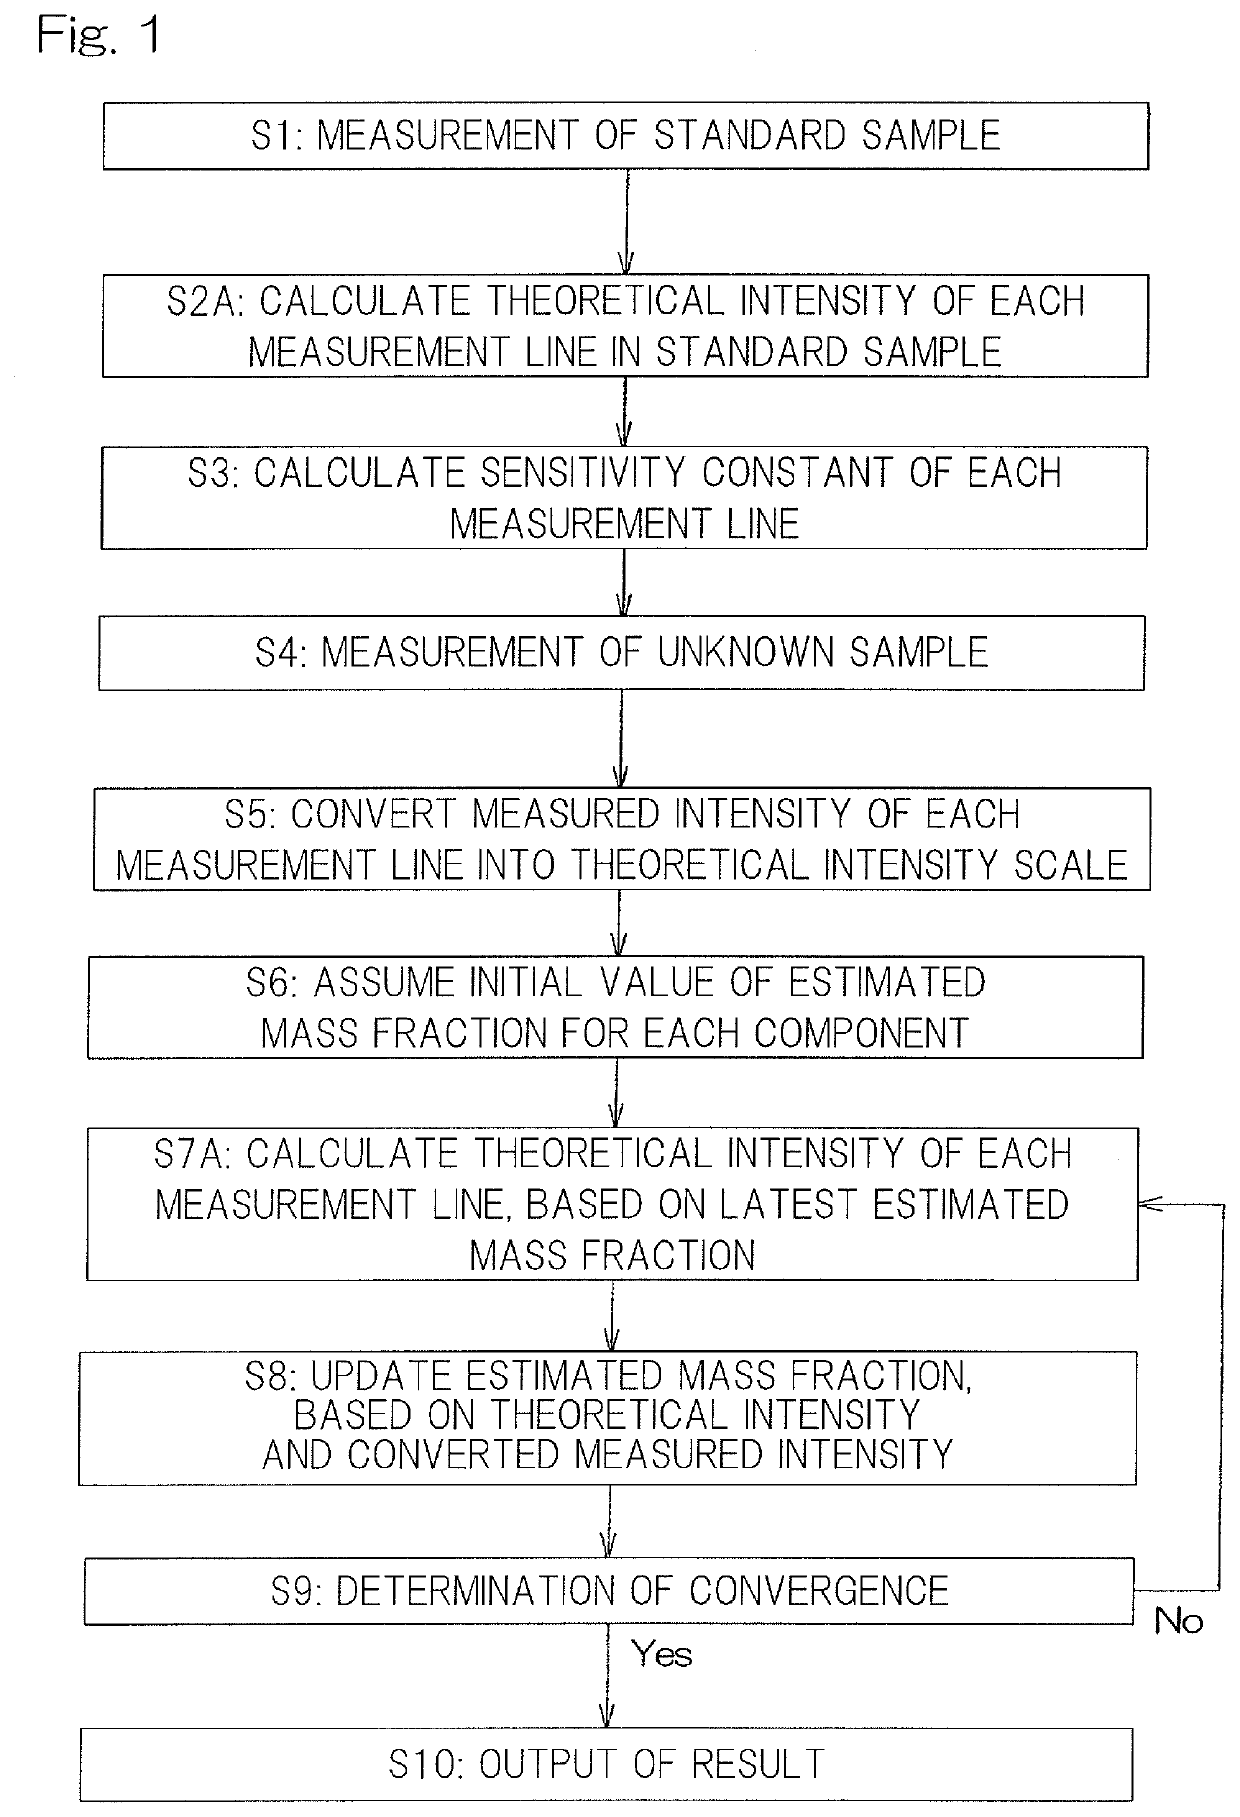
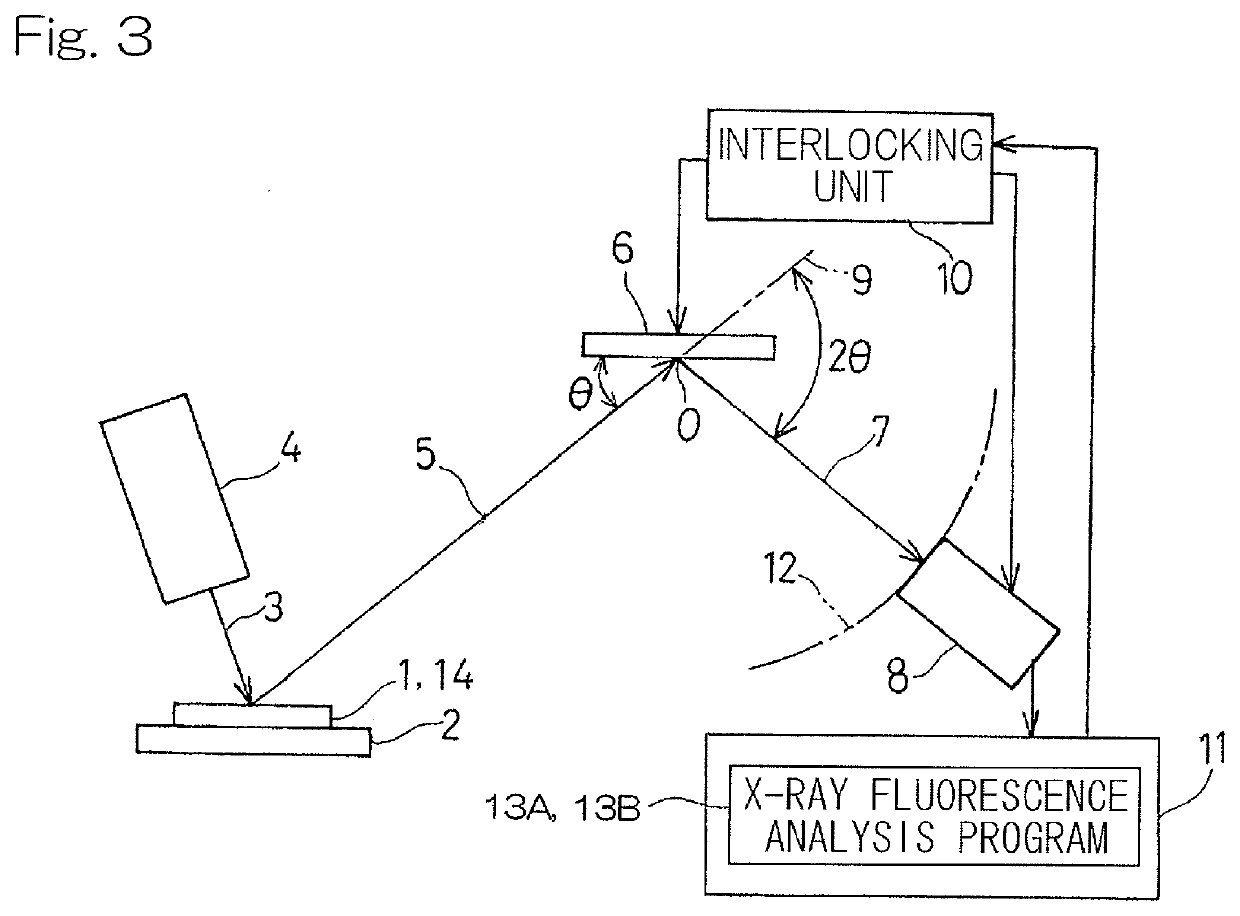
[0027]Hereinafter, an X-ray fluorescence analysis method according to the present invention will be described. First, an X-ray fluorescence spectrometer used for the X-ray fluorescence analysis method will be described. As shown in FIG. 3, this spectrometer is a sequential X-ray fluorescence spectrometer that irradiates a sample 1, 14 (including both an unknown sample 1 and a standard sample 14) with primary X-rays 3, and measures intensities of generated secondary X-rays 5. The X-ray fluorescence spectrometer includes: a sample stage 2 on which the sample 1, 14 is placed; an X-ray source 4 such as an X-ray tube which irradiates the sample 1, 14 with the primary X-rays 3; a spectroscopic device 6 which monochromates the secondary X-rays 5 such as fluorescent X-rays generated from the sample 1, 14; and a detector 8 on which secondary X-rays 7 monochromated by the spectroscopic device 6 are incident and which detects the intensity of the secondary X-rays 7. An output from the detector...

second embodiment

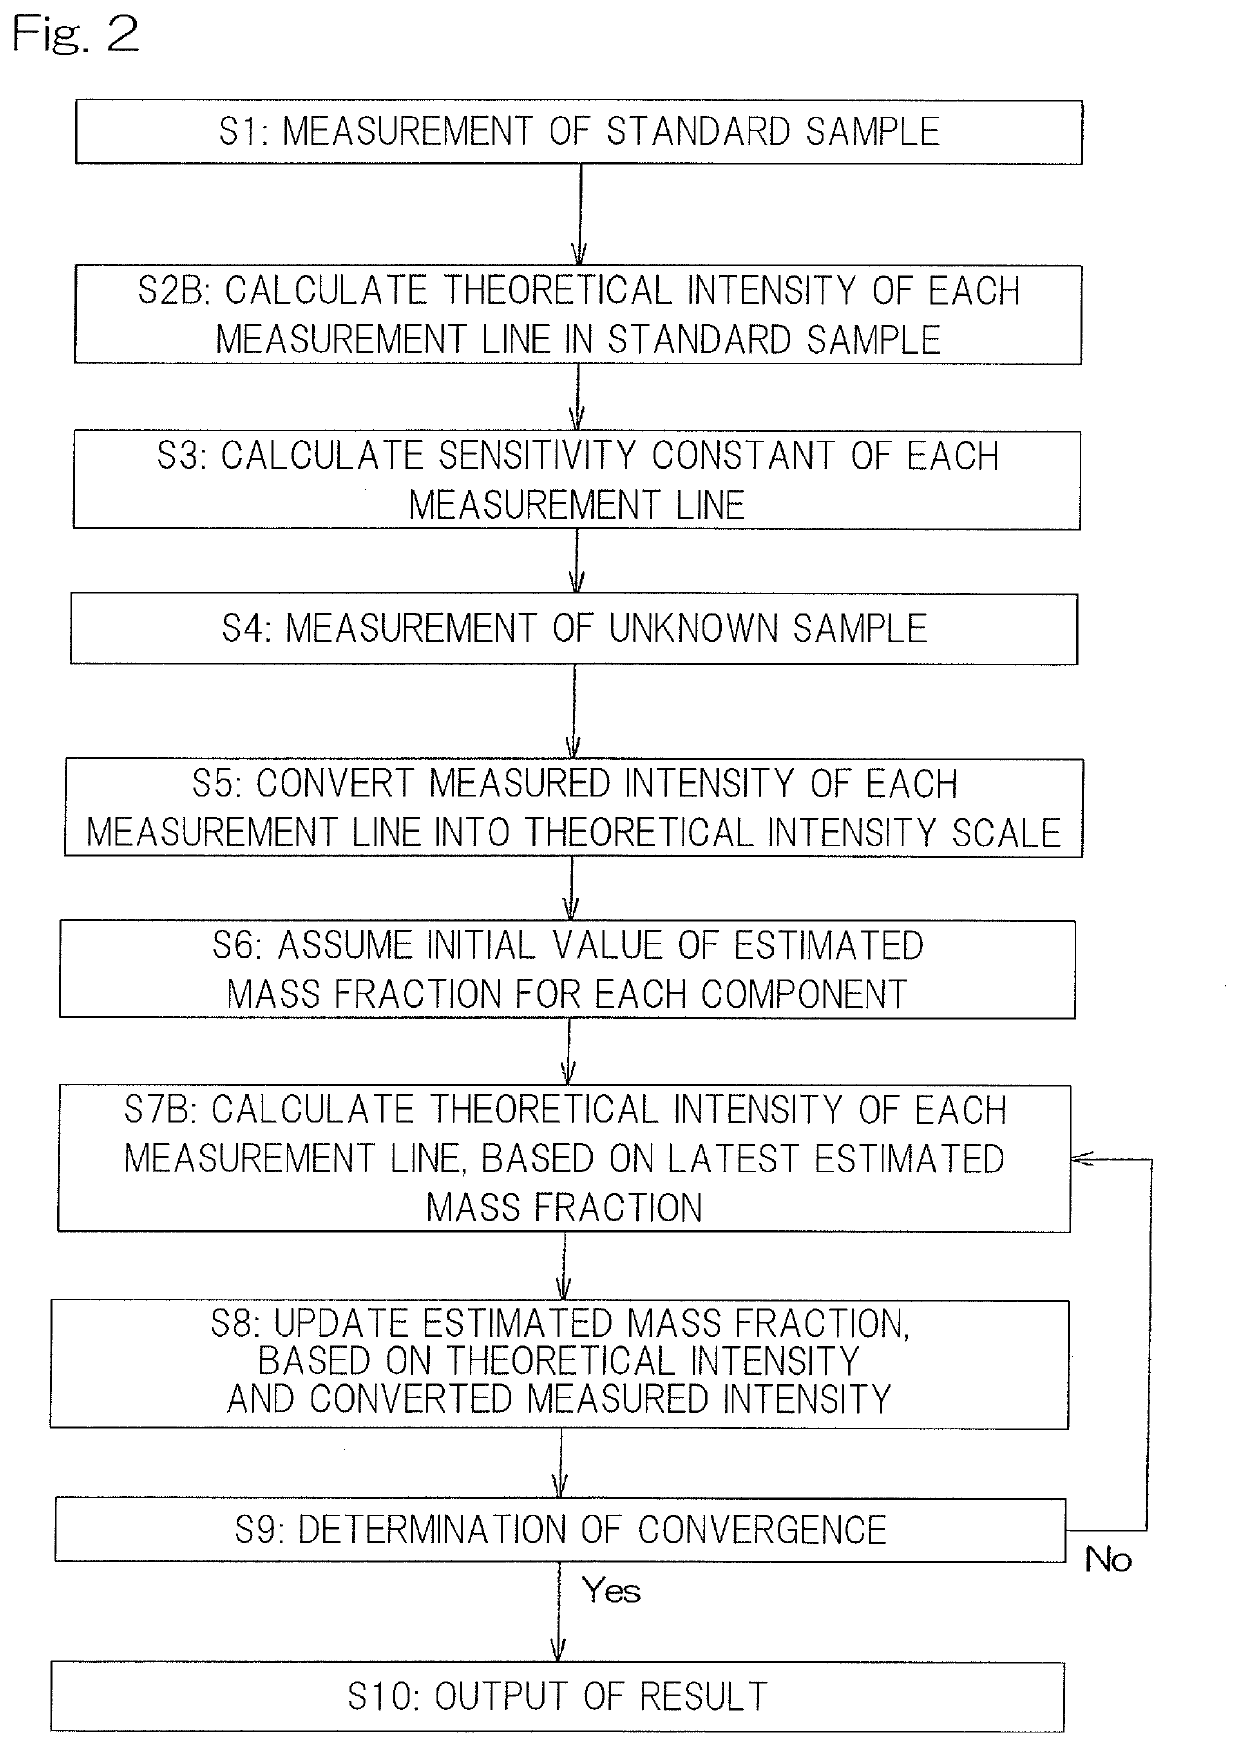
[0052]The X-ray fluorescence analysis method of the second embodiment is verified through simulations as follows. First, a standard sample 14 is assumed which is composed of two elements, Fe and Ni, and in which a mass fraction WFe of Fe is 0.50, a mass fraction WNi of Ni is 0.49, and the sum of the mass fractions of all the components is not 1 but 0.99. Fluorescent X-rays to be measured are Fe—Kα line and Ni—Kα line. A measurement intensity IFeMS of Fe—Kα line is 200.0, and a measurement intensity INiMS of Ni—Kα line is 100.0. As for Fe, Ni is specified as a base component. As for Ni, Fe is specified as a base component.

[0053]According to the above setting, a theoretical intensity IFeTS=2753.6 of Fe—Kα line and a theoretical intensity INiTS=1278.1 of Ni—Kα line are calculated in the standard sample theoretical intensity calculation step S2B, and a sensitivity constant AFe=13.768 of Fe—Kα line and a sensitivity constant ANi=12.781 of Ni—Kα line are calculated in the sensitivity cons...


PUM

PropertyMeasurementUnit
mass fractionaaaaaaaaaa
fluorescence analysisaaaaaaaaaa
fluorescenceaaaaaaaaaa

Abstract

An X-ray fluorescence analysis method according to an FP method uses a predefined theoretical intensity formula in a standard sample theoretical intensity calculation step for obtaining a sensitivity constant and in an unknown sample theoretical intensity calculation step during iterative calculation. In the formula, only in an absorption term relating to absorption of X-rays, a mass fraction of each component is normalized so that a sum of the mass fractions of all components becomes 1.

Description

CROSS REFERENCE TO THE RELATED APPLICATION[0001]This application is a continuation application, under 35 U.S.C. § 111(a), of international application No. PCT / JP2018 / 010004, filed Mar. 14, 2018, which claims priority to Japanese patent application No. 2017-049447, filed Mar. 15, 2017, the entire disclosure of which is herein incorporated by reference as a part of this application.BACKGROUND OF THE INVENTIONField of the Invention[0002]The present invention relates to an X-ray fluorescence analysis method, an X-ray fluorescence analysis program, and an X-ray fluorescence spectrometer according to a fundamental parameter method.Description of Related Art[0003]Conventionally, a fundamental parameter method (FP method) has been known as an X-ray fluorescence analysis method including: irradiating a sample with primary X-rays; measuring intensities of secondary X-rays such as fluorescent X-rays generated from the sample; and performing qualitative analysis of, for example, the mass fracti...

Claims


Application Information

Patent Timeline
Patent Type & Authority Applications(United States)
IPC IPC(8): G01N23/223
CPCG01N23/223G01N2223/60G01N2223/076
Inventor KATAOKA, YOSHIYUKIKAWAKYU, KOSUKE
Owner RIGAKU CORP
Why Eureka
Try Eureka