
System and method for generating visual analytics and player statistics

a visual analytics and player technology, applied in the field of system and method for generating visual analytics and player statistics, can solve the problems of repetitive misjudgments, limited consistency, and lots of hours spent watching videos and annotating

Pending Publication Date: 2020-09-24
RGT UNIV OF CALIFORNIA
View PDF11 Cites 9 Cited by
  • Summary
  • Abstract
  • Description
  • Claims
  • Application Information

AI Technical Summary

Benefits of technology

This patent is about a way to improve the performance of generative adversarial networks (GANs) by using a strategy to train them. By adding more data to the training process, the system can learn to recognize and generate new data patterns, leading to better performance.

Problems solved by technology

This requires lots of hours spent watching videos and annotating them.
This approach to talent selection or recruitment is not informed by scientific evidence, but rather a coach's subjective preconceived notion of the ideal player, which may result in repetitive misjudgments and limited consistency.
In team-based sports, such as soccer, talent identification is a complex process due to the different qualities associated with performance, which includes personal and tactical attributes.
After camera calibration, detecting the position of players at a given moment of time and tracking them is the next step for generating useful visual analytics and player statistics, which can be extremely challenging.
In most sports, especially in soccer the players appear to be very small from the camera's perspective causing a lot of occlusions and since they wear similar colored jerseys it makes it very difficult to identify players.
The most common way to distinguish players is based on the color information of their jerseys, but this does not help to discriminate the players individually.
The drawback with this approach is that it requires a high-resolution camera setup and resources which may not be available.
Moreover, the camera is constantly being panned and zoomed depending on where the action is happening on the field focusing on only a few players which could lead to some players not being detected and, thus, not being able to generate proper statistics.
Both of these approaches have problems when players are dense in one small area causing too many occlusions.
Although, the prototype integrates and creates an interactive system for sports visual analytics, the process is not automated and requires hours of videos to be analyzed by scouts to find the most promising talents.

Method used


Image

  • System and method for generating visual analytics and player statistics
  • System and method for generating visual analytics and player statistics
  • System and method for generating visual analytics and player statistics

Examples


Embodiment Construction

[0032]For the purpose of illustrating the invention, there is shown in the accompanying drawings several embodiments of the invention. However, it should be understood by those of ordinary skill in the art that the invention is not limited to the precise arrangements and instrumentalities shown therein and described below.

[0033]The system and method for generating visual analytics and player statistics is disclosed in accordance with preferred embodiments of the present invention is illustrated in FIGS. 1-10 wherein like reference numerals are used throughout to designate like elements.

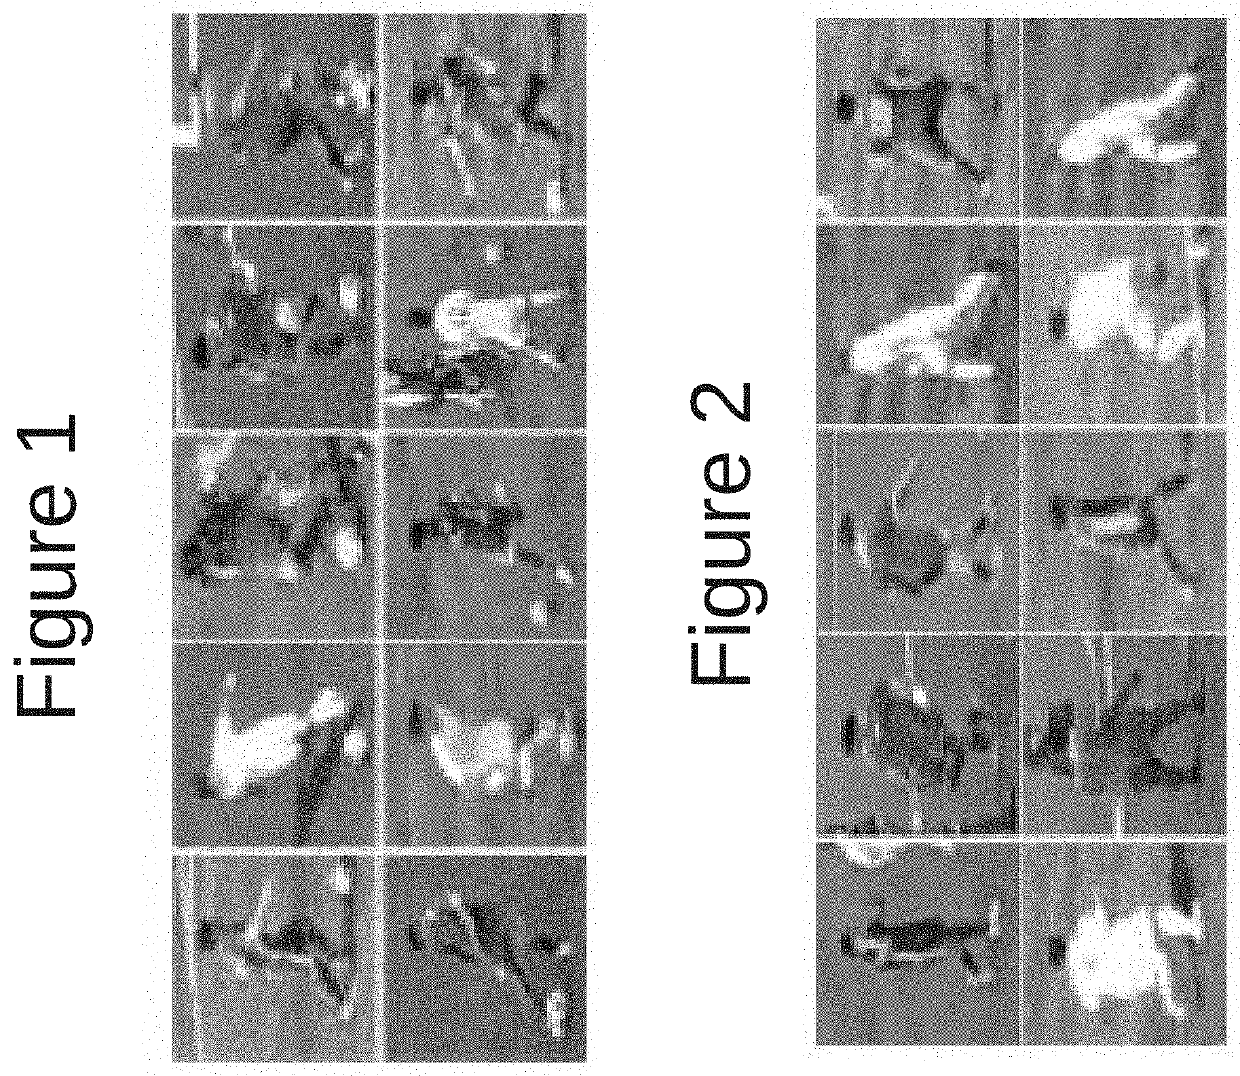
[0034]In one experimental embodiment, a dataset was collected that consists of 49,952 images which are annotated into two classes, namely: players with the ball (12,586 images) and players without the ball (37,366 images). FIG. 1 shows examples of players with the ball and FIG. 2 shows examples of players without the ball, respectively, from the dataset. In one embodiment, the system detects the socce...


PUM


Abstract

A system and method described herein is effective for generating automated visual analytics and player statistics for videos of sporting events. A dataset of videos is collected that comprises multiple teams. Training the networks on RGB and grayscale images affects the generalization ability of the network learned and augmenting more images using generative adversarial networks to the dataset helps further improves the performance.

Description

RELATED APPLICATION INFORMATION[0001]This application claims priority from U.S. Provisional Application Ser. No. 62 / 822,497, entitled “Generating Visual Analytics and Player Statistics for Soccer”, filed Mar. 22, 2019, the entirety of which is hereby incorporated by reference.FIELD OF THE INVENTION[0002]The invention relates to a system and method for generating visual analytics and player statistics. More specifically, the system and method is used for talent identification, analysis and selection of athletes.BACKGROUND OF THE INVENTION[0003]The world of sports intrinsically involves fast and complex events that are difficult for coaches, trainers and players to analyze, and also for audiences to follow. In sports, talent identification and selection are imperative for the development of future elite level performers. Current scenarios involve word-of-mouth, coaches and recruiters scouring through hours of videos and, many times, manual annotation of these videos.[0004]Computer vis...

Claims


Application Information

Patent Timeline
Patent Type & Authority Applications(United States)
IPC IPC(8): G06K9/00G06N3/04A63B24/00
CPCG06K9/00342G06N3/0454A63B24/0006G06K9/00724G06N3/088G06V10/82G06N3/047G06N3/048G06N3/045G06V20/42G06V40/23
Inventor BHANU, BIRTHEAGARAJAN, RAJKUMARPALA, FEDERICOZHANG, XIU
Owner RGT UNIV OF CALIFORNIA
Learn More