Augmented analytics techniques for generating data visualizations and actionable insights

a technology of data visualization and augmented analytics, applied in the field of data analytics and visualization techniques, can solve problems such as inability or feasible for users

Active Publication Date: 2020-11-05
SOFTWARE AG
View PDF0 Cites 1 Cited by
  • Summary
  • Abstract
  • Description
  • Claims
  • Application Information

AI Technical Summary

Benefits of technology

[0002]Business Intelligence (BI) refers to the concept of analyzing data from different sources and providing key performance indicators (KPIs), dashboards, reporting, and the like. This information is usable in connection with a wide variety of objectives including, for example, achieving targets, reducing manual / human effort of some tasks, and measuring tangible growth of an organization or portions within an organization. BI in this respect can be used to help identify machines correlated with high defect rates in products, predict effects of information technology (IT) systems upgrades, reveal where factory slowdowns occur, improve shipping and logistics operations, etc. The “B” in “BI” thus may be thought of as pertaining broadly to an organization's mission, regardless of what the intelligence is and / or how it is used. In other words, BI has applicability to a wide variety of industries, organizations, objectives, etc.
[0004]Augmented BI has many benefits. For example, it can bestow the power of data science to “citizen data scientists.” A citizen data scientist in this sense is a person in a role tasked with analyzing data, and creating data and business models for an organization, e.g., with the help of Big Data tools and technologies. Augmented BI also can be helpful in finding data patterns and outliers that can easily be missed by human analysts working alone, or working with rudimentary computing and analysis tools. Analysis of data can, for example, be performed using machine learning techniques, and actionable insights can be generated using natural language generation (NLG) and / or other Artificial Intelligence related (AI) techniques. As is known, NLG technology focuses on generation of natural language or human-readable text from data using AI.

Problems solved by technology

Advantageously, the techniques described herein work with large datasets including, for example, datasets that have hundreds, thousands, or even more features, where it otherwise would not be possible or feasible for a user without data science knowledge to analyze the data.

Method used


Image

  • Augmented analytics techniques for generating data visualizations and actionable insights
  • Augmented analytics techniques for generating data visualizations and actionable insights
  • Augmented analytics techniques for generating data visualizations and actionable insights

Examples


Embodiment Construction

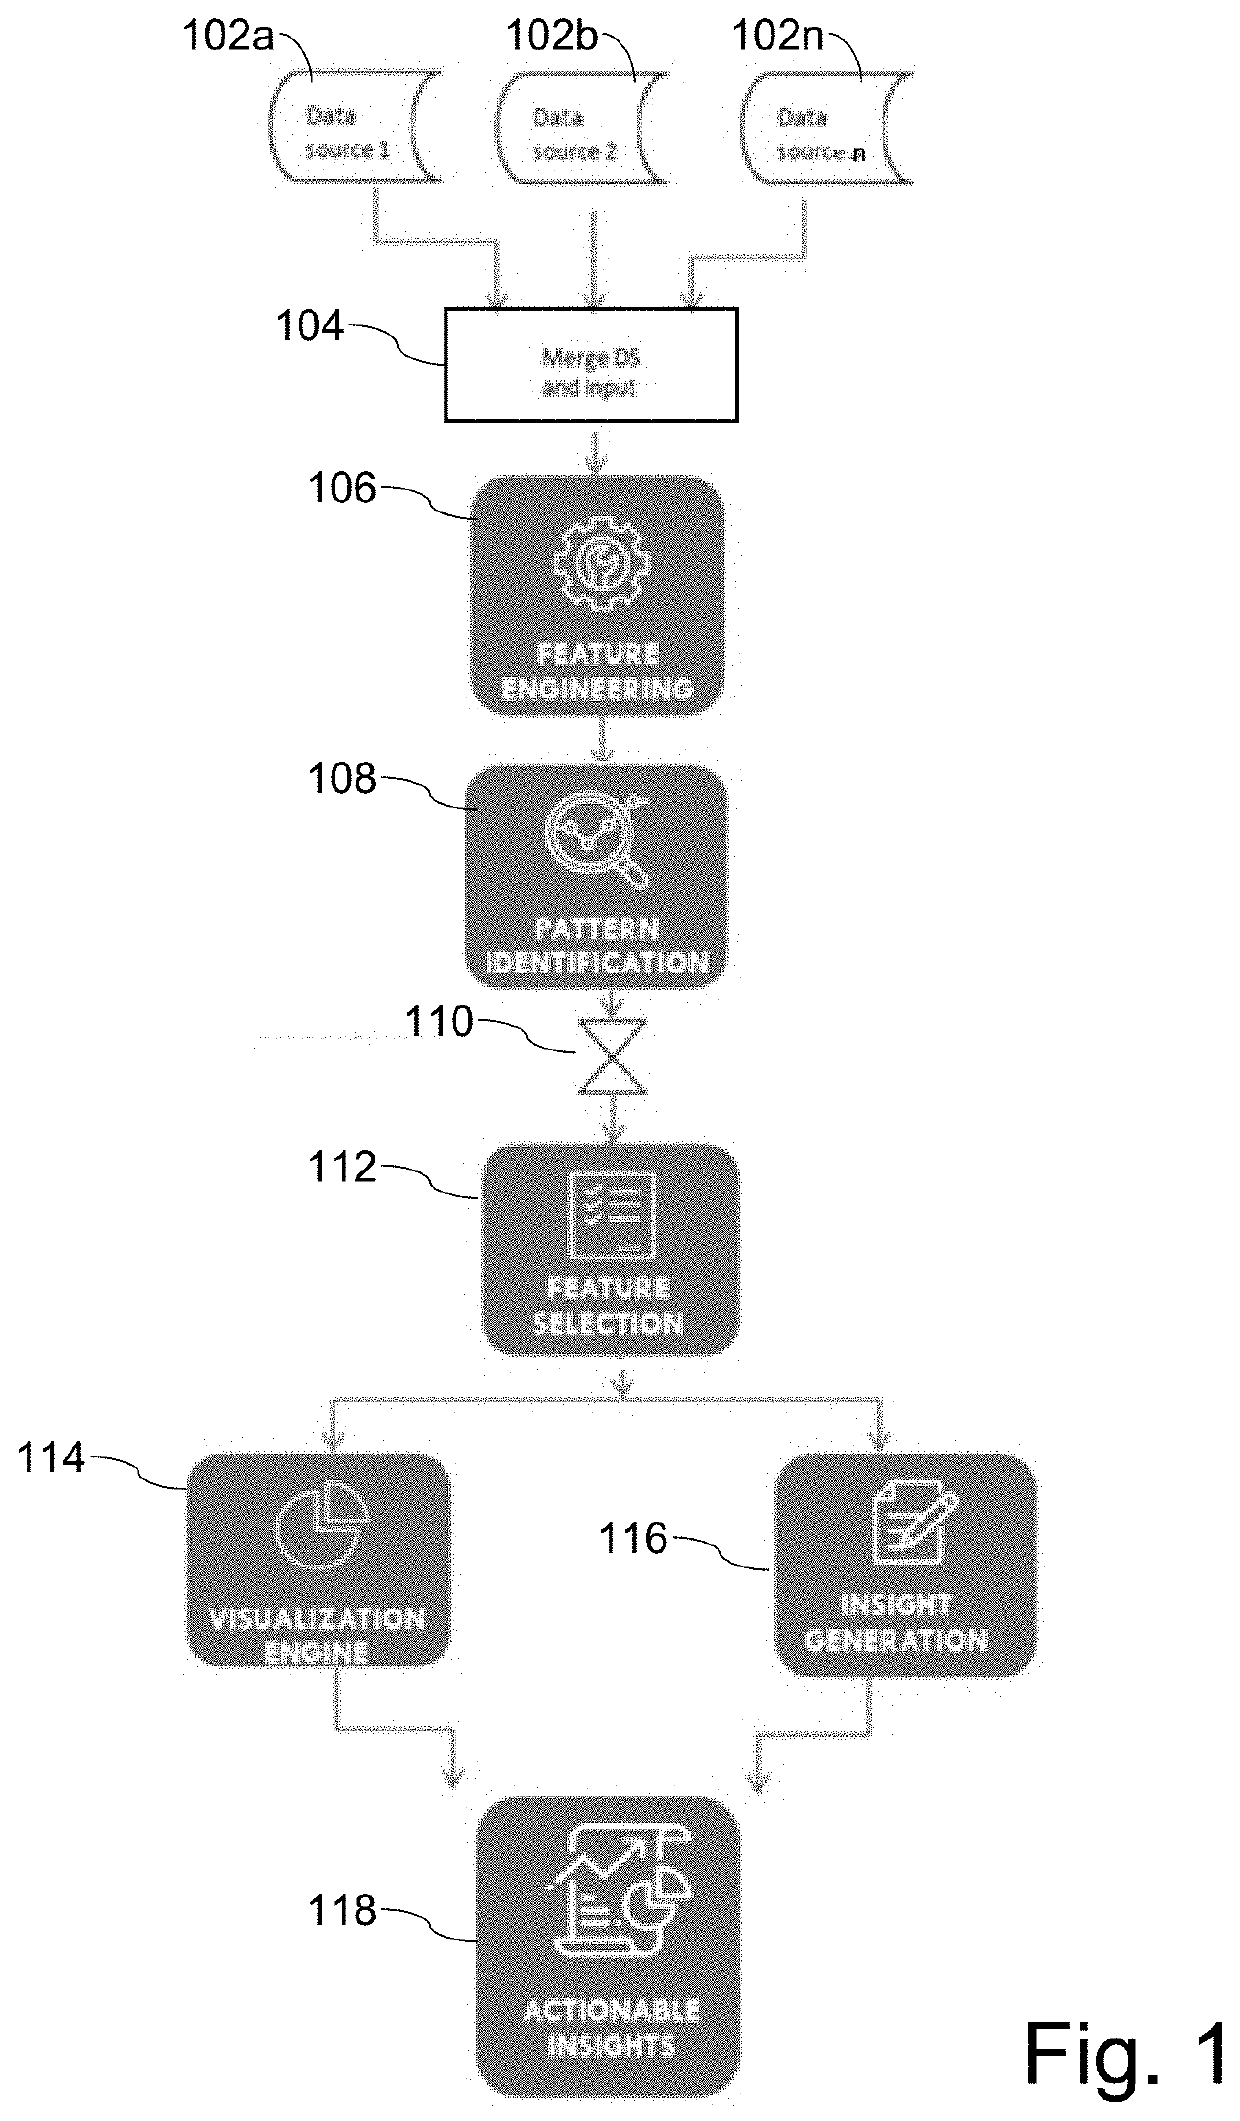
[0040]Certain example embodiments described herein relate to augmented analytics systems and methods for generating computer-based data visualizations and insights that are actionable, e.g., automatically in connection with a computing environment. In conventional and self-service business intelligence (BI) scenarios, the data sources are analyzed by specialized data scientists. These data scientists employ their domain expertise, their intuitions, and available tools to analyze the data. Their analysis involves more effort, could be biased (intentionally or unintentionally), and oftentimes will have a low accuracy. Certain example embodiments address these and / or other issues by bringing to bear machine learning (ML) and artificial intelligence (AI) technologies for automating the analysis workflow. In this regard, certain example embodiments implement machine-driven approaches for uploading or pushing data, analyzing it, identifying patterns, and generating actionable insights. In...


PUM


Abstract

A data analysis system is provided. Processing resources are configured to at least: identify features within a dataset, identify potential features of interest therefrom, and enable selection of one of the identified potential features of interest. Responsive to an identified potential feature of interest being selected: (a) algorithms are run on the dataset to identify at least one related feature that the selected feature of interest is most likely and / or most heavily influenced by; (b) a display is generated to include a visual representation of each related feature, each including associated data value representations; and (c) a visual representation can be selected. A data value representation is selectable together with the selected visual representation. Responsive selection of the visual representation, (a)-(c) are repeated. Responsive to a data value representation being selected in (c), the dataset is filtered based on it, and the repetition is performed with the filtered dataset.

Description

TECHNICAL FIELD[0001]Certain example embodiments described herein relate to data analytics and visualization techniques. More particularly, certain example embodiments described herein relate to augmented analytics systems and methods for generating computer-based data visualizations and insights that are actionable, e.g., automatically in connection with a computing environment.BACKGROUND AND SUMMARY[0002]Business Intelligence (BI) refers to the concept of analyzing data from different sources and providing key performance indicators (KPIs), dashboards, reporting, and the like. This information is usable in connection with a wide variety of objectives including, for example, achieving targets, reducing manual / human effort of some tasks, and measuring tangible growth of an organization or portions within an organization. BI in this respect can be used to help identify machines correlated with high defect rates in products, predict effects of information technology (IT) systems upgra...

Claims


Application Information

Patent Timeline
Patent Type & Authority Applications(United States)
IPC IPC(8): G06F16/26G06F16/248G06T11/20
CPCG06F16/248G06F16/26G06T11/206G06F3/0484
Inventor RAJENDIRAN, GOPINATHSRIDHARAN, AARADHANADEIVAMANI, VIDHYADHARANCHIDAMBARAM, VIJAY ANANDKALEX, ULRICH
Owner SOFTWARE AG
Why Eureka
Try Eureka