System and method for dossier creation with responsive visualization

US20210342766A1Active Publication Date: 2021-11-04MICROSTRATEGY

Image

  • System and method for dossier creation with responsive visualization
  • System and method for dossier creation with responsive visualization
  • System and method for dossier creation with responsive visualization

Examples


Embodiment Construction

[0020]Referring now to the drawings, and more particularly to FIGS. 1-21, there are shown exemplary embodiments of the method and structures according to the present invention.

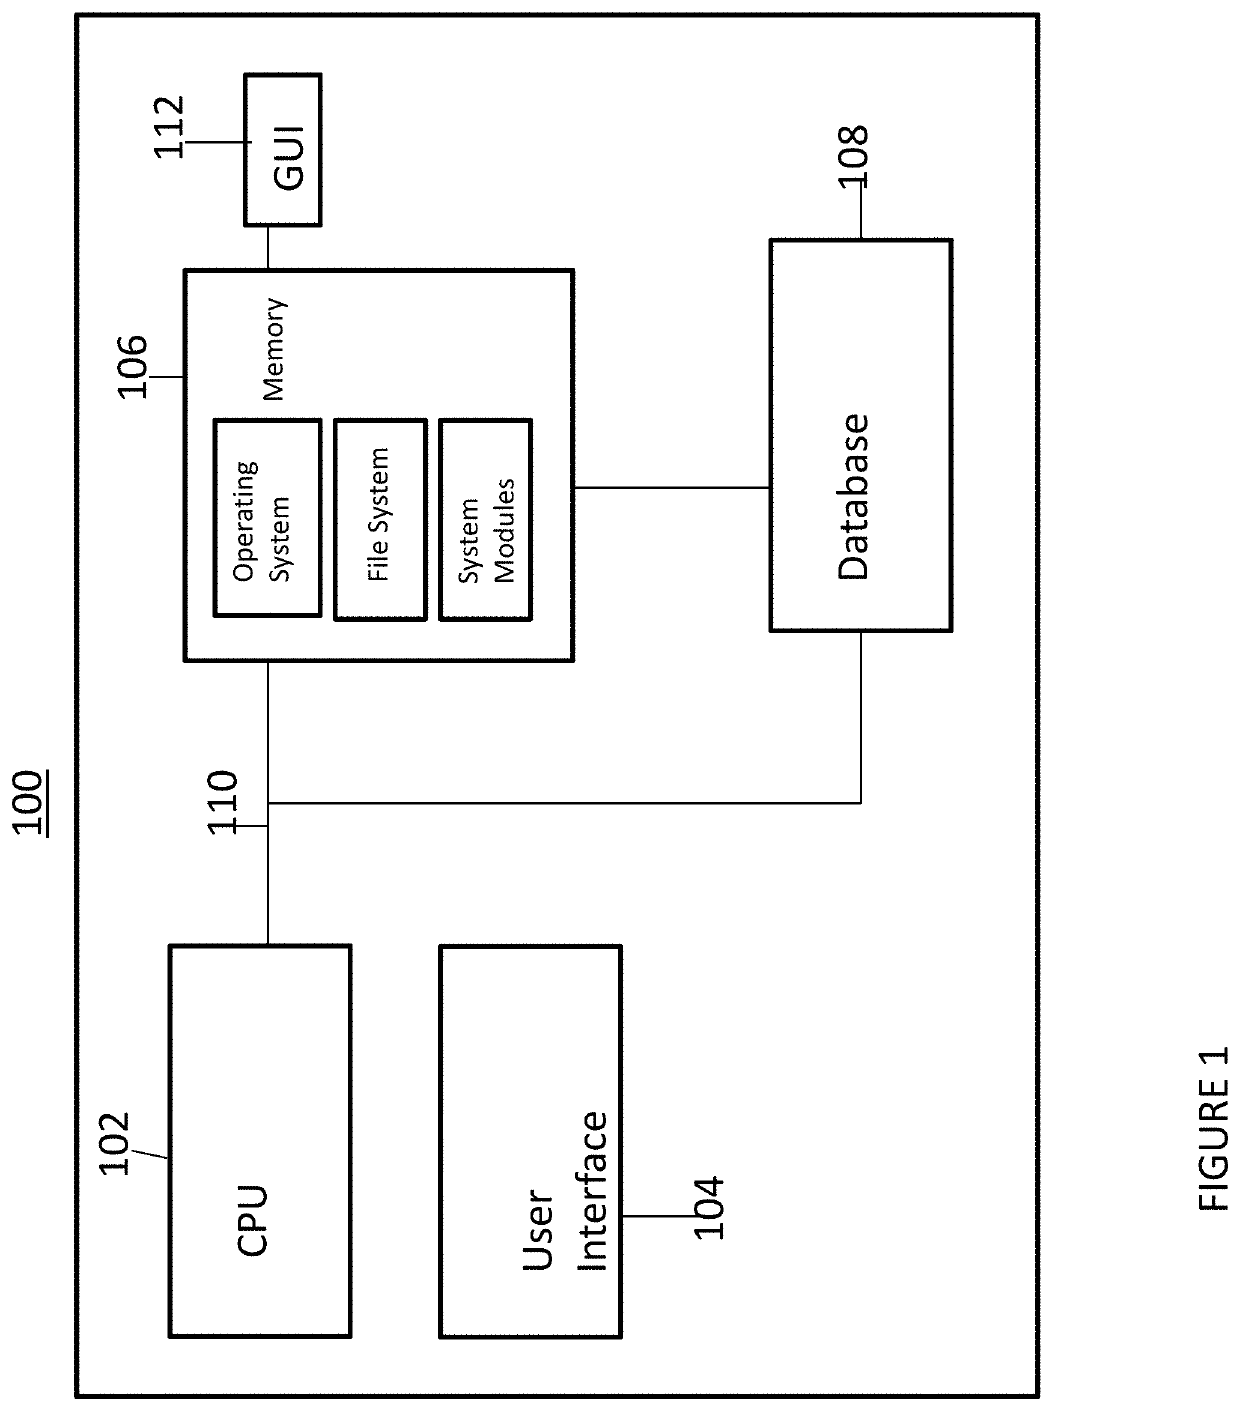
[0021]FIG. 1 is a block diagram illustrating a system 100 according certain exemplary aspects of the invention. Specifically, the system 100 is configured to create reports / documents / dossiers including a visualization of one or more datasets. As is illustrated in FIG. 1, the system 100 includes a CPU 102 having a user interface 104 (e.g., mouse, keyboard, touch screen, etc.). The CPU 102 is connected to a memory 106, storing an operating system, file system and computer system modules configured to perform the method of the present invention (e.g., process data and generate reports), and a database 108, storing one or more datasets, by a system bus 110. The system 100 includes a graphical user interface (GUI) 112 configured to receive and display a generated report.

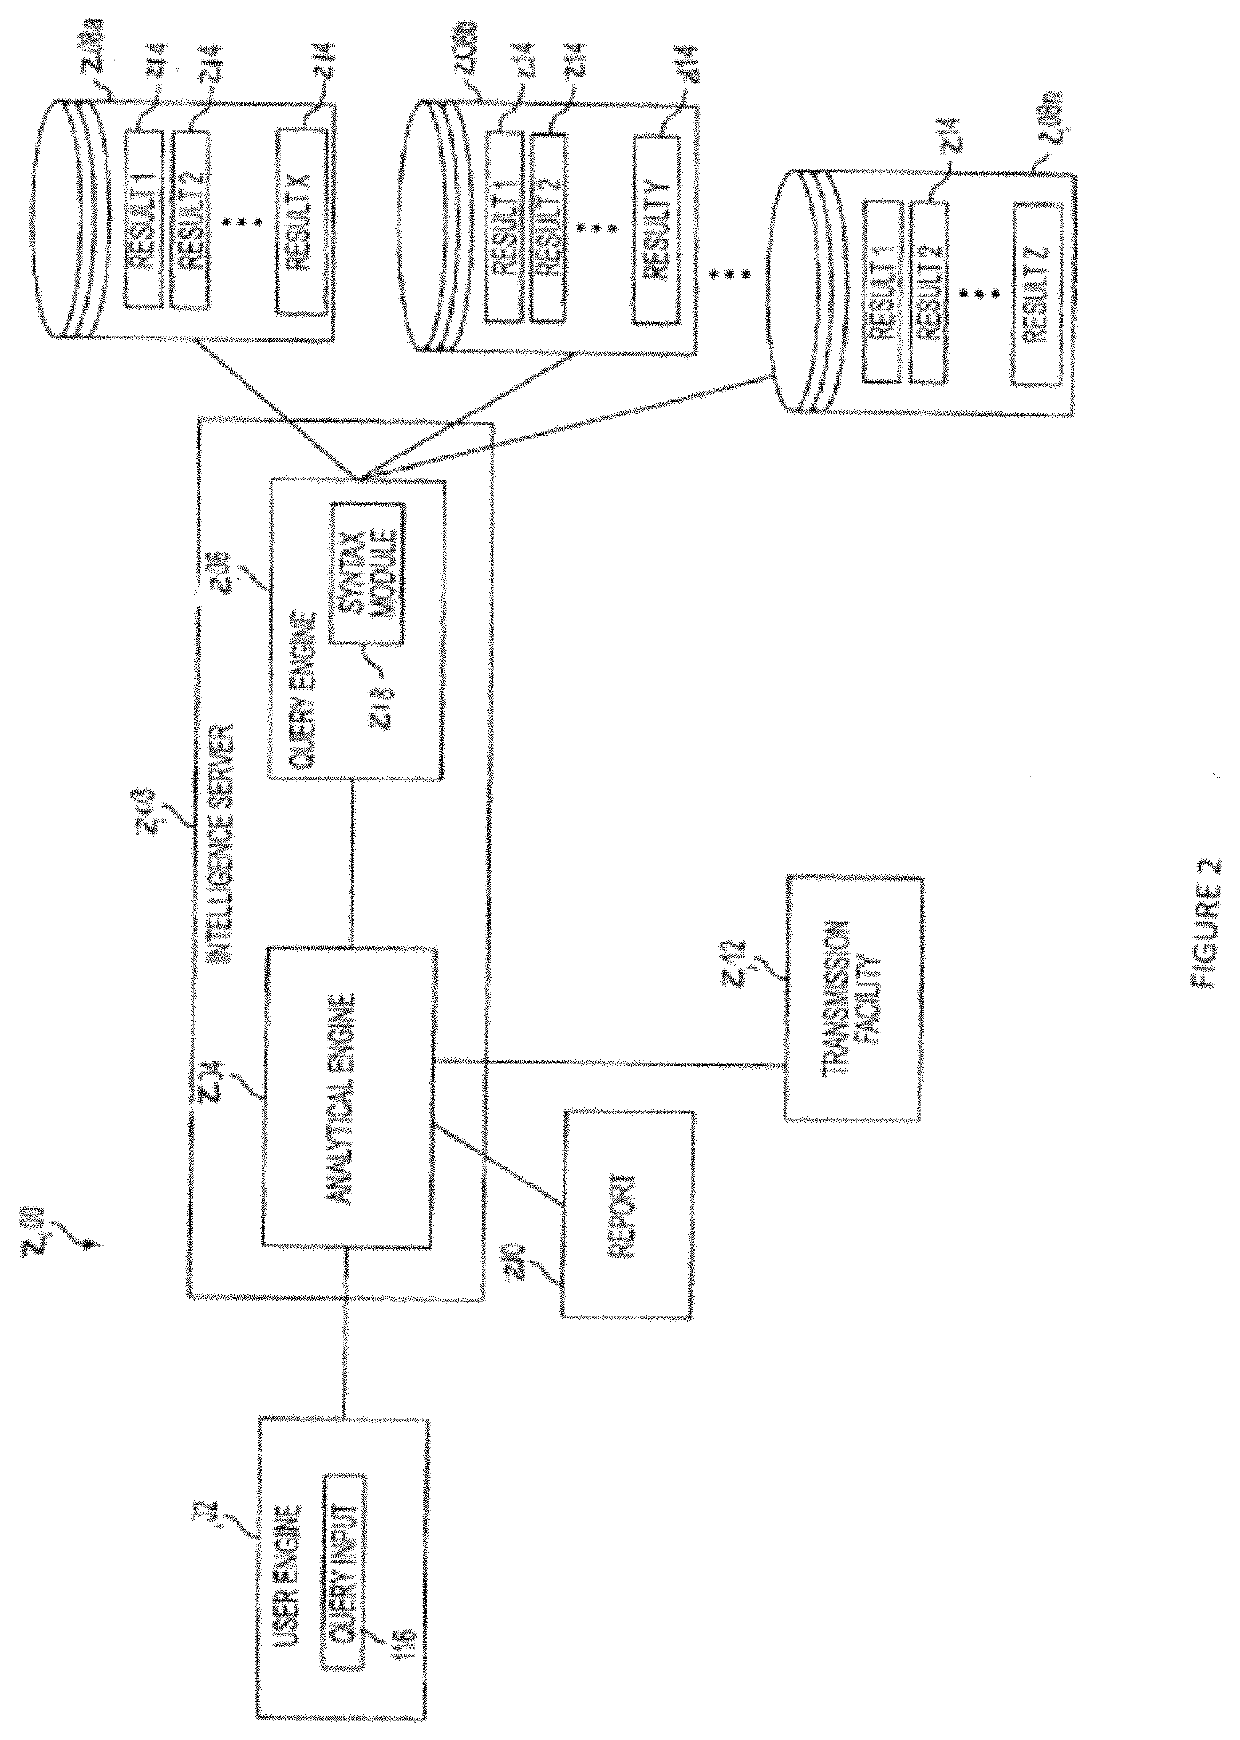
[0022]FIG. 2 further defines elements of the ...


PUM


Abstract

A method (and system) includes retrieving a dataset from a database, creating a report including a graphical representation of the dataset, the graphical representation of the dataset including a customizable, responsive visualization of a key performance indicator and displaying the report on a graphical user interface. The visualization of the key performance indicator displays all necessary data in a single visualization. The method (and system) provides responsive layout creating to automatically generate and arrange the visualization of the key performance indicator.

Description

BACKGROUND OF THE INVENTIONField of the Invention[0001]The present invention generally relates to a method and system for displaying data, and more particularly to a method and system for creating business analytic reports with responsive visualizations.Description of the Related Art[0002]Large databases are common in business today. Indeed, the amount of data available to business organizations today is rapidly increasing. Thus, a challenge for many organizations is to find a way to timely sort and present all relevant information while filtering unnecessary information.[0003]In reporting systems, such as decision support systems, business intelligence systems and on-line analytical processing (OLAP) systems, data sorting and extraction are used to retrieve and present data in an efficient manner. Additionally, the reporting systems provide a means for a user to clearly and creatively present an interactive visualization of the relevant data.[0004]Specifically, dossier building sys...

Claims


Application Information

Patent Timeline
04 Nov 2021
Publication
US20210342766A1
IPC
G06Q10/06; G06Q10/10; G06F16/248; G06F16/242; G06T11/20; G06F3/0482
CPC
G06Q10/06393; G06Q10/10; G06F3/0482; G06F16/2428; G06T11/206; G06F16/248; G06T2200/24
Inventors
WU, QIONG; ZHONG, XIAODI