Systems and methods for dynamic ingestion and inflation of data

a data system and data technology, applied in the field of systems and methods for receiving and analyzing data, can solve the problems of system intelligence or limited intelligence to perform analytical tasks, difficult, if not impossible, for individuals (or multiple individuals) to quickly retrieve and analyze, and achieve the effect of efficient and easy to understand

Inactive Publication Date: 2020-08-06
NODIN INC
View PDF0 Cites 1 Cited by
  • Summary
  • Abstract
  • Description
  • Claims
  • Application Information

AI Technical Summary

Benefits of technology

[0013]The foregoing systems and methods preferably comprise a system or subsystem referred to herein in varying embodiments as a “driver graph.” The driver graph preferably captures and presents a normally complex and interwoven series of “nodes” into an easily readable and navigable graphical representation. The incorporation of driver graphs, and the autonomous and semi-autonomous virtual analysts described below, removes a significant resource burden from business and financial analysts, among other analysts. For instance, the use of the novel driver graph topology described herein removes the time-consuming task of customizing business and / or financial analytics, and permits an analyst to focus on manipulating, interpreting or updating the driver graph. The amount of data that can be analyzed is also greatly increased through the use of well-designed interfaces. Furthermore, the creation of a driver graph may be largely or completely autonomous, thereby permitting users to create, ingest data for and inflate driver graphs for data sets that are far too large or complex to build manually.
[0014]According to one aspect of the present disclosure, systems and methods described in detail herein provide a user with autonomous virtual analyst(s) or module(s) (“analytical modules”) capable of completing a variety of tasks upon receiving an inquiry, instruction or command from a user. In embodiments, the analytical module may substitute for or otherwise provide the equivalent functions of a financial or business analyst, with the capabilities to interpret, analyze, compare, contrast, extrapolate, project or otherwise process information to provide the user with valuable business intelligence in a convenient, useable format.
[0016]It is yet another aspect to provide a user with an efficient way to obtain business intelligence with respect to data contained in one or more data repositories and modify the business intelligence through creation of one or more reports. By analyzing a larger set of data sources and combining them in a novel manner, and particularly when employed in combination with one or more driver graphs, the systems and methods described herein are configured to point out data relationships to the analyst that may inform the analyst's own work and downstream analysis, further enabling the analyst to adapt or modify the system to get to better, more relevant and more timely insights to other users in the business.

Problems solved by technology

Business and finance-related systems contain information in a variety of different manners, and increasingly contain a quantity of data that makes it difficult, if not impossible, for an individual (or multiple individuals) to quickly retrieve and analyze.
Large data sets concerning financial and / or business intelligence are increasingly being reviewed and modified, often by numerous individuals across multiple divisions, departments and organizations, causing further difficulties.
This creates discrepancies between one analytical approach and another, which in turn can create discrepancies when attempting to merge the analysis performed by one analyst with another, particularly where the analysts have different respective objectives.
Current state of the art business intelligence systems provide a lot of data to users, but such systems have limited or no intelligence to perform analytical tasks.
Prior art systems are typically devoid of pertinent domain knowledge, which is required to perform meaningful root cause analysis and / or performance assessment.
These systems are also complex, reactive, and require significantly more resources to operate.
Further, these systems are hard to scale, particularly when overwhelmed with data, as those of skill with Hadoop systems are familiar.
However, such applications are generally limited in the number of voice commands and simple queries those applications are able to interpret, and do not engage in ongoing dialog or maintain context over time.
Prior art applications also require significant training to understand a user's commands and maintain the context necessary to engage in bidirectional or other complex communications with a human user or fail to provide meaningful analysis and processing of data in the manner equivalent to a business or financial analyst.
Furthermore, current systems and methods for providing business insights are time consuming and inefficient, including insights provided in the form of memos, presentations, dashboards, charts, etc.
For example, key performance indicators (KPI) in present displays are often hard to use, especially when incorporating large amounts of data.
While attempts have been made to display large amounts of data (including business and financial data) to a user, such prior art displays suffer from numerous disadvantages.
Those disadvantages include requiring a user to manually define and manage a large number of data points, lack of automation in creating the display, inability to recognize anomalies or determine root causes, lack of dimensional and cross-dimensional relationships between data points, difficulties in managing scale and density of the data represented in the display, and other shortcomings.
Many of these systems cannot ingest all the data the user wants to ingest or analyze, and / or the number of dimensions in the dataset quickly overwhelms the prior art system's ingestion process.

Method used


Image

  • Systems and methods for dynamic ingestion and inflation of data
  • Systems and methods for dynamic ingestion and inflation of data
  • Systems and methods for dynamic ingestion and inflation of data

Examples


Embodiment Construction

[0040]The present disclosure has significant benefits across a broad spectrum of applications and endeavors. It is the Applicant's intent that this specification, and the claims appended hereto, be accorded a breadth in keeping with the scope and spirit of the disclosure and various embodiments disclosed, despite what might appear to be limiting language imposed by specific examples disclosed in any one or several embodiments. To acquaint persons skilled in the pertinent arts most closely related to the present disclosure, preferred and / or exemplary embodiments are described in detail without attempting to describe all of the various forms and modifications in which the novel systems and methods might be embodied. As such, the embodiments described herein are illustrative, and as will become apparent to those skilled in the arts, may be modified in numerous ways within the spirit of the disclosure.

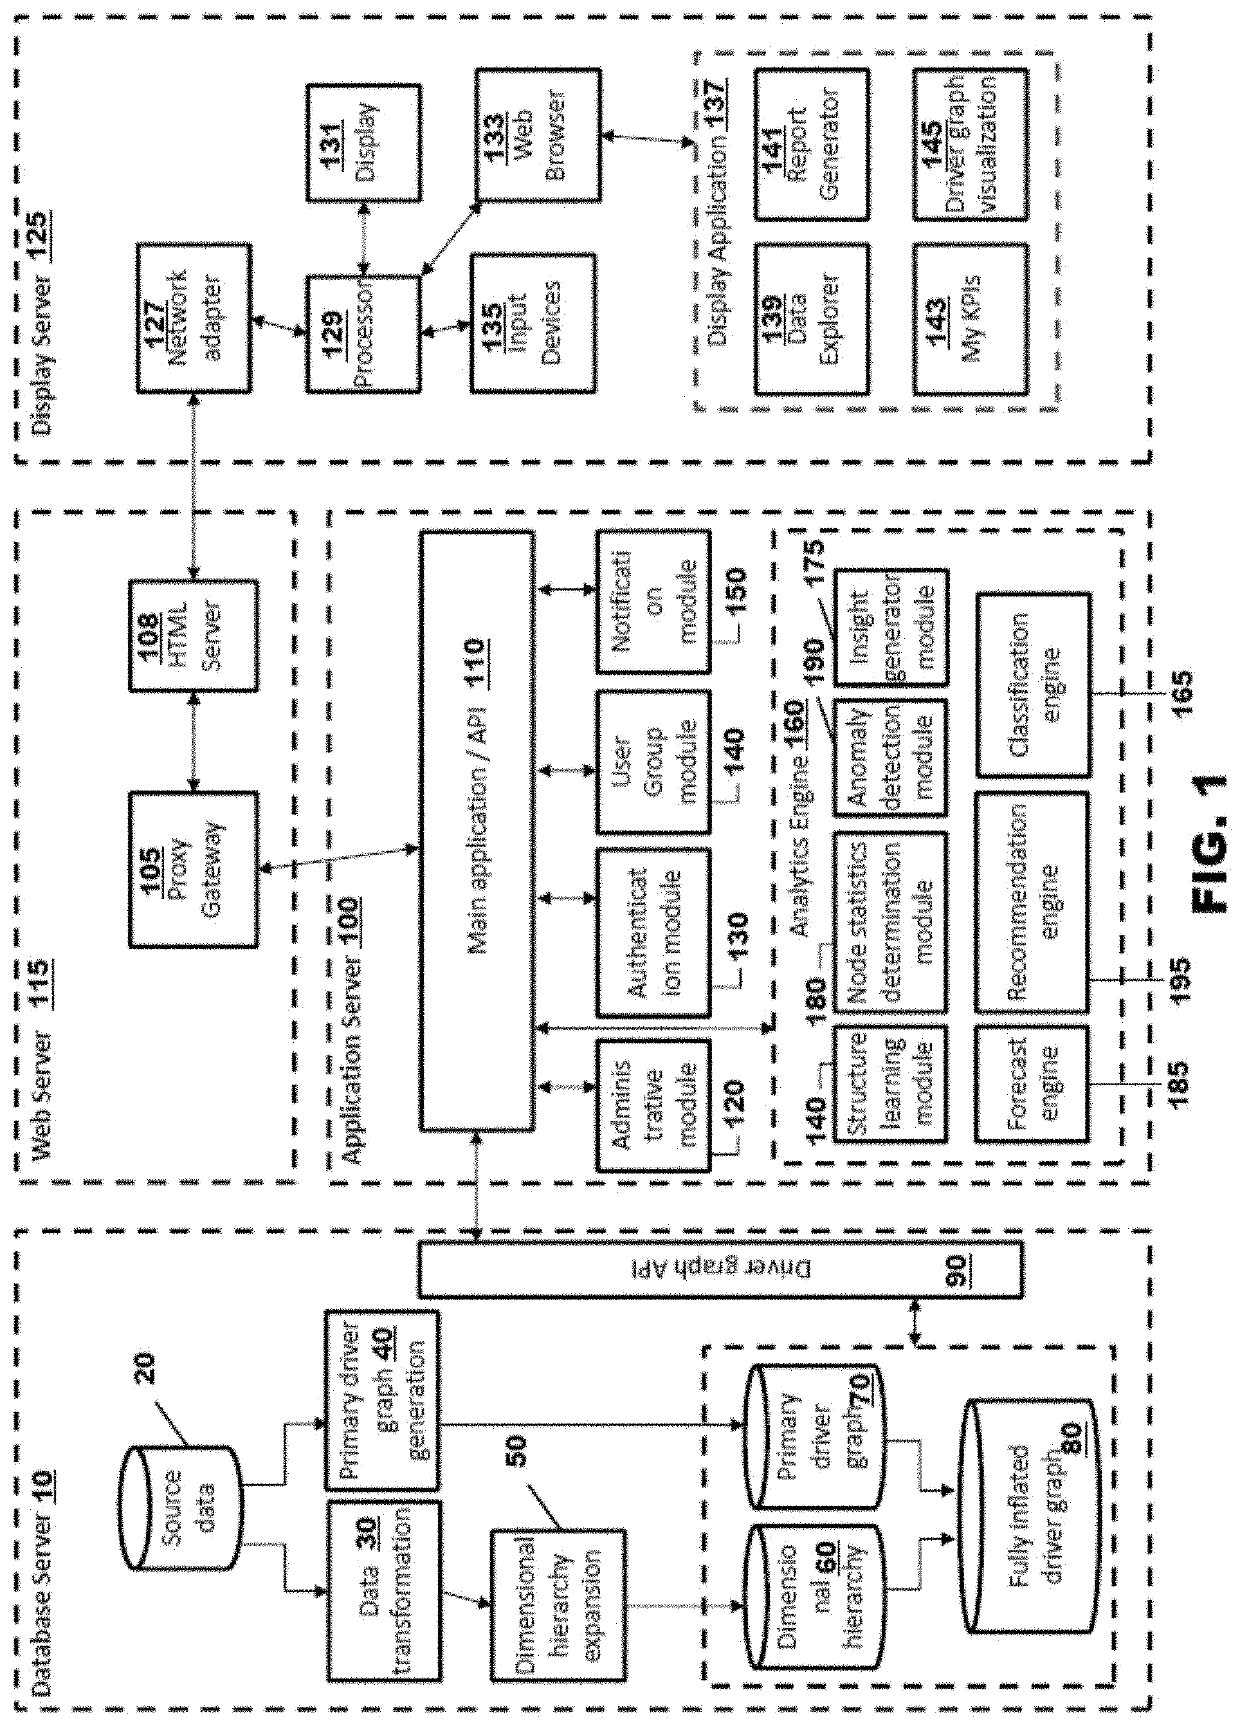
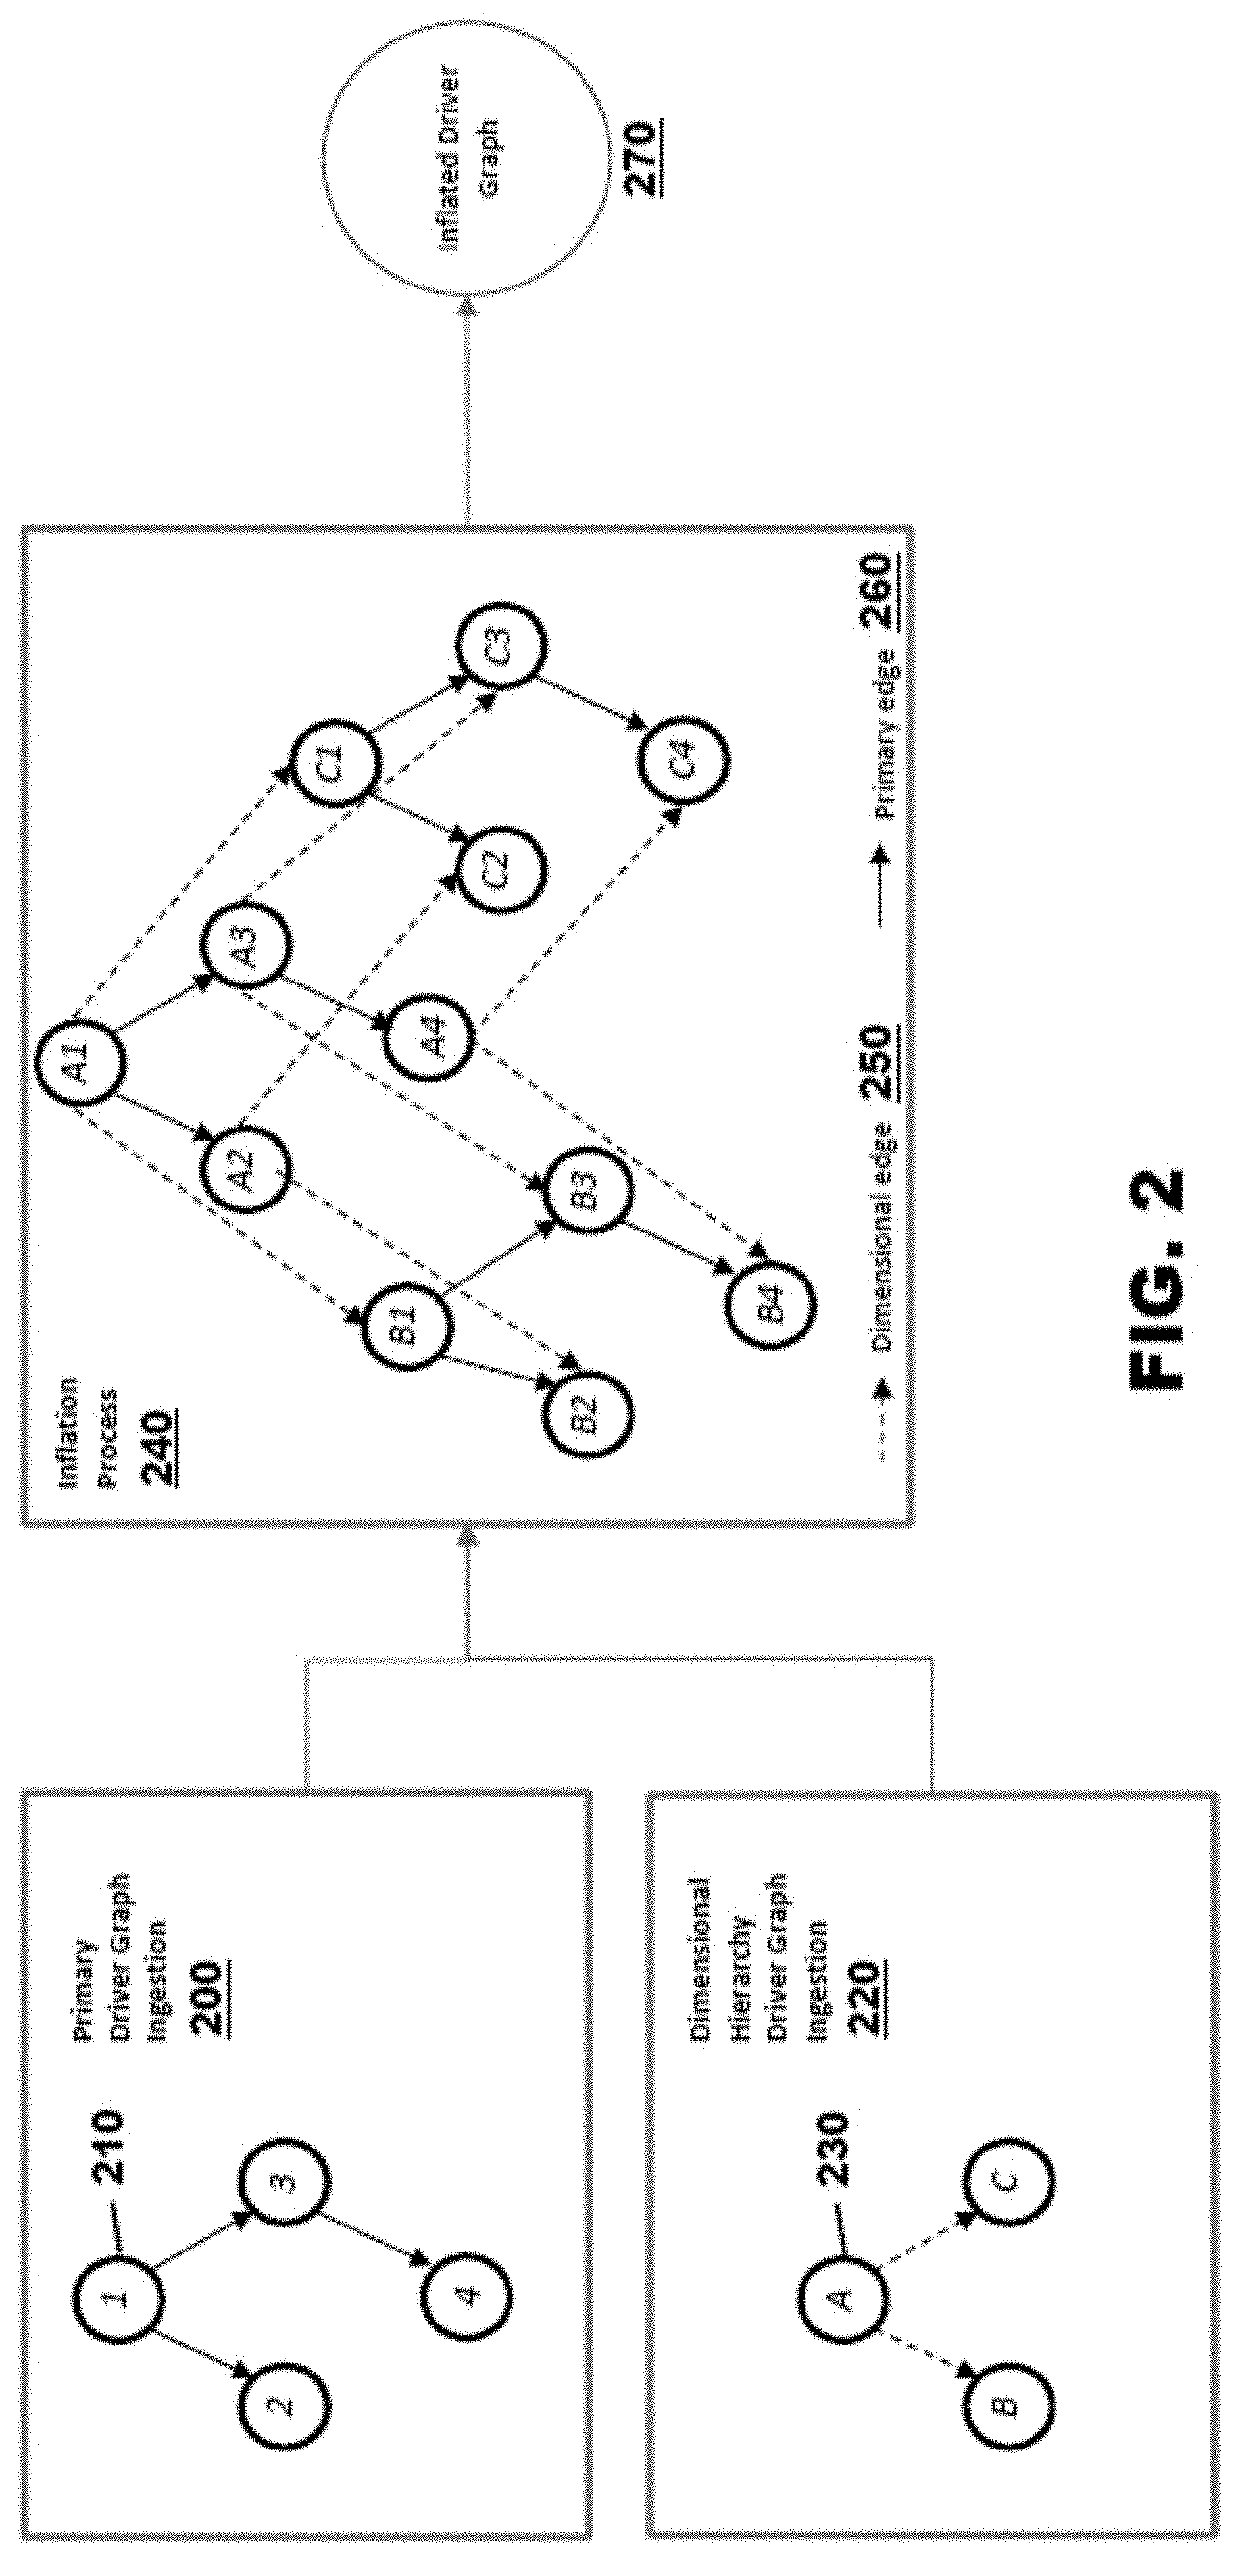
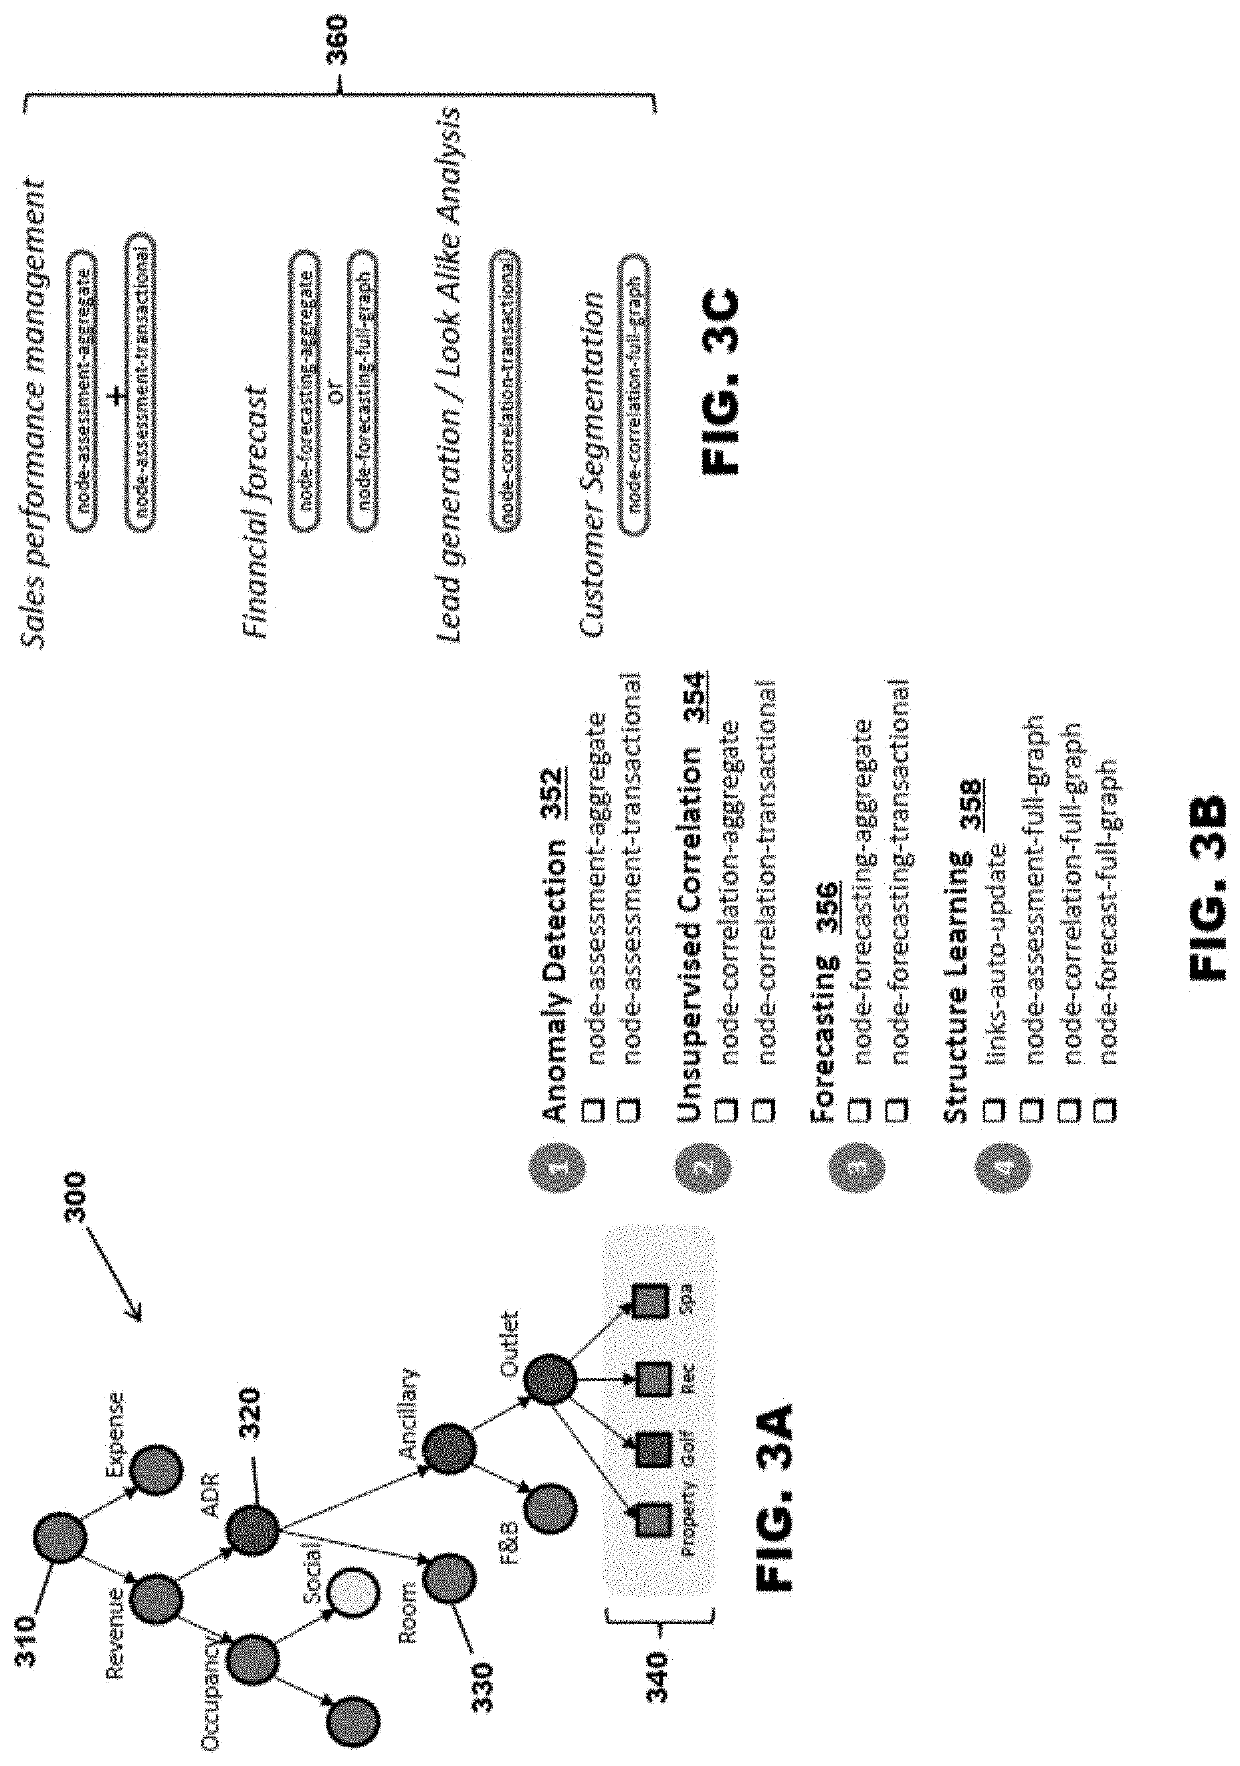
[0041]In embodiments, the systems and methods disclosed herein provide information to ...


PUM


Abstract

The present disclosure relates to systems and methods of autonomously or semi-autonomously generating a graph based upon ingested data, triggered by a user or a machine driven request, including for organizations that do not possess a fully ingested / inflated graph. Nodes of a graph may comprise expressions tied to specific data and / or data fields of the organization. Dimensional hierarchies may also be mapped to the specific data and / or data fields. Also disclosed are systems and methods for extrapolating and inflating ingested data and providing analysis to a user. The present disclosure also: (1) provides autonomous (or semi-autonomous) ingestion of data and inflation of a graph across potentially billions of nodes attributable to a particular organization; (2) retrieving insights and analysis on demand at various levels of detail; and (3) permits system resources to identify and analyze patterns, trends and anomalies in the graph for making adjustments and enhancements.

Description

CROSS-REFERENCE TO RELATED APPLICATIONS[0001]This application claims priority to and the benefit under 35 U.S.C. § 119(e) to U.S. Provisional Patent Application Ser. No. 62 / 834,298, filed Apr. 15, 2019, and is a continuation-in-part of U.S. patent application Ser. No. 16 / 141,751, filed Sep. 25, 2018, which in turn claims priority to U.S. Provisional Patent Application Ser. Nos. 62 / 625,645 filed on Feb. 2, 2018 and 62 / 562,910, filed on Sep. 25, 2017. Each of these patent applications is incorporated by reference herein in its entirety.FIELD OF THE INVENTION[0002]The present invention is generally directed toward systems and methods for receiving and analyzing data, and more specifically to systems and methods for autonomously ingesting, inflating, analyzing, processing and supplying information in response to an inquiry, instruction or command.COPYRIGHT NOTICE[0003]A portion of this disclosure is subject to copyright protection. Limited permission is granted to facsimile reproduction...

Claims


Application Information

Patent Timeline
Patent Type & Authority Applications(United States)
IPC IPC(8): G06F16/901G06F16/908G06F16/31G06Q10/06
CPCG06Q10/067G06F16/9024G06F16/322G06F16/908G06F16/26
Inventor SEIGEL, ROBERT BRIANEUBANKS, CURTIS RAYELISSEEFF, PIERRETARASI, DAVIDDOLLIVER, GARYCAZACU, EUGENIU
Owner NODIN INC
Why Eureka
Try Eureka