

Quickly Identifying RF Signals of Interest in RF Data Recordings
- Summary
- Abstract
- Description
- Claims
- Application Information
AI Technical Summary
Benefits of technology
Problems solved by technology
Method used
Image


Examples
example
[0037]FIG. 1 is a spectrographic display showing the 200 KByte compressed bitmap image file that contains the summarized spectral information of the disclosed technique. In this non-limiting example, the recording duration processed was 4.5 seconds using a 450 MHz span centered at 2.455 MHz which requires an I / Q file size of 9.7 GB. By using the disclosed technique to summarize the large I / Q file, the small bitmap image can be easily accessed over low bandwidth data links and used to determine if there are signals of further interest.
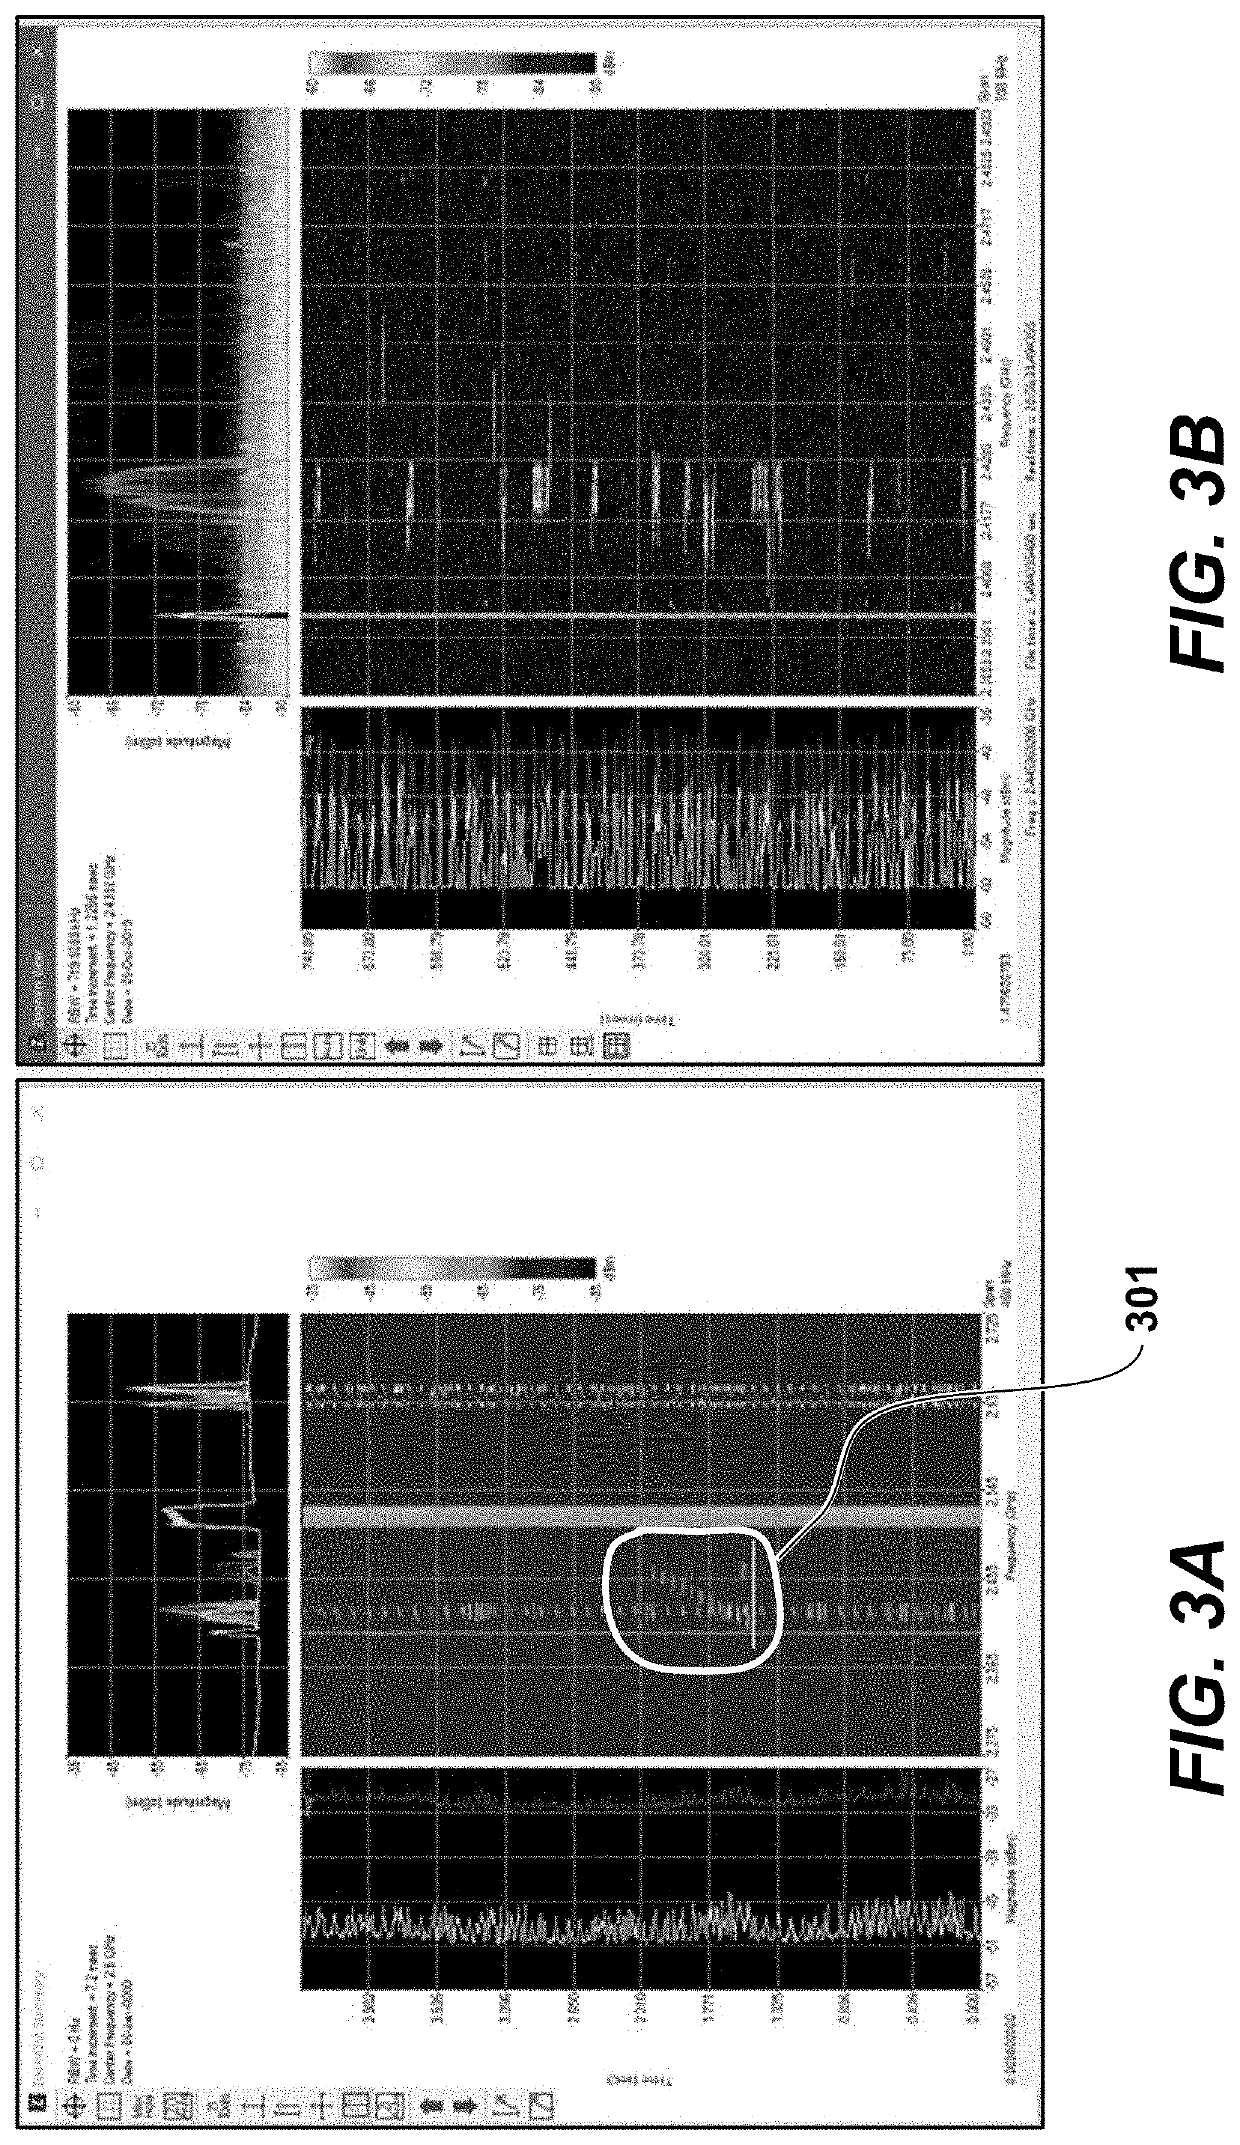
[0038]FIG. 2 is a spectrographic display showing a signal behavior that was flagged for further analysis. An analyst looking at the image, or algorithm programmed to examine and automatically analyze the image, would be able to draw a box around the signal of interest and automatically request the I / Q data necessary for detailed analysis of the selected waveform. If deemed important, only the small amount of relevant I / Q data would need to be saved to d...
PUM
 Abstract
Description
Claims
Application Information